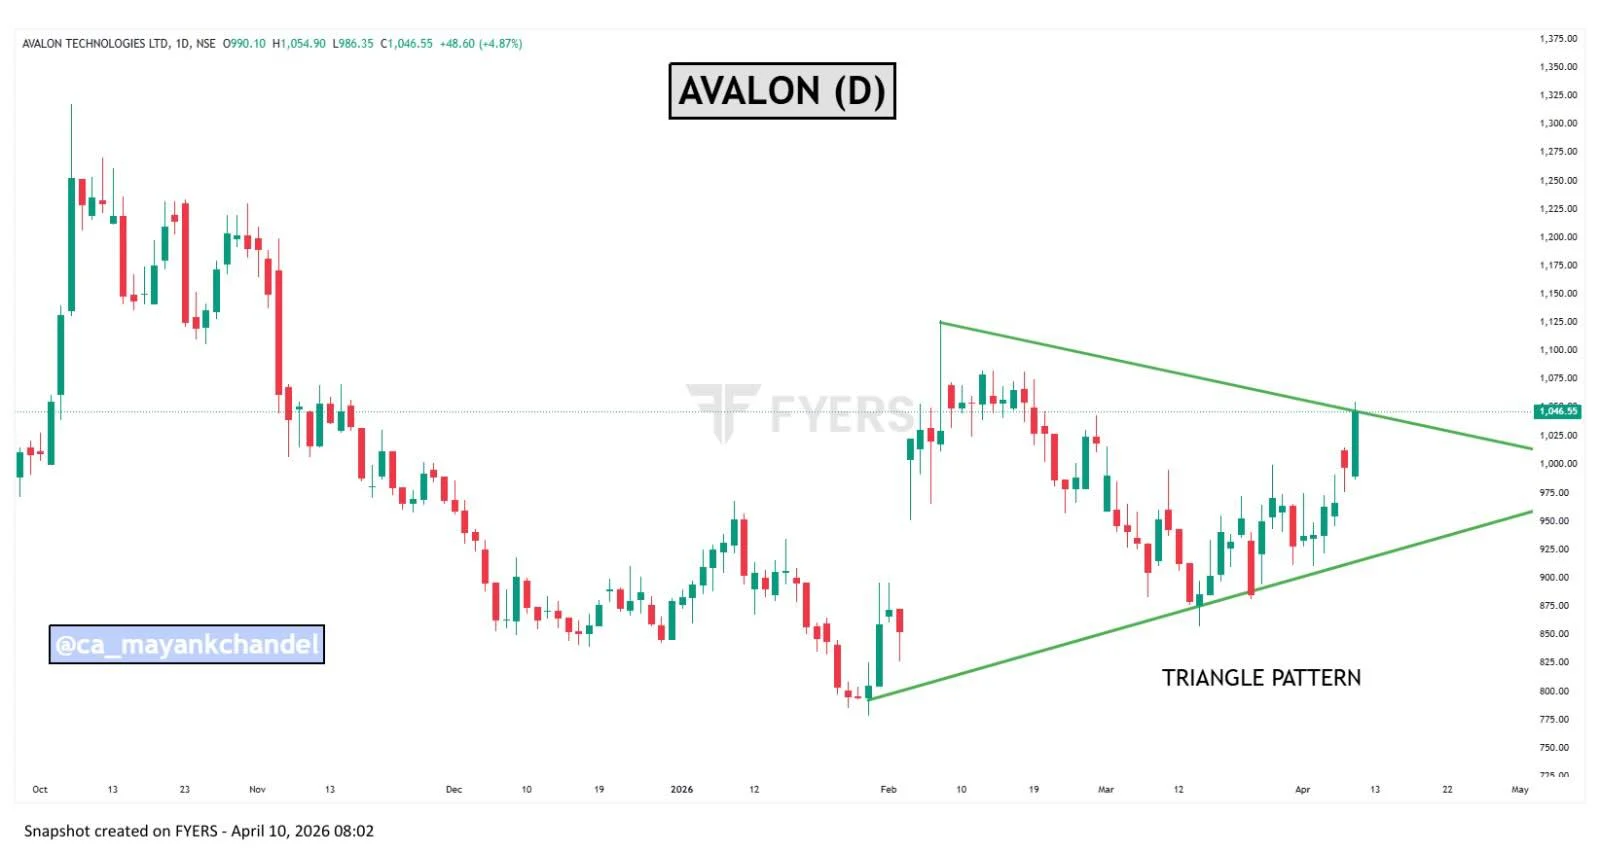
Avalon Forms Triangle, Poised for Breakout
📌 Stock Update – AVALON 📊✨ AVALON is forming a triangle pattern 🔺, indicating consolidation before a potential move 📈. Keep it in your watchlist for a possible breakout opportunity 👀🚀 #StockToWatch #StockMarket
Analyzing Rally Limits Ahead of Weekend Risk
I wanted to do a deep-dive before "weekend risk" and to highlight where I see this rally pushing back. 😉

All IBD Fundamentals & Tech in One Tool
Get ahead with @MarketSurge • Growth 250 list (top setups) • All IBD fundamentals + technicals are now in one view • Auto pattern recognition = precise buy/sell timing 📷 Try it 14 days for $14.95 (75%+ off) — no obligation 📷 Start now...
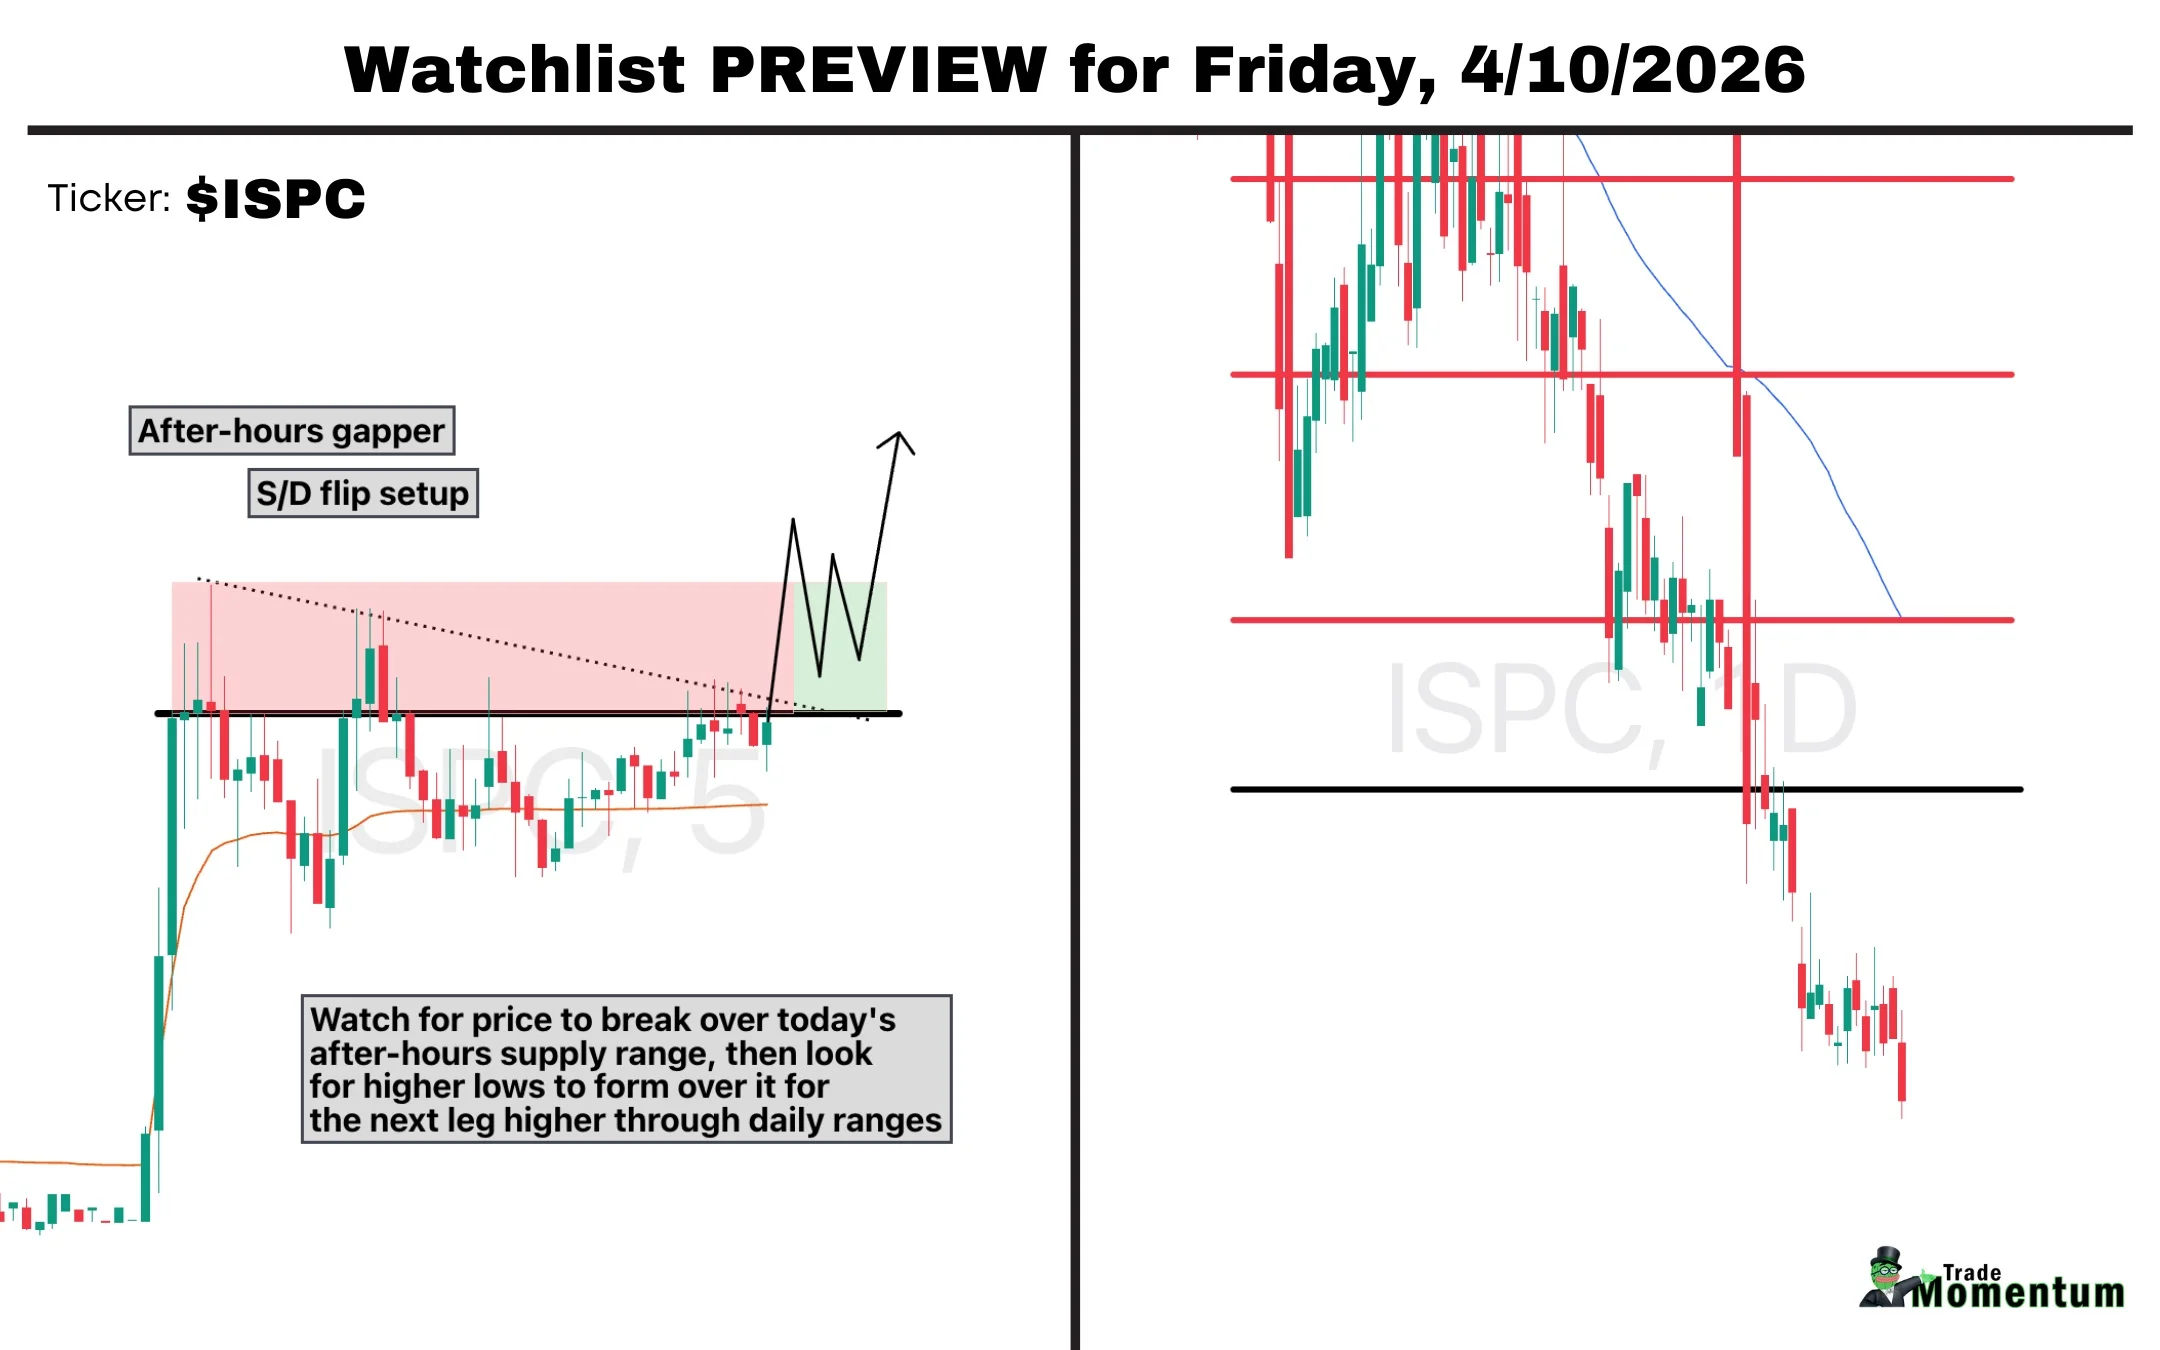
ISpecimen Cuts Transit Times 70‑85%, After‑Hours Volume Surges
$ISPC - "iSpecimen Reduces Domestic Shipment Transit Times By 70%-85%" Over 7x relative volume in after-hours here on ISPC, and I'll be watching it for continuation tomorrow IF it can break + base over its after-hours supply range for the simple...

Catch the Next Explosive Stock in 3 Steps
How to catch the next EXPLOSIVE stock to trade using 3 simple steps 🎯 #howtotrade #daytrading #stockstowatch #momentum #tradingeducation

Mild Pullback Triggers Bear‑Market Fear, Cash Surge
On a relatively normal 9% mild pullback we saw fear levels consistent with bear markets and 100-year pandemics. Amazing chart from @MacroCharts that shows the spike in money markets and cash like ETFs hit some truly extreme levels recently. https://t.co/dS2yJz8rLA
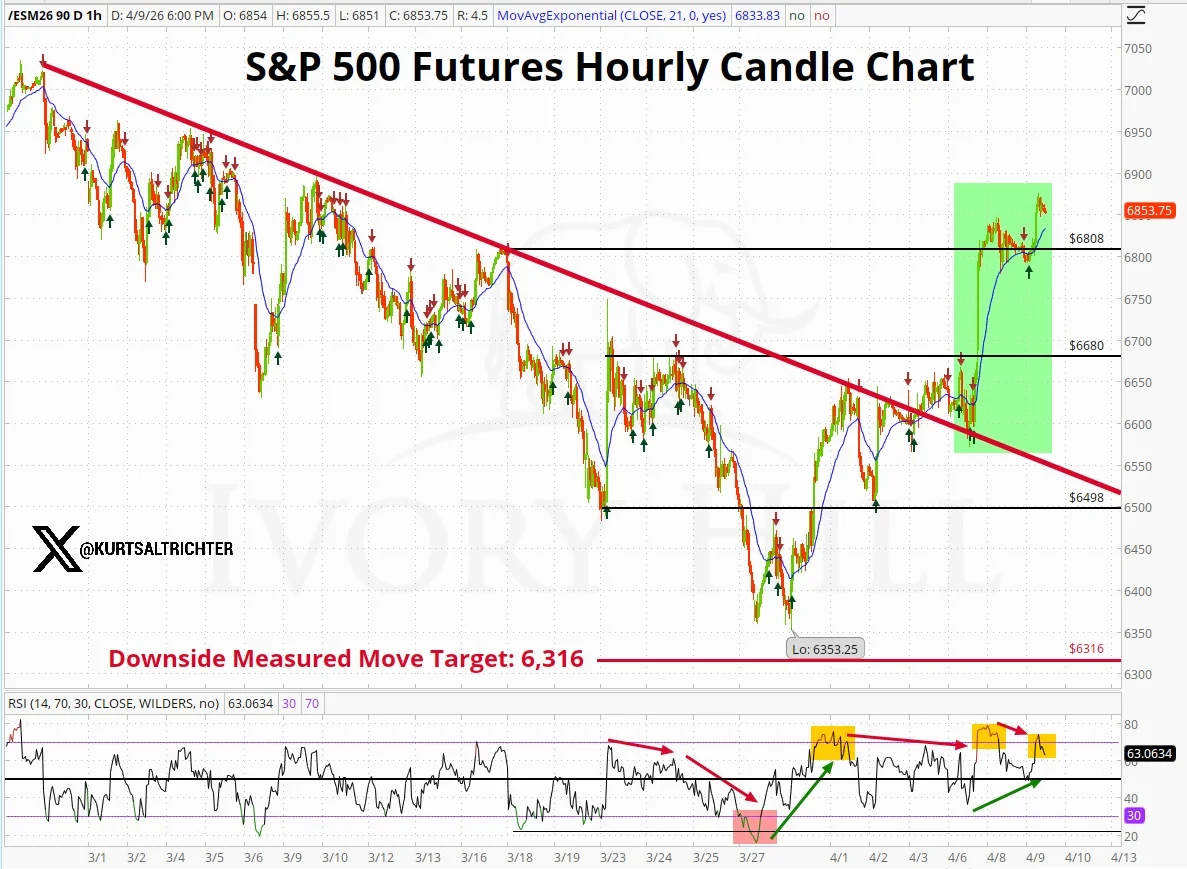
SPX Futures Reclaim Resistance, Breaks Downtrend Line
$SPX Futures tagged 6,854 today. That's a full reclaim of $6,680 and $6,808 resistance, a break above the Q1 downtrend line, and the 21 EMA back underneath price. Now let's see if this holds through CPI tomorrow and whatever drama happens on...

My Proven Nightly Scan Cuts 1,054 to 544
New video: how I build my daily watchlist. → 3 scans I run every night → How I cut 1,054 names down to 544 → Why % gainers miss the big-cap moves (Russell 1000 fix) → The filters that...

Markets Poised at Critical Levels Ahead of NY Open
Markets are sitting right at those make-or-break levels before the NY open. Everyone's watching to see which way we break. Tomorrow we'll be tracking these key zones live with the DOTS indicator to catch the moves as they develop. https://t.co/66dSROf2rQ...

SMH Rockets From Collapse to All‑Time High in Week
$SMH - From Failed Breakdown to All Time Highs in a week. Ricky Bobby Level Shake N Bake for Semis.... https://t.co/7WTLTI8n0f

Energy ETF Rebounds, Narrowing Gap with SPY
$XLE vs. $SPY - Good to see energy giving back some relative performance.... Wrote a little bit about this two weeks ago if you missed it. https://t.co/p4Mh0JYSAb

Fragile Ceasefire Sparks 6865 S&P Target
A Fragile ‘Ceasefire’ & 6865 $SPX Price Target This morning's premarket rant - before coffee. I should have said $6845. After we hit it + given $184M in Sept $6900/6910 calls were sold today, my VIX 19.29 bounce level is likely in...
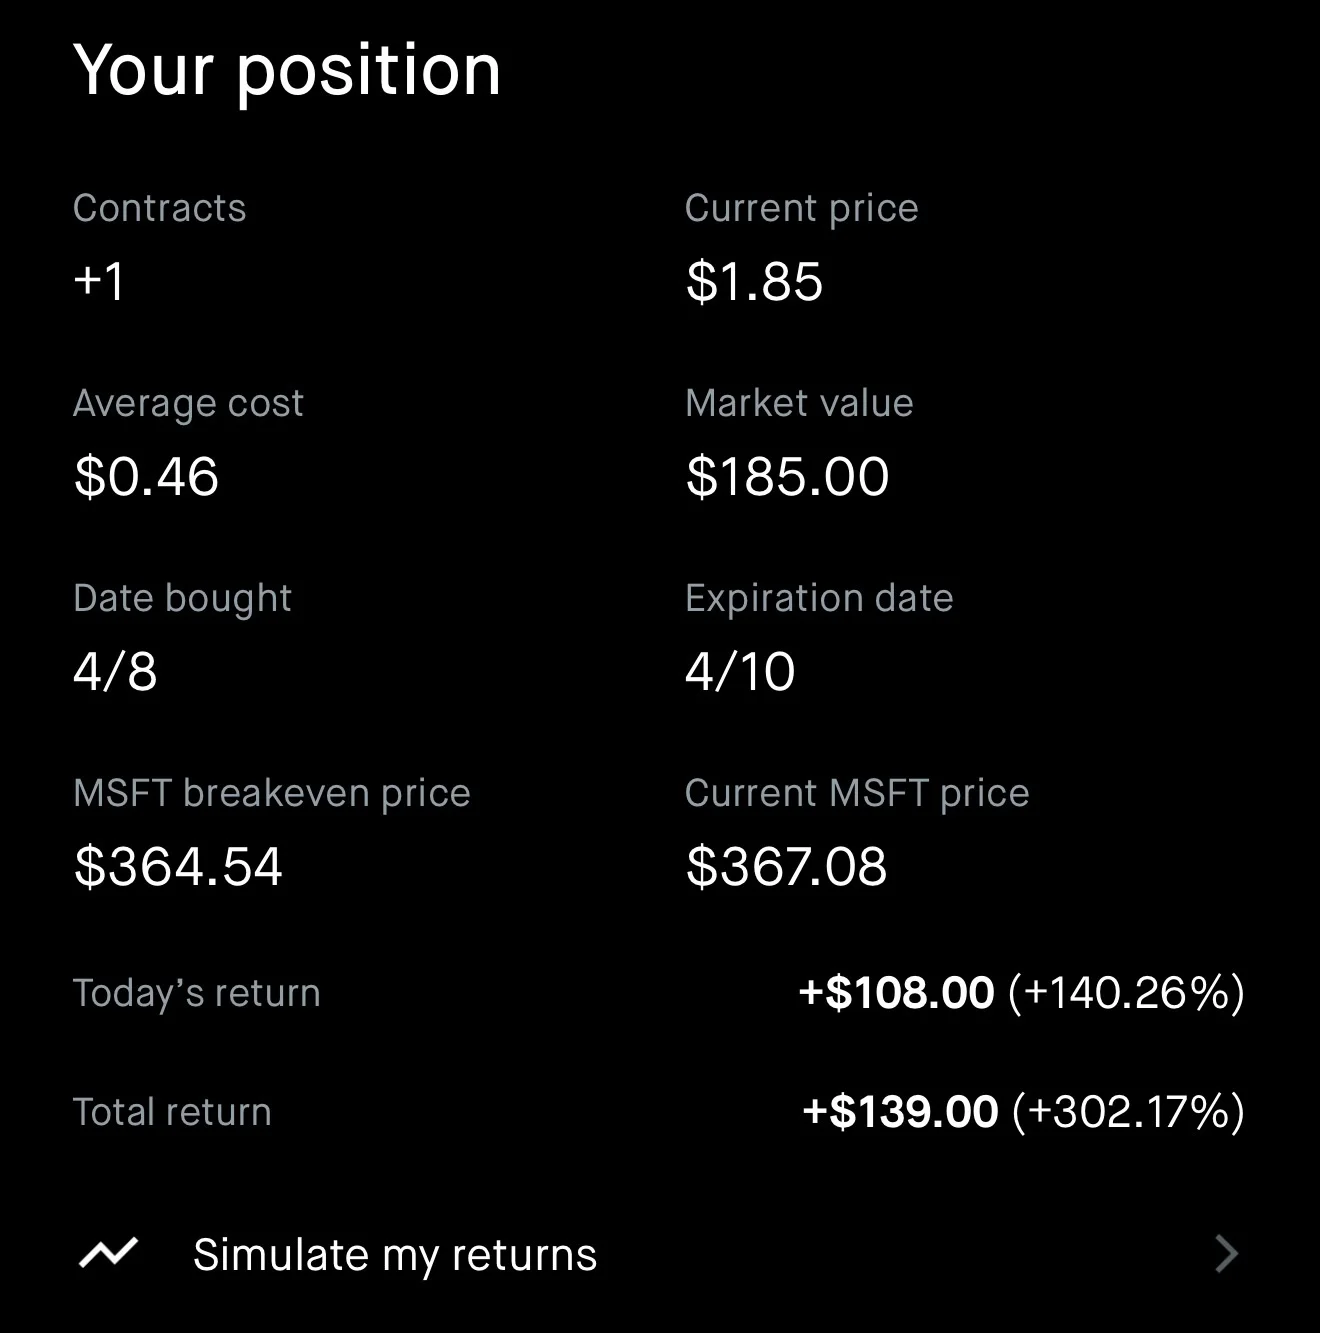
Ignore Indices; Find Opportunities in MAG7 Stocks
MSFT Swing went 300% this morning from yesterday. I was happy about that. One thing I’ve been challenging myself to do lately is not focus so much on the indices when price action is nasty. There will always be opportunity...

NYSE A/D Line Defies Doom, Bull Market Persists
I know all the market breadth experts said the end was near this time two weeks ago, but the NYSE A/D line simply pulled back to a longer-term trend line before accelerating higher. Will it make a new high? Yes, as...

S&P 500 A/D Line Holds, Hinting at Bullish Turn
Nine days ago we pointed out how the S&P 500 A/D line didn't make a new low, even though price did. This bullish call wasn't popular at the time, but this is consistent with potentially better times ahead. https://t.co/HIoWdB8H7c

7‑Day Wins Historically Signal Strong
The past 20 years that saw a 7-day win streak also saw the S&P 500 higher for that full year 95% of the time and up 18.8% on avg. The only year this didn't work was 2000 and the tech bubble....
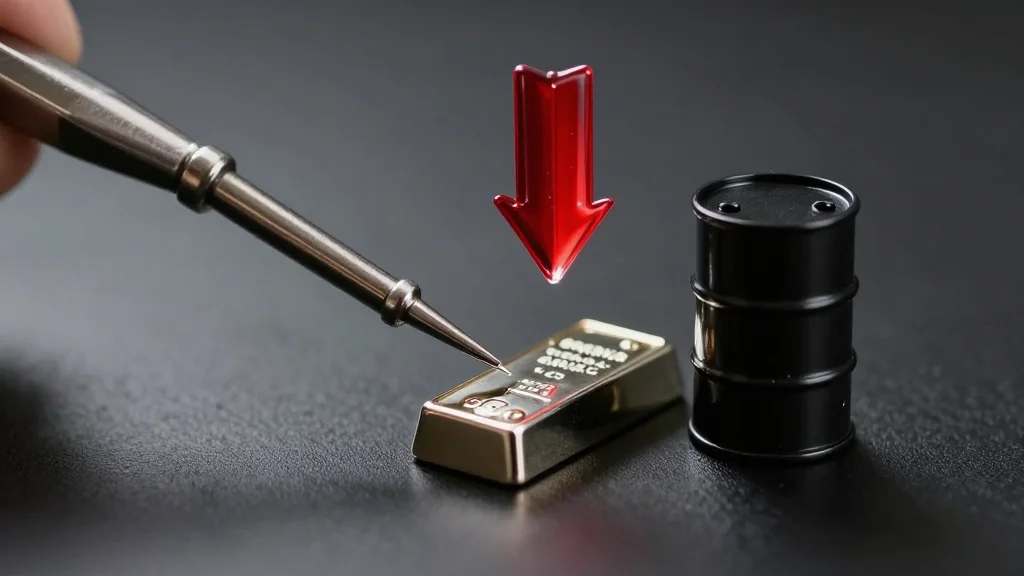
Leverage Aggression Leads to Sharp Market Reversals
This is One thing markets keep reminding us all; Don’t get aggressive with leverage. Silver fell ~30% in a single day. Crude Oil dropped ~20% in a day. Both happened after strong rallies, when sentiment was at its peak. Cont.

ARM Tight Near 10‑EMA After Catalyst, Watch Tomorrow
$ARM on the focus list for tomorrow. Tight on the 10ema post catalyst move https://t.co/MlqmQmpgdy

S&P Near Record Highs, Market Breadth Strengthens
S&P is 2.5% away from all time highs, this is not a bull trap. The path of least resistance is higher don’t fight it. Market breadth is improving & bad news is being priced in. Mag 7 also looking stronger

RMV Hits Zero at Critical Support Level
$YSS This RMV thing might just be useful... RMV=0 Yesterday near a key level while showing RS https://t.co/ynbiKA6tE9
Exiting MCD Amid Heavy Chop, Took Profits
$MCD too much chop in the name right now No green to red stop. Made some coin. All out for now

CAR Set for Wild 0DTE Trap Tomorrow
$CAR not letting up 0DTE tomorrow all they did was trap trap trap this week - going to be the craziest 0DTE day we've seen in quite some time lol

Positive Breadth Amid Flat Volume Leaves Market Uncertain
Breadth is solidly positive (by a 9-5 margin) but upside volume and downside volume are dead even. "There's something happening here What it is ain't exactly clear" https://t.co/vYUbSQsVwb

Telus Slides 9% to 13‑year Low Levels
Telus $T $TU Canadian telecom still on the move and hitting levels first reached 13-years ago as the stock is -9.2%... getting to see the chart, almost feels like cheating to sidestep such mess, no? https://t.co/S4U5OCaTOh
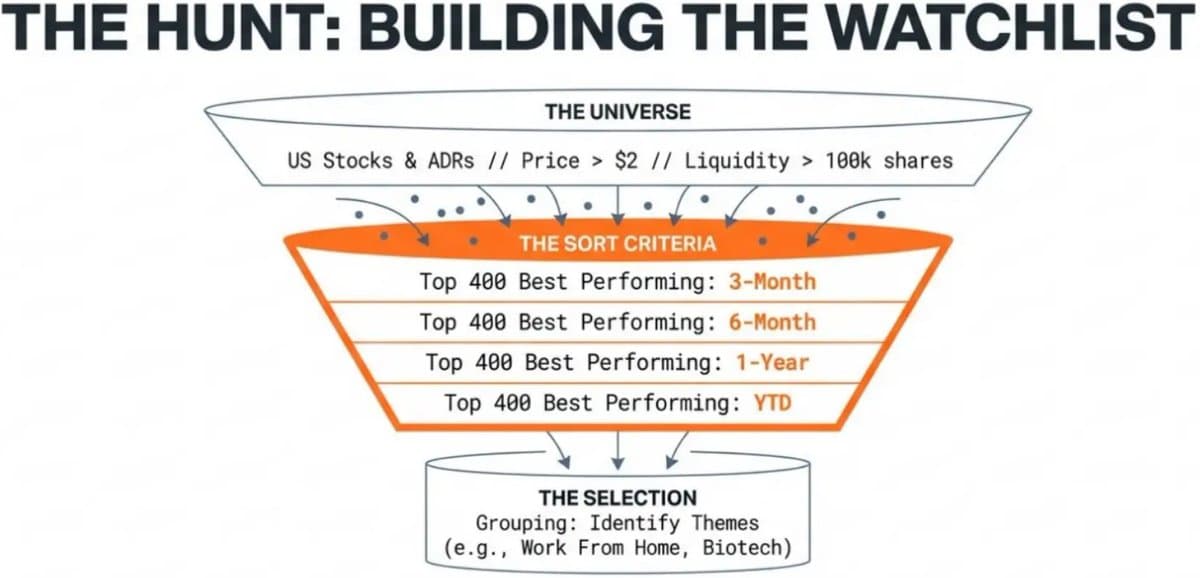
Run Two Screens to Catch Dollar‑Mover Stocks
Building a momentum watchlist? You gotta run it twice. Most people don't, and that's why they miss the big ones. Screen 1: Full US universe. Top performers 3mo, 6mo, 1yr, YTD. That's where your % rockets live. Screen 2: Same exact screen...

Chart Signals Disney Buy Despite Personal Skepticism
$DIS sometimes I have to cover the name and buy because the chart says it is time. I am not a big fan of the company. I did like the chart. I don't own in my...
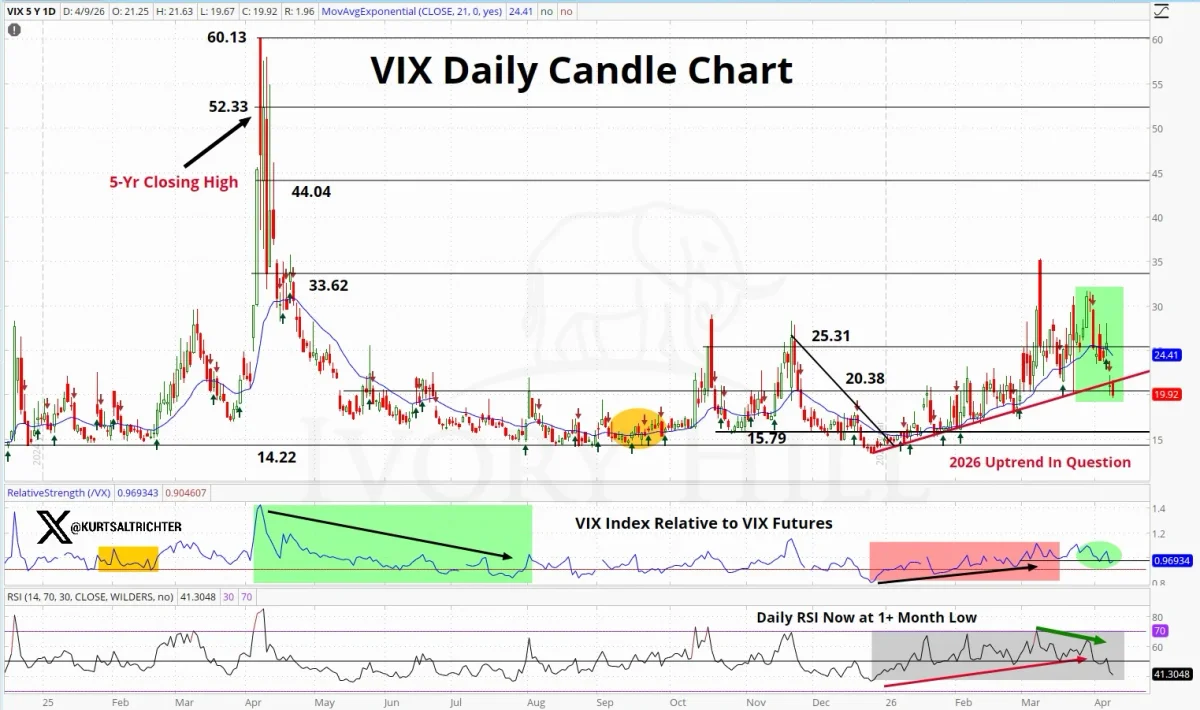
VIX Breaks 2026 Trend, Signals End of Market Chop
The $VIX just broke below its 2026 uptrend line. Combined with positive gamma, this market may be exiting the chop. Time will tell.

Asset Correlation Breaks: Bullish on One, Bearish on Other
There's a MAJOR divergence in two assets that have been EXTREMELY correlated happening today that we will talk about on @ForwardGuidance and it makes me very bullish on one thing and very bearish on the other.....@qthomp @fejau_inc

Shorts on CIBR and SKYY Explode, Software Short Wins
Another great day on the Short Side of Software with our $CIBR and $SKYY Shorts imploding (see ETF Pro for ALL my Macro Shorts)
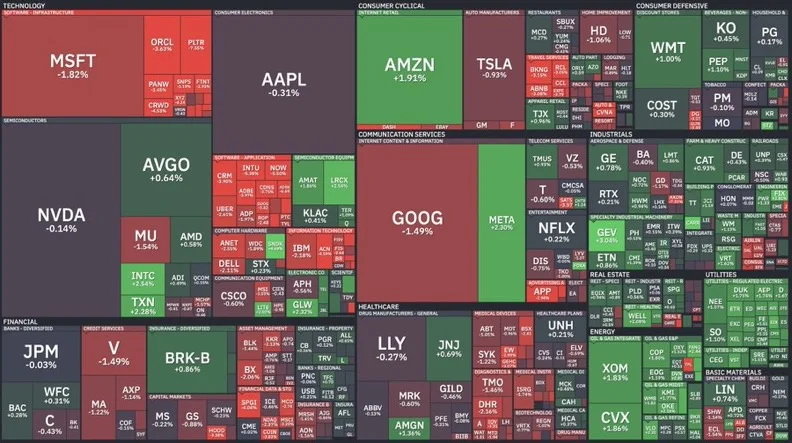
S&P 500 Stocks Show Mixed Performance in Early Trade
This is how every stock in the S&P 500 has performed so far in today's early trading
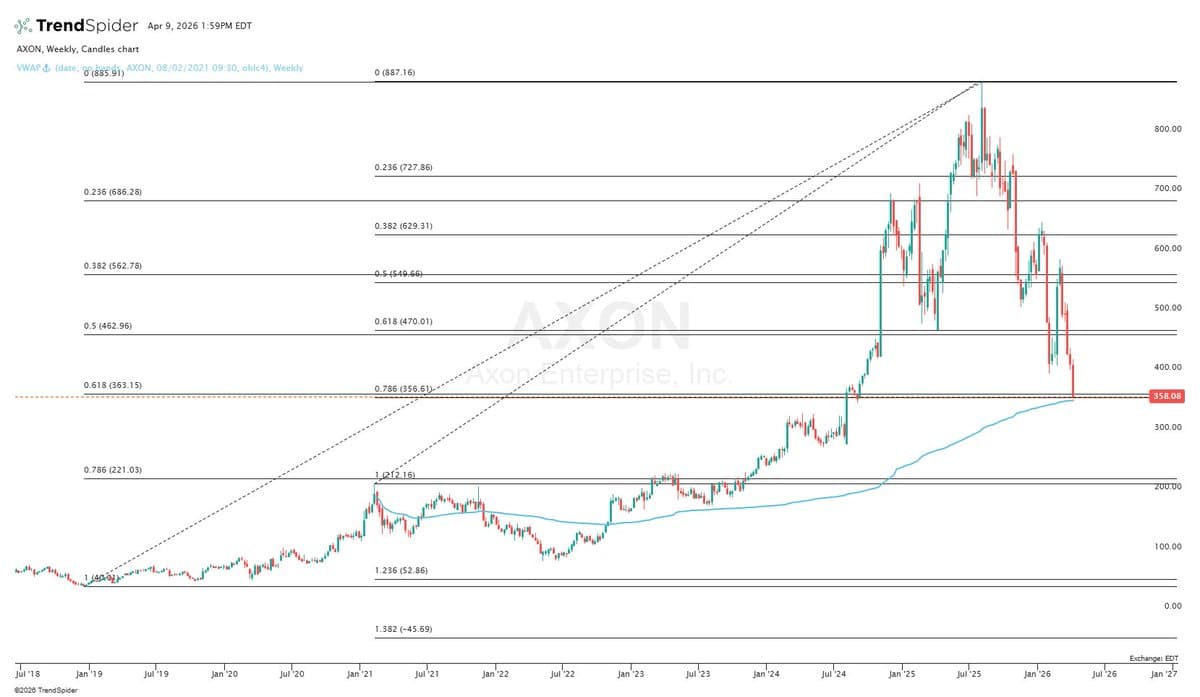
AXON Appears Attractive at 350‑355 With 30% EPS Growth Potential
In my opinion, $AXON is starting to look attractive for the first time in a long time... down -60% from the highs... still a little too expensive however there's a decent chance this company will compound EPS at a 30%...

AMD Needs Slight Push to Close Key ER Gap
$AMD simple daily chart needs a small push over todays high to close the ER gap 237.04 and confirms the gap close 242.11 https://t.co/3pylFESqOQ

Software Surge Tests IGV’s 2‑Year Support Level
Software coming in hot, testing a 2+ year support cliff on the sector $IGV ETF. Grab your popcorn. https://t.co/41BheMymid

LITE Showcases Flawless Failed Follow‑through Setup
$LITE absolutely perfect failed follow through set up with one re-test of key line. Doesn't get much cleaner than that. Glad I watched the entire thing 🙏 https://t.co/x11rVqEqle

Nike at $43: Buy Signal After Fire‑Sale
Full Deep Dive Thesis - Is #NKE a BUY now at $43? I have been receiving DMs. Nike’s stock has been hammered. The brand everyone thought was untouchable… now trading at fire-sale levels. Even Tim Cook just loaded up. So the question everyone’s asking:...

Cameco Poised to Break $120 Resistance Amid Quiet Uranium Sector
$CCJ Daily. Uranium miners been quiet but Cameco shaping up nicely. Trying to break higher from falling channel pattern. Watch back over $120 long to confirm https://t.co/lnHsjzIHhu
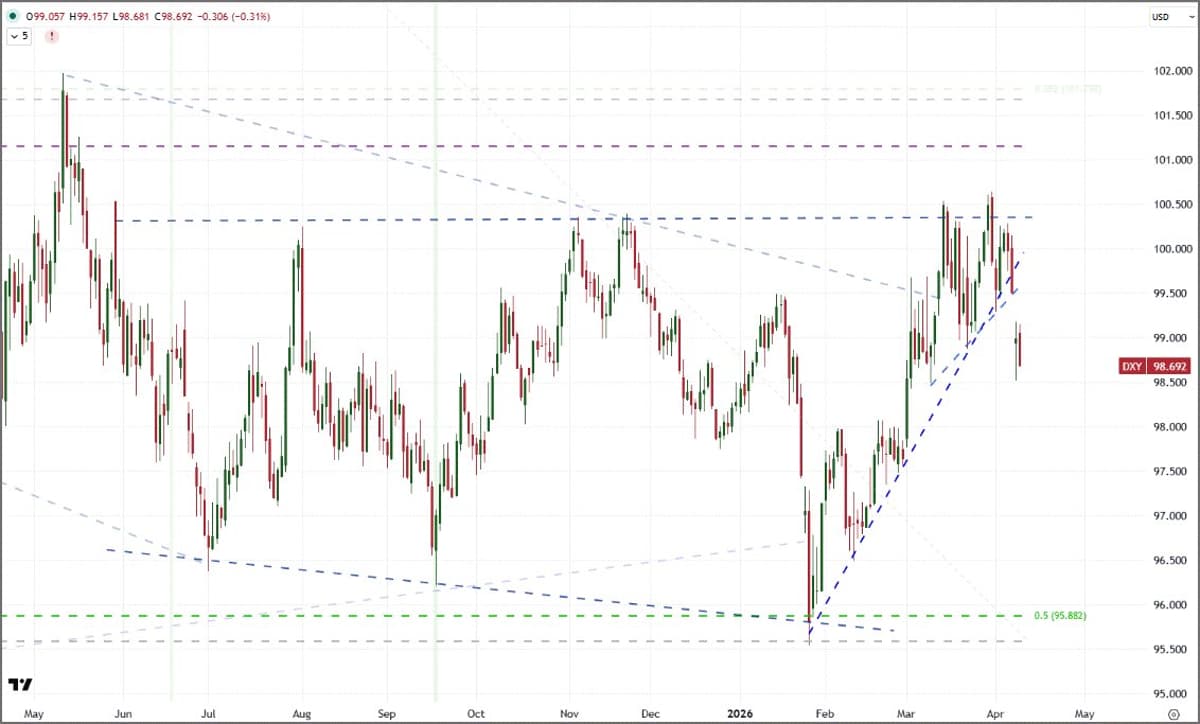
Wedge Break Signals Clear Tech Market Direction
This is the kind wedge pattern break that offers clear resolution for tech observers... $DXY Dollar Index: https://t.co/MwWVvohhYo
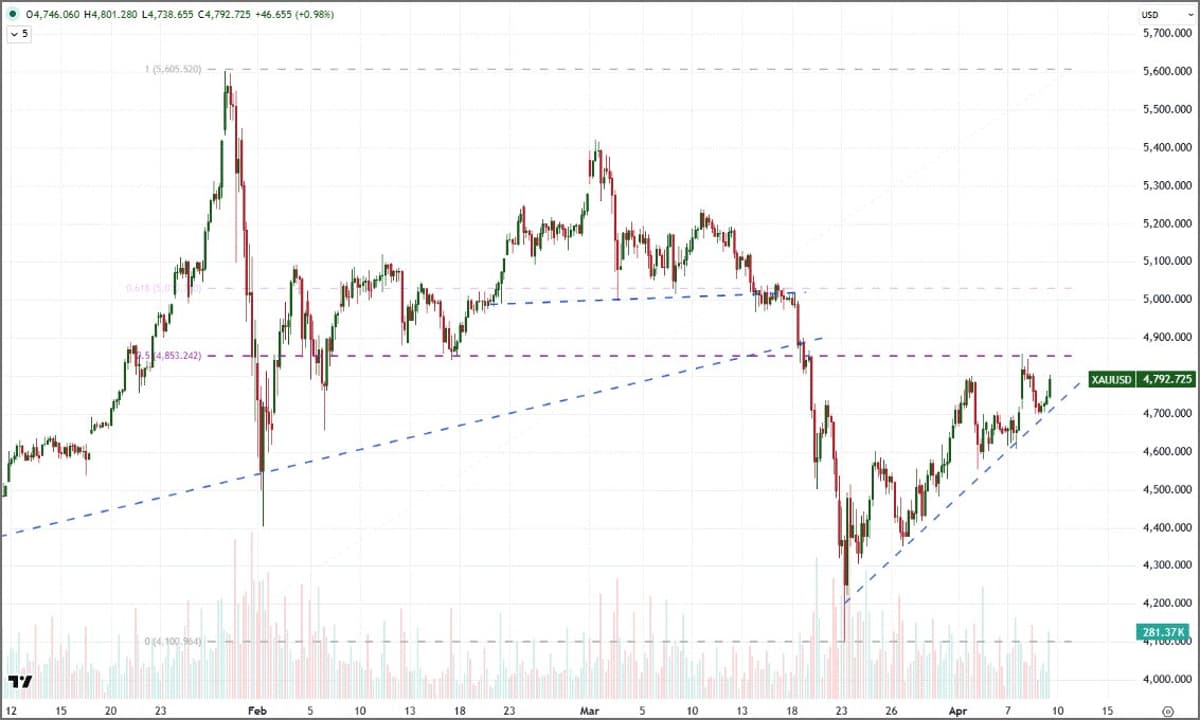
Gold's Clean Rising Triangle Signals Potential Breakout
This rising triangle that has developed on the Gold chart over the past two weeks is remarkably clean... Plenty of scheduled and unscheduled event risk to kick this into a breakout in either direction https://t.co/BgNWHjDL4n

Dana Soars to ATH, Trim with Trailing Stop
Macro: Dana hits ATH $36.28; 1yr +202%, mkt cap ~$4B. Key: Q4 rev $1.9B beat; Dana2030 $10B target; UBS Buy/TP $40. Risk: beta 2.04, trading above fair value—high volatility. Trade insight: trim into strength; use trailing stop. — Viktor Kopylov,...

Bitcoin Must Break $75,970 to Avoid Q2 Low
$BTC - Still underperforming stocks. The stock indices have broken over their March 17 high, Bitcoin is still below it. In order to confirm an intermediate term low it has to close above the 100 day MA that is currently...
Missed Google Pivot, Cut Losses at New Low
I did screw up the RDR in $Googl around $315 pivot. That additional new low this morning got me out. I didn’t re-visit Can’t kiss all the babies.

Using RDR
VTF saw me play $TSLA for the first time in while. Just a RDR style tactic for cash flow. Booked some gains. Trailing last Third for more perhaps

Netflix Nears $100 Hold After Recent Highs
$NFLX recent highs 102.69 a move and hold over is the next level I am watching for stop changes. $100 finally hold today? https://t.co/aGHh7dOTKV

SPY and QQQ Hold Gap Pivot, Spark Rally
Soooo. $spy and $qqq both held yesterday’s gap pivot and rallied. How did u do? #630club

Visible Market Zones Act as Key Decision Points
It's all about how a market acts in these most visible areas: resistance, partial fill, or full retrace. These visible areas are a form of "decision points". https://t.co/lg9H4G02y9

Marvell Exemplifies One-Time Framing in Extended Stock Runs
I have quite a list of stocks currently on extended runs up. Marvell is also an example of "one time-framing." https://t.co/uOS5Tjya5k
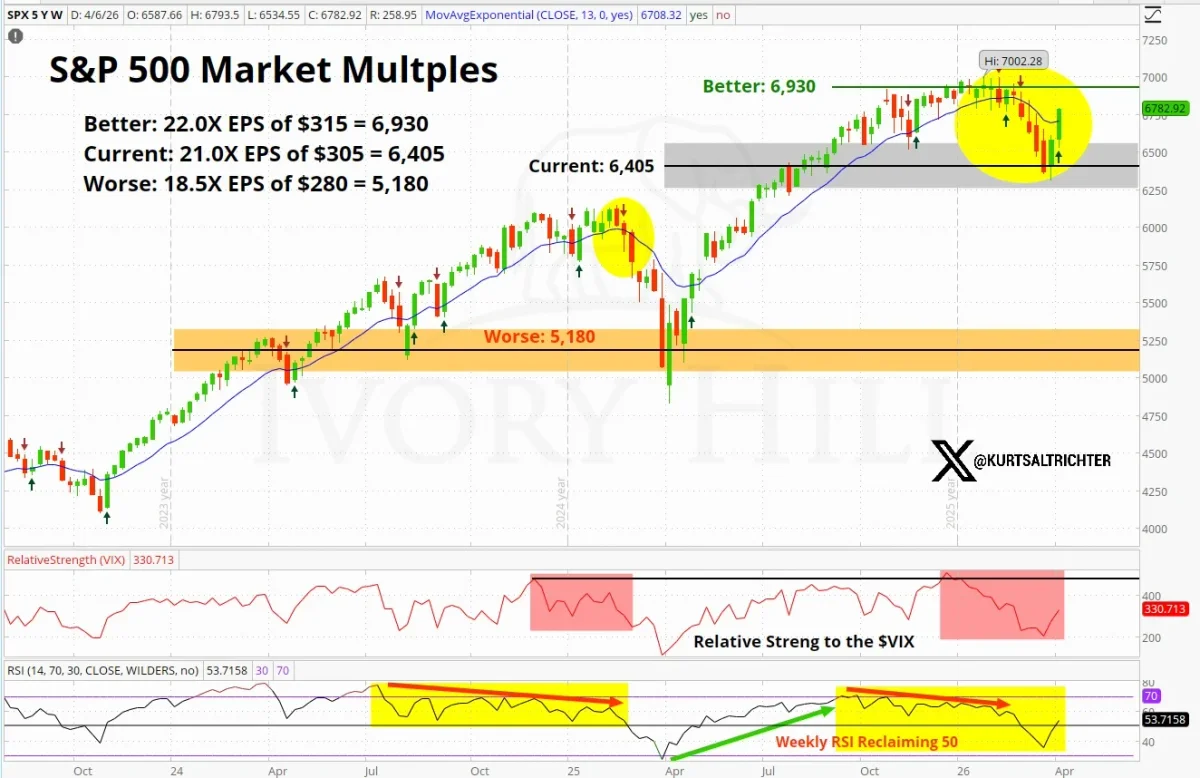
Selloff Was Repricing, Upside Capped, Downside Risks Remain
If you use fundamentals to supplement your technical work as I do, here's what this selloff actually was. We didn't crash. We repriced to fair value. The low landed almost perfectly on the current multiple levels. 21x $305 = 6,405. From here, the...

SPs Rally Eight Days Post Wide-Range Reversal Buy
SPs - now on day 8 of extended run up after Wide Range Reversal Buy at bottom of the swing..... https://t.co/s8IEMHPoQr

Luck Beats
Sometimes better to be lucky than good. Trailing the all morning short pop on $BOIL, get up to get lunch. come back and throw a new trail for the dub. #TradingLife https://t.co/wtD7BJL7HR
CTAs Set to Flip $34B Into S&P This Week
"CTAs are currently short $30b S&P 500. Our model suggests that at current market levels CTAs will buy $34b of S&P 500 over the next week (closing out shorts and flipping long)." After yesterday’s move higher in the S&P...