
Dow Faces Bearish Cross Near Key Support Levels
#DOW small Down Candle. Support 48192, 47506, 46978. Resistance 49848, ATH 50512. Near MACD Bear Cross. RSI 58.5 not high. 13/21 day EMAs Bullish. Top Bollinger Band 49720. Midpoint Line 49160. Bottom Band 48662.
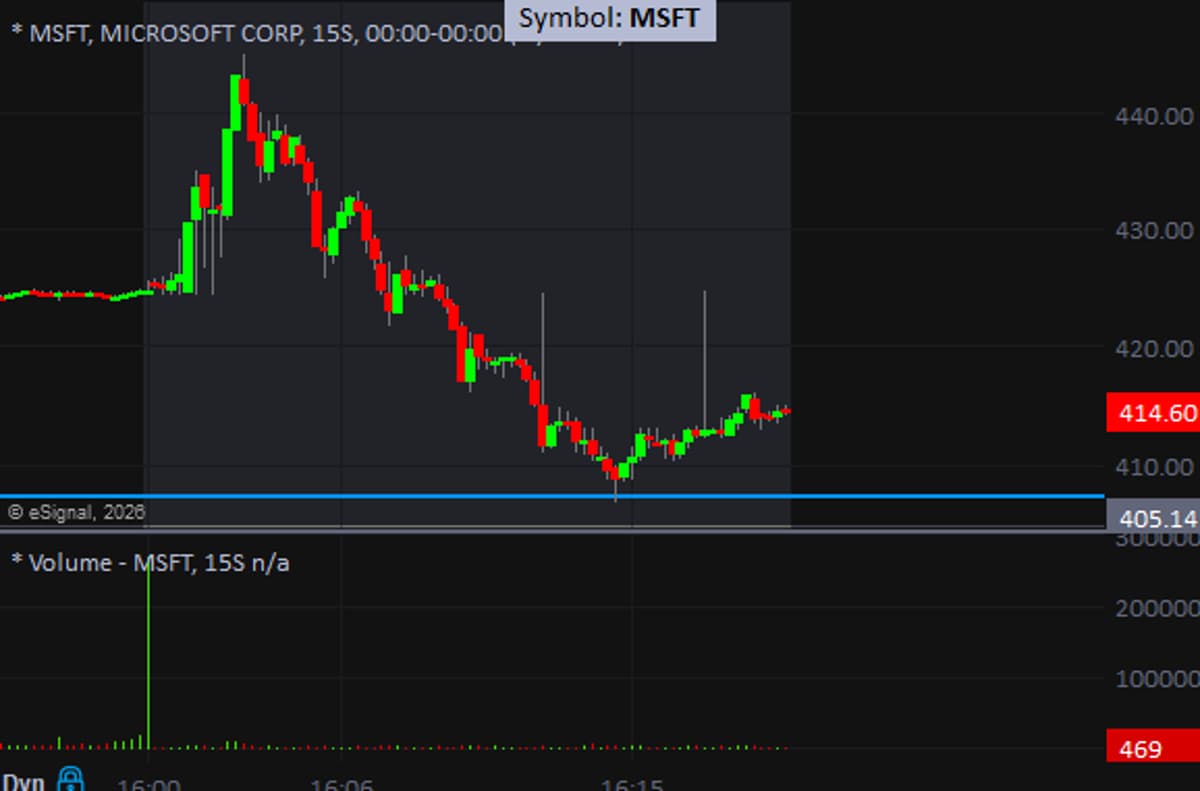
Microsoft Stock Bounces, Awaiting Volatile Earnings Call
407 low. back to 415. and we haven't even had the CC yet which tends to be nutty... $MSFT https://t.co/fubZuBHMV2
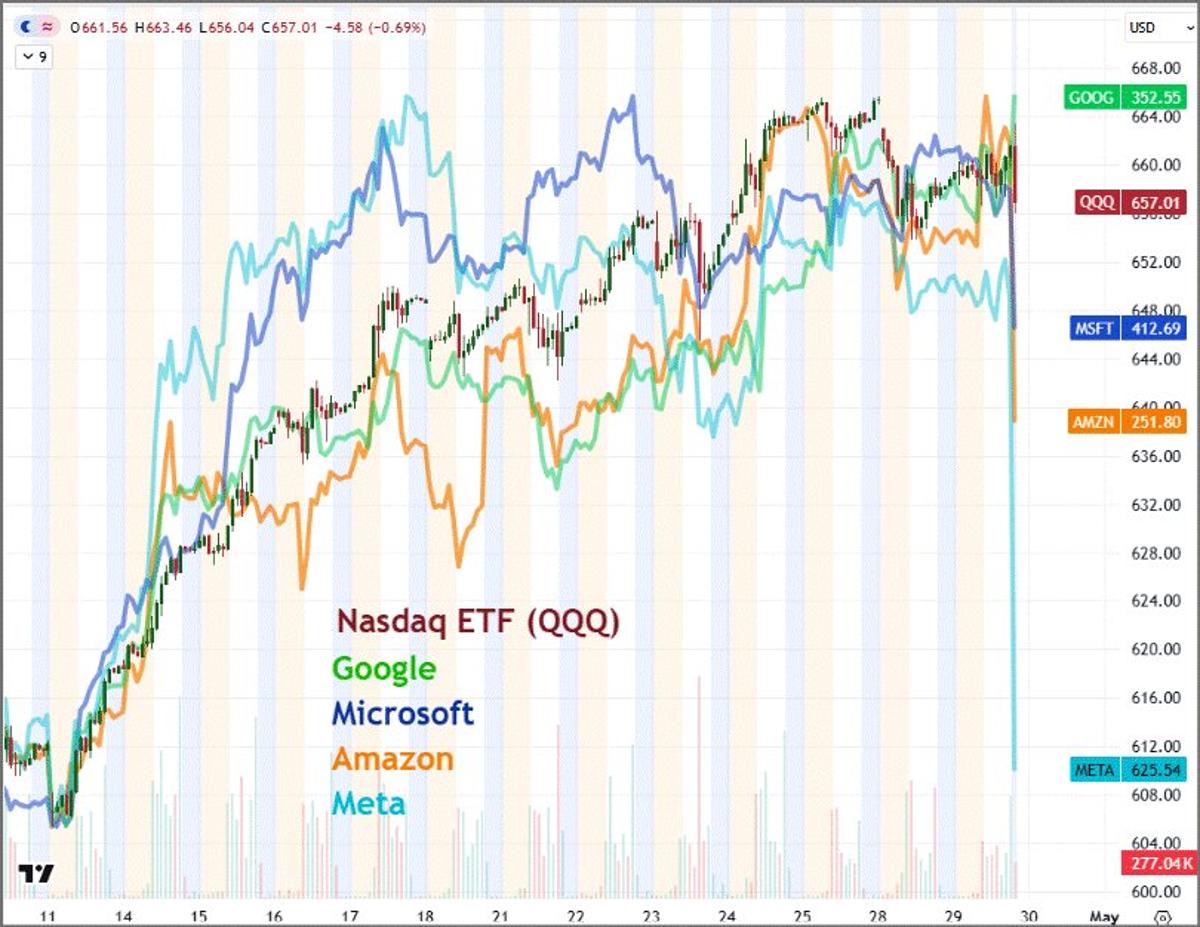
Tech Titans Drive QQQ’s Hourly Momentum
Here's the hourly chart (with afterhours) of the $QQQ along with Google, Microsoft, Amazon and Meta: https://t.co/f4NQoDqTRx
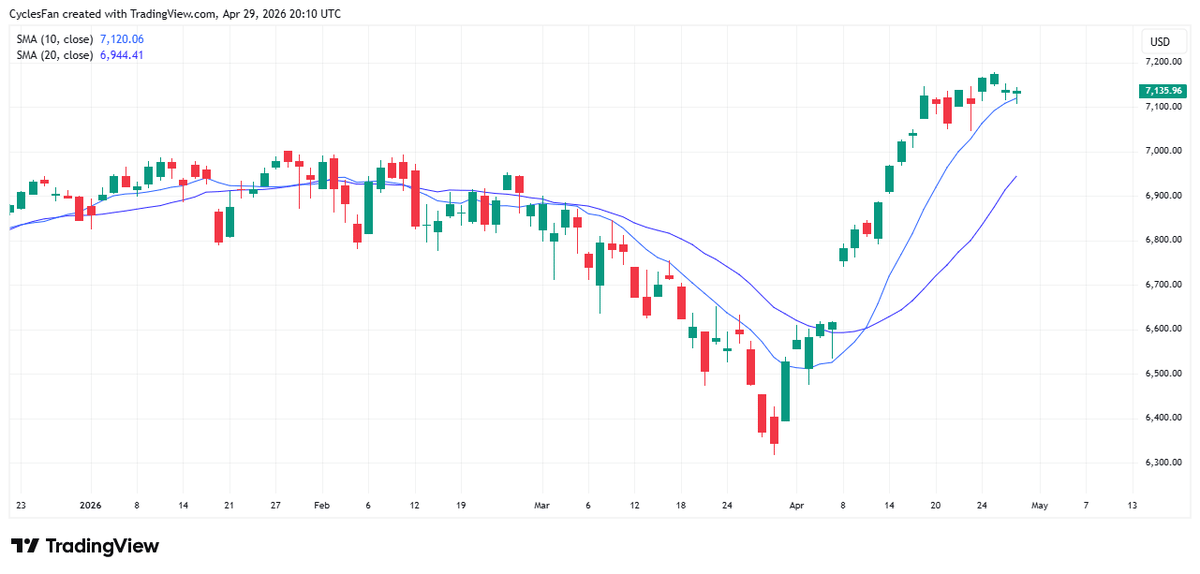
SPX Near 10‑Day MA; Below Could Trigger Pullback
$SPX hit the 10 day MA today and hasn't confirmed a short term top yet, but that's likely to change tomorrow after the mixed reaction to MAG 7 earnings. A close below the 10 DMA would lead to a pullback...
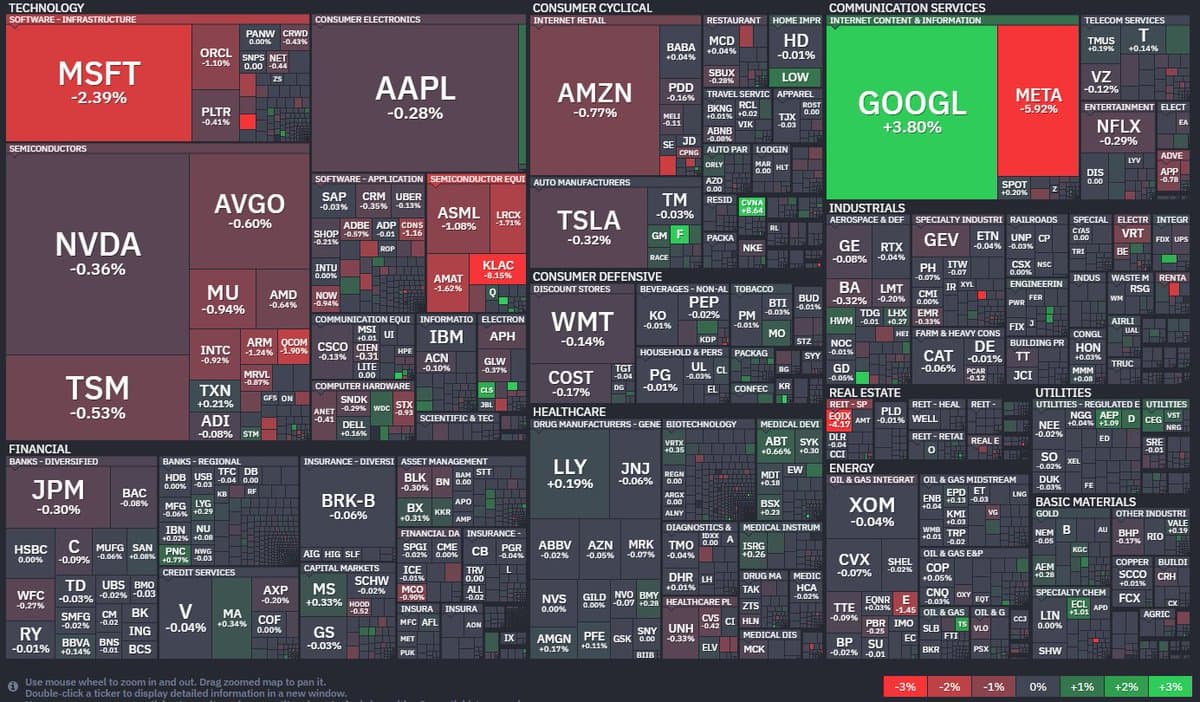
Tech Stocks Split: Google up, Microsoft and Meta Slide
$MSFT turns red, but not as bad as $META $GOOGL +4% Seeing some red in chips @finviz_com https://t.co/AcL7e93ASS

Speculating XRP's Support: How Low Can It Drop?
Attention all Ripplettes How deep into support do you Ripplettes think price could go? $XRP
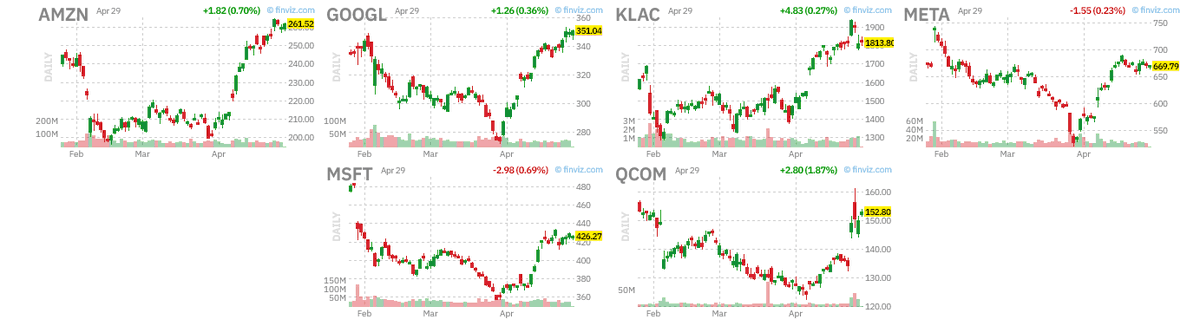
Skip Earnings Hype, Trade on Volume and Tightening
Big Earnings coming after the close. Some will chase this. I won’t. I’m watching for: → Volume expansion → Tightening → Clean trigger That’s the entire playbook. Let the noise pass. The setups come after. $AMZN $GOOGL $KLAC $META $MSFT $QCOM https://t.co/VDMViEJgqO
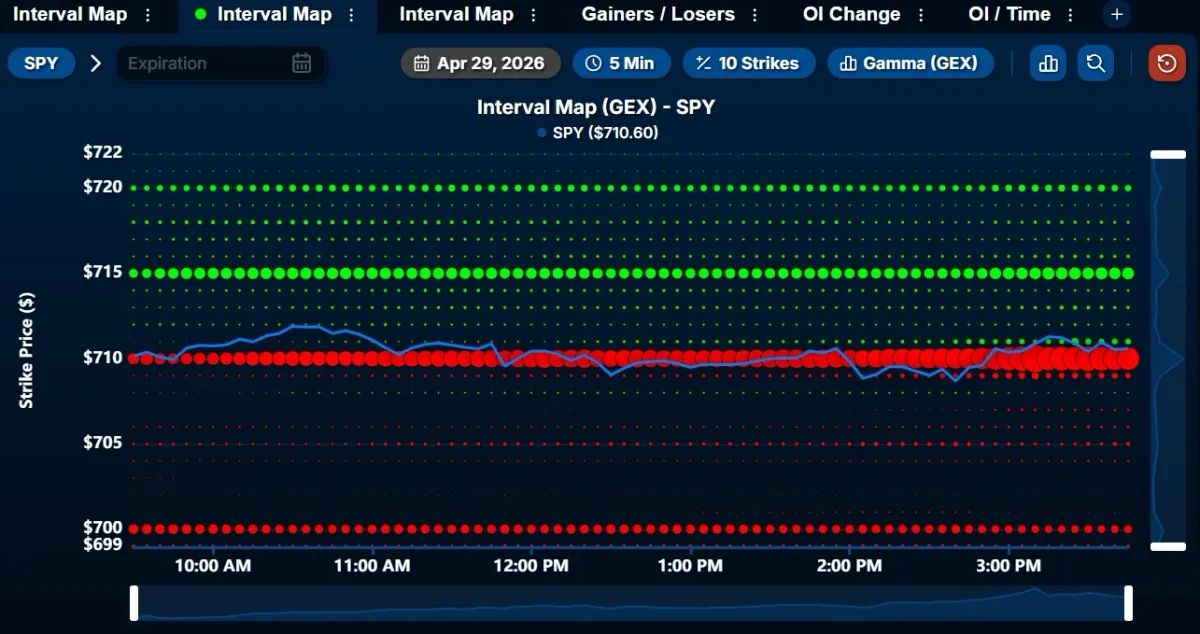
SPY's $710 MVC Draws Magnetic Gamma Pull
$SPY spent practically the whole day at $710, which we identified this morning as the MVC. These elevated gamma levels can act like magnets.
ONDS Rebounds
$ONDS all out made good coin on the remaining shares and the whole trade. Daily back into the base and price lost many ma's today. Name goes back on go-to list.
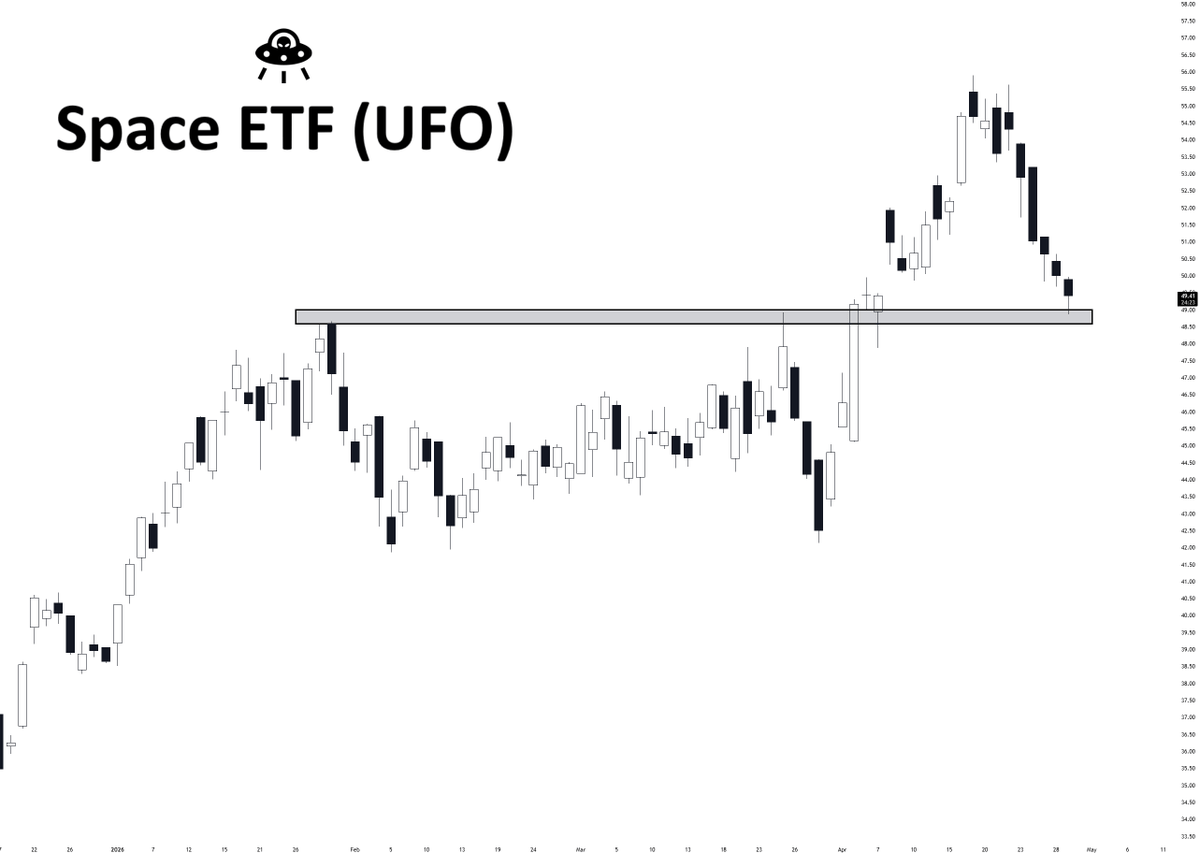
Space ETF Hits Jan/Mar 2026 Highs, Closes April Gap
Space ETF landing right at the January and March 2026 highs, filling the April gap. $UFO https://t.co/NPJA1jc4pE
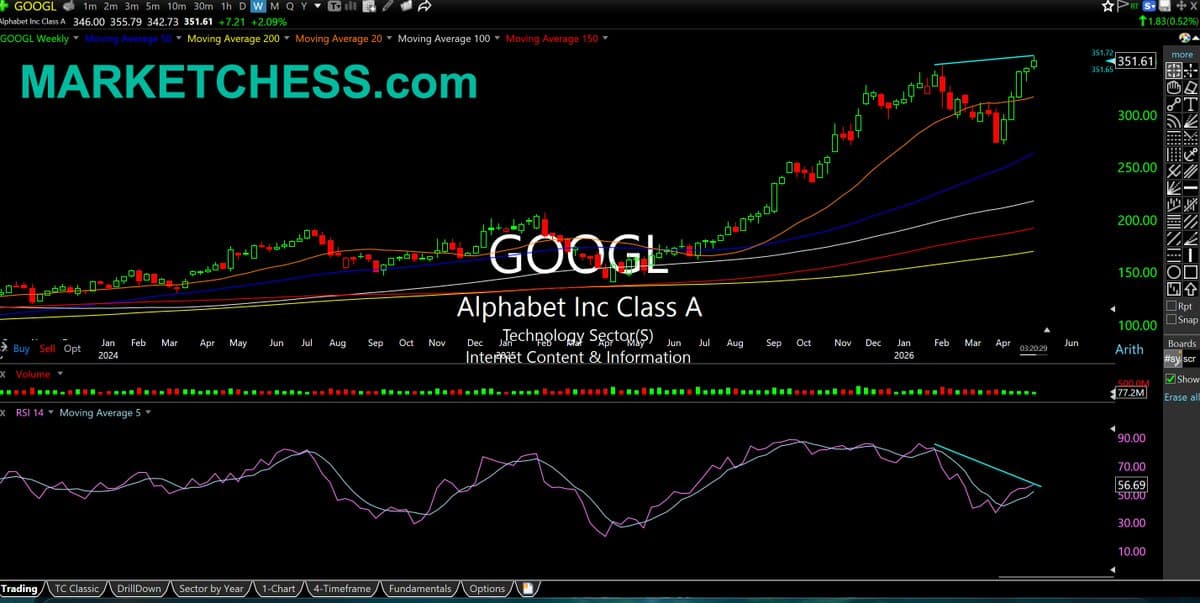
Alphabet's New Highs Need Blowout Earnings Amid RSI Divergence
$GOOGL Weekly. Big earnings lineup tonight. Alphabet the biggest market cap of all names. New highs today vs. Feb. highs come with negative RSI divergence (bottom pane). They'll need blowout report https://t.co/XR8D9rIaM1

Crowded Markets Mute Breakouts; Preserve Capital for True Moves
When breakouts fail to gain traction, it’s often a signal that the market is crowded and retail activity is elevated. This helps explain why the vast majority of significant stock advances begin out of corrections and bear markets—periods that effectively...
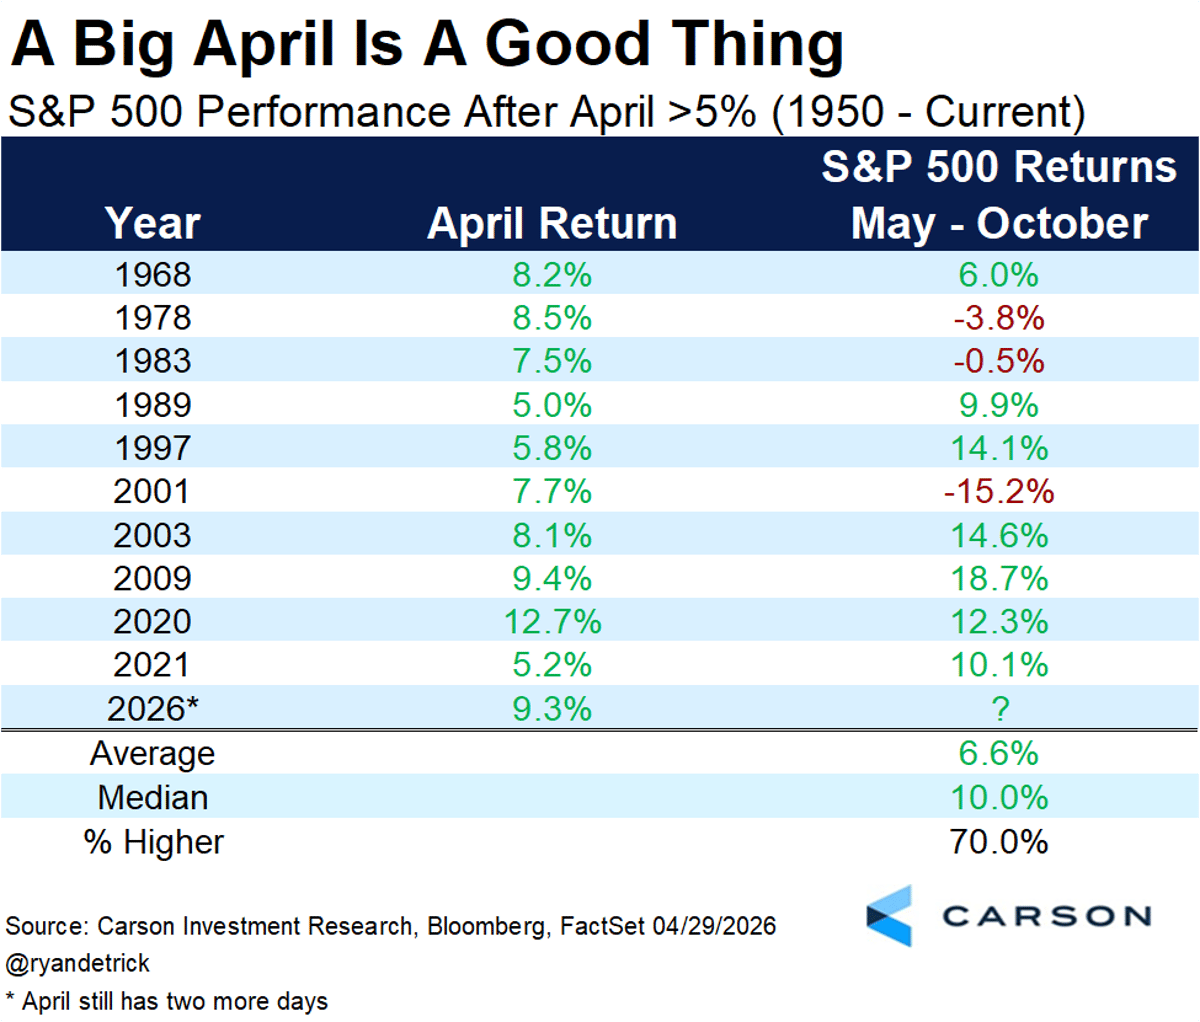
April Gains >5% Boost Six‑Month S&P Returns
These next six months average only 2.1% for the S&P 500, which is the lowest out of all 6-month combos. But when April is up >5%, it jumps to an average of 6.6% and a median of 10%. https://t.co/KsET0NcwKJ
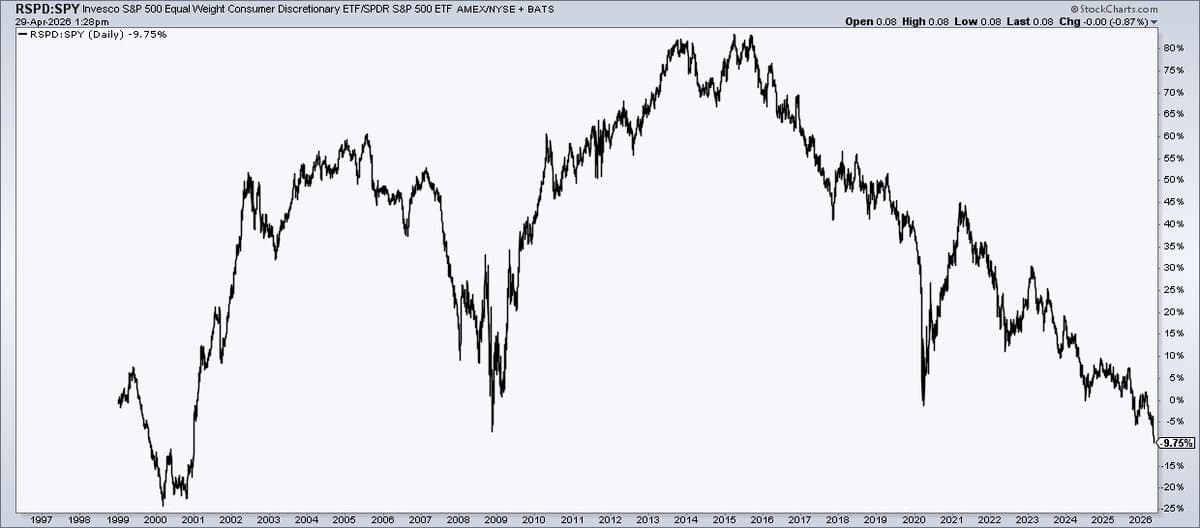
RSPD:SPY Ratio Hits Lowest Level Since 2000
The RSPD:SPY ratio just sank to its worst level since the year 2000 Equal-weight discretionary fresh relative lows to the S&P 500 $RSPD $SPY More from me on @stockcharts: https://t.co/Y9zWo1TSRi https://t.co/7GXaiqCS3w
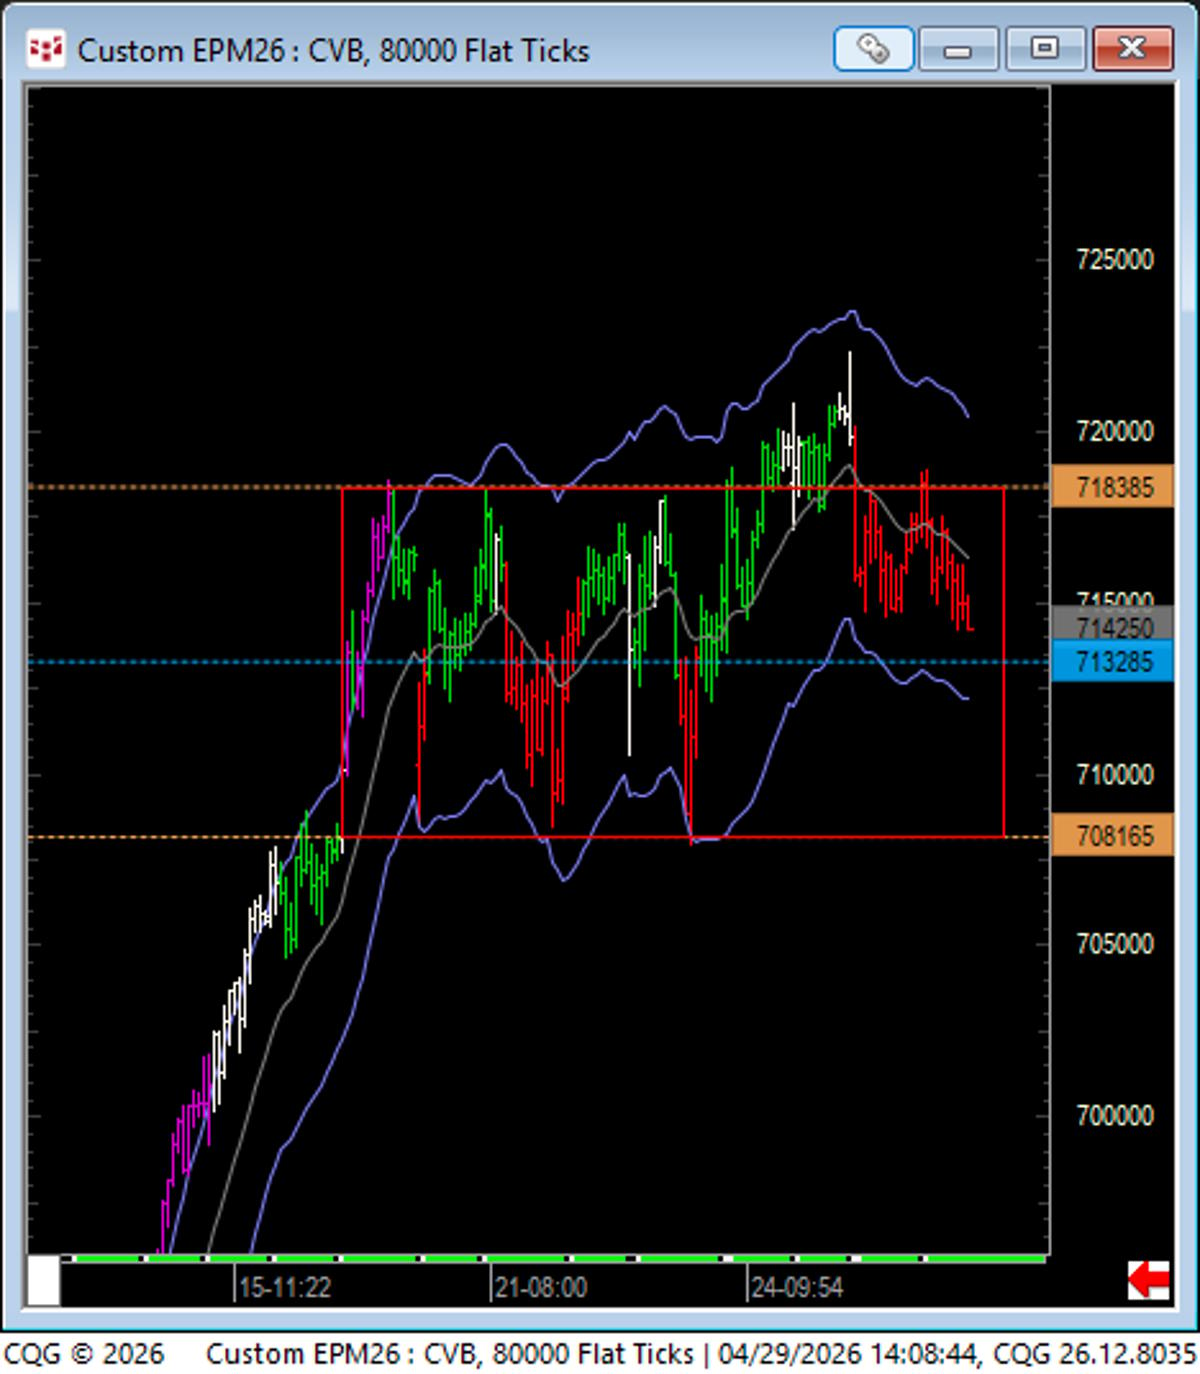
False Upside Breakout Signals Likely Downside Move
Sklarew type Box shows false BO to upside. Middle line next....and if it fails to hold the middle off the box, odds are it will come out the downside. https://t.co/Mo4gRQdNgX

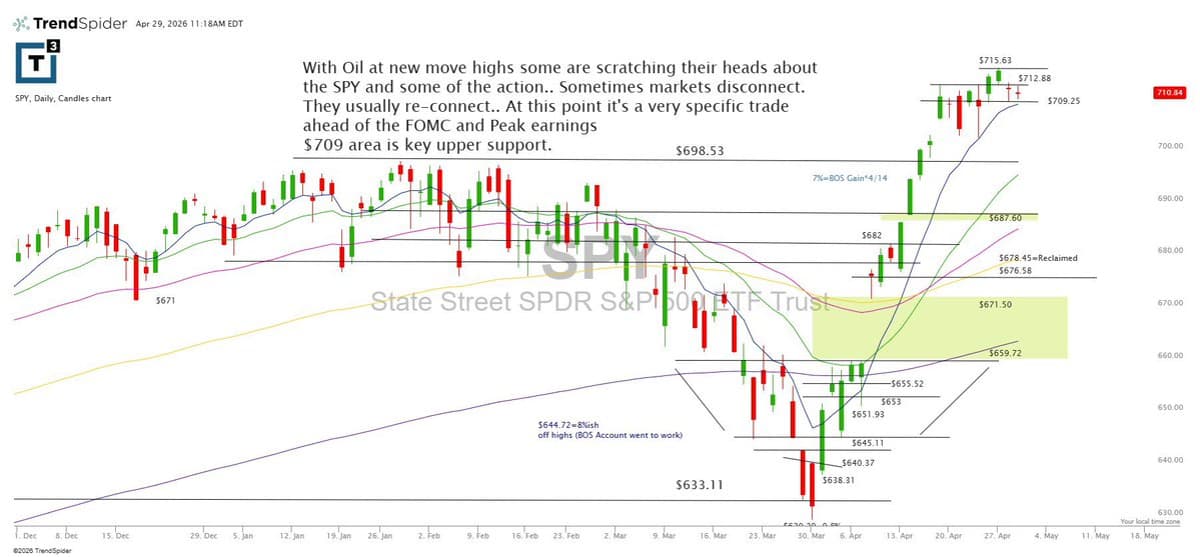
Oil Futures Surge Past $100, Stocks Remain Flat
June Crude oil Futures have been moving towards, and now have broken back above $100 ($106.43 +6.50), and stocks are yawning like its still $80. https://t.co/lX4zGyKkb7
ADTN Calls Surge 480% Since Dec/Jan
$ADTN working strong here with 8K Aug 11 calls bought in OI already up 480% from Dec/Jan buying https://t.co/yoeT5VtgLx

Avoid PSUS Until It Breaks $42, Else Risk Collapse
In the “Art of the IPO”. U don’t touch $PSUS unless it gets back above and stays above $42 Or gets killed in weeks ahead. It’s $40.79 now
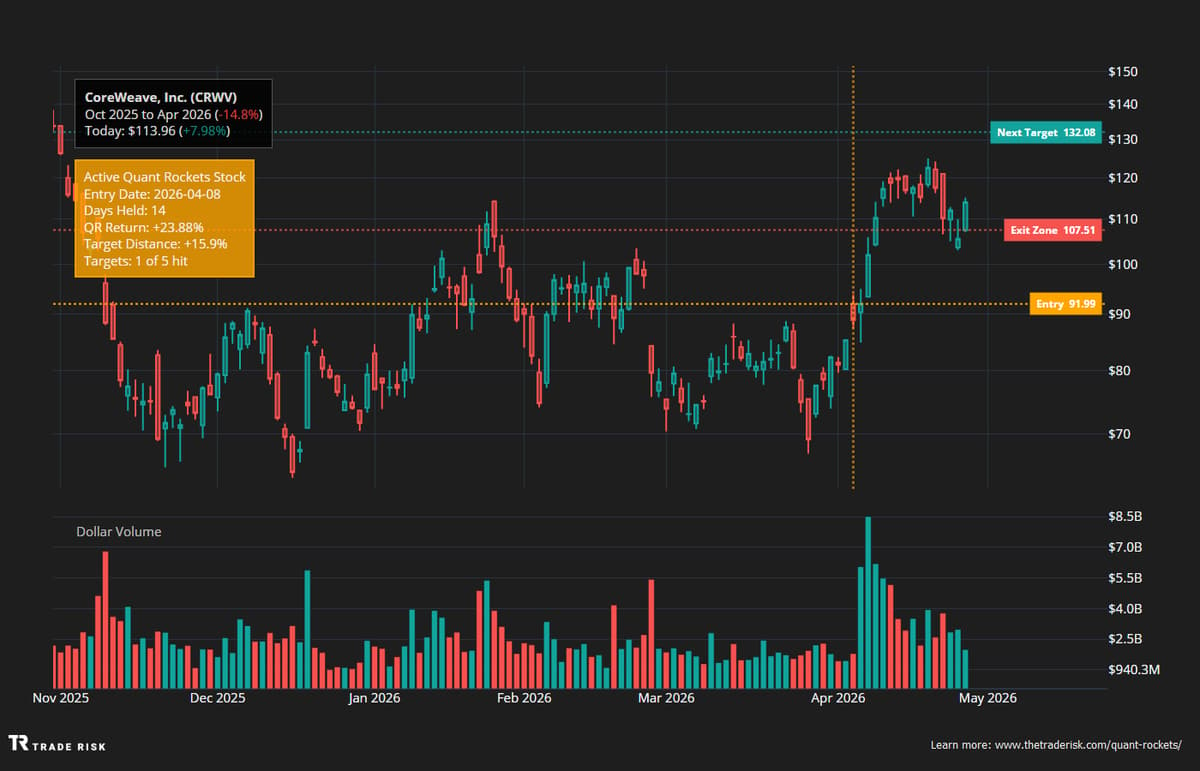
CoreWeave Rebounds, Remains in Momentum Book
CoreWeave bouncing right where we needed it to. Dancing around our exit, but for now it stays alive in the momentum book. $CRWV https://t.co/O8fYAxvVzg
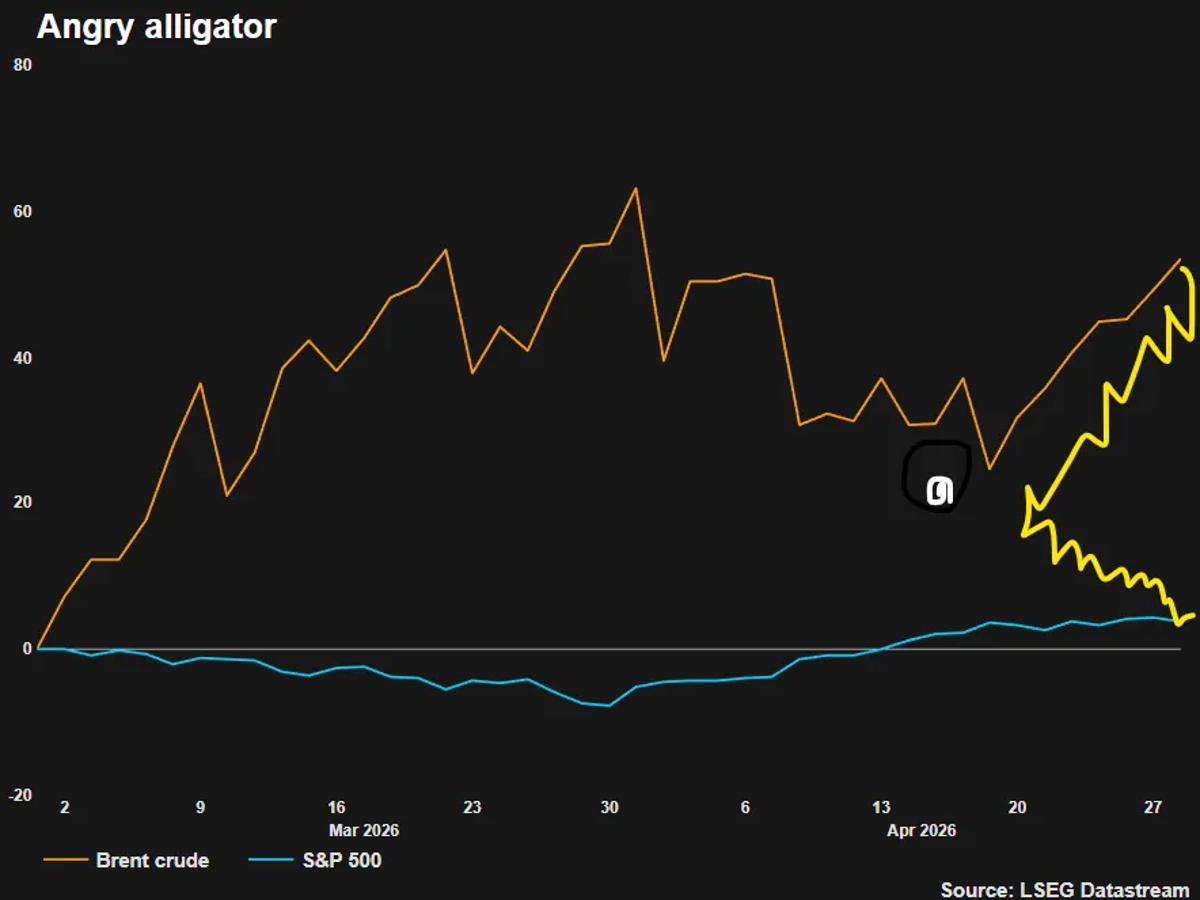
Equities and Oil Form Angry Alligator Pattern
Equities and oil making the well-known Angry Alligator technical pattern. (rebased from the start of the U.S.-Iran conflict) $SPX $SPY $VIX $USO https://t.co/kt1phTUNoS
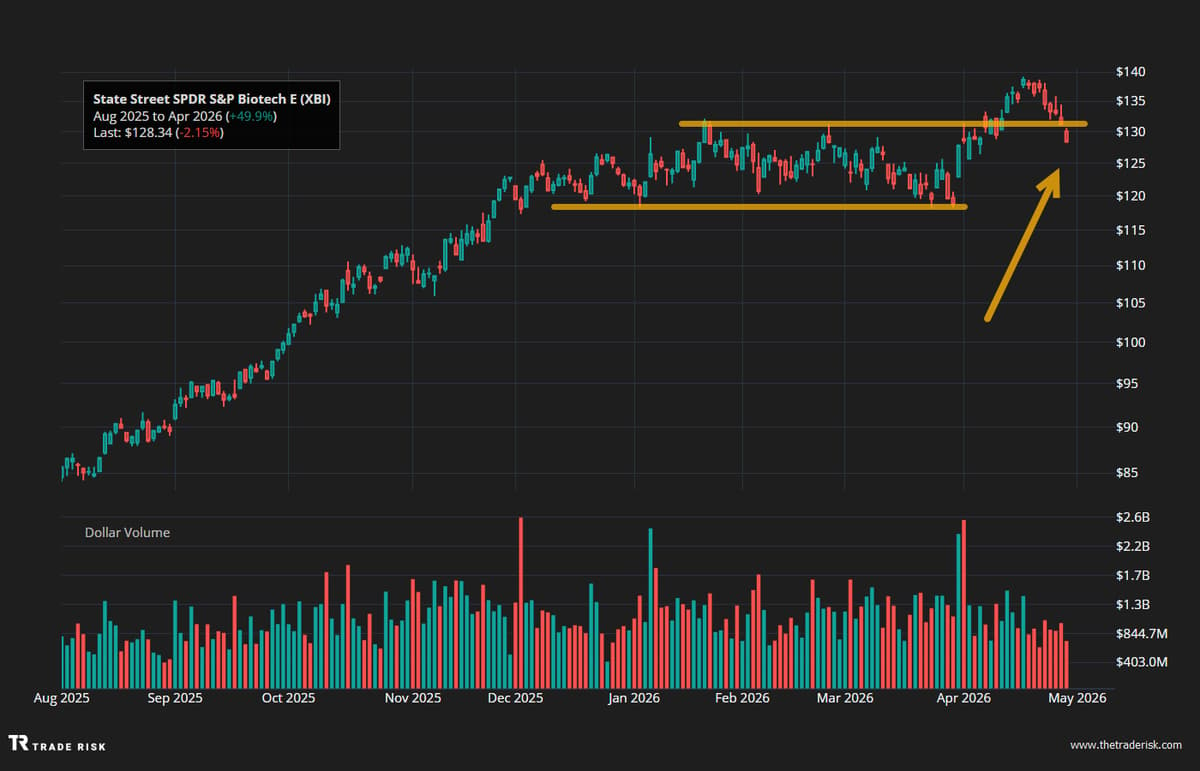
Biotech Momentum Stalls as XBI Dips Below January Highs
Still tough to hold momentum in biotech. $XBI slipping back below its January highs. Lets see if the weekly close can save it. https://t.co/zbU6jtuq35
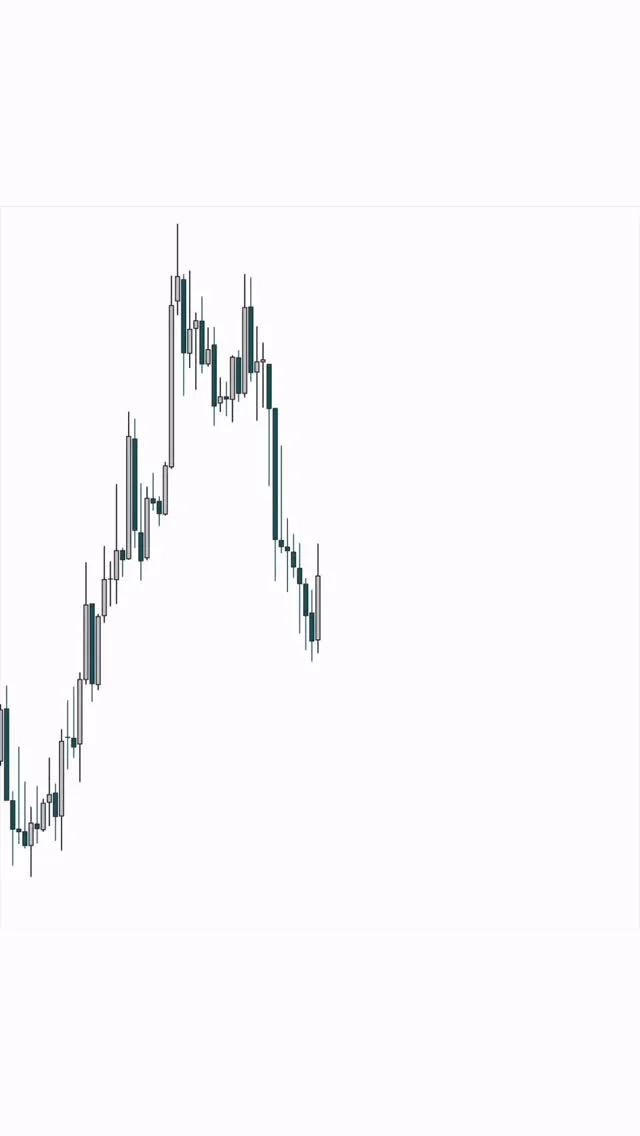
Low
Discipline low = mistakes high. This chart shows: Liquidity → CHoCH → OB → Drop That’s the real model. Follow for real setups. #Forex #Trading #SmartMoney #ICT #smc

SPX Hits New Highs While Dow Stalls Below Bondi Top
Pointing out that in spite of the SPX making new highs, the Dow has still not taken out the PAM BONDI TOP

Cautious Play Amid Strong Setups and Geopolitical Uncertainty
A meaningful number of setups have emerged from constructive bases, yet recent breakouts have been accompanied by an elevated rate of pivot sloppiness—an indication that follow-through remains inconsistent. The sharp rise in oil prices underscores a lack of progress on the...
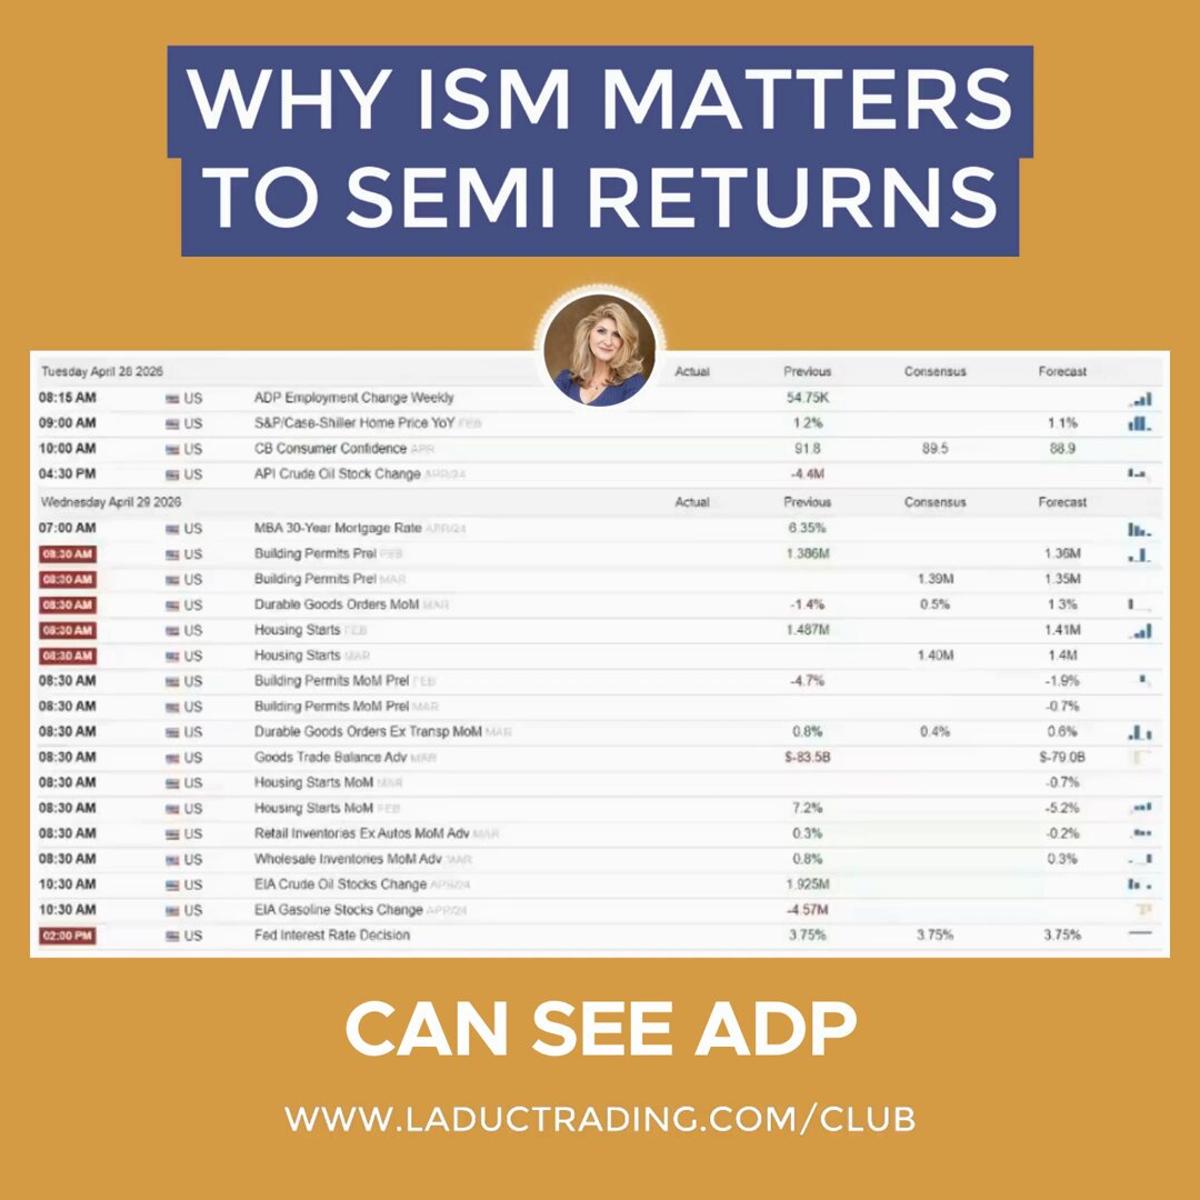
ISM Data Could Pivot Semiconductor Rally and AI Capex
ISM Thursday... Why it could matter to semi returns $SMH sentiment & fundamentals as driver to market’s bullish momentum & AI capex cycle should show in ISM manufacturing. If it doesn't... rotation into defensives can trigger exposing the fragile upside to markets....
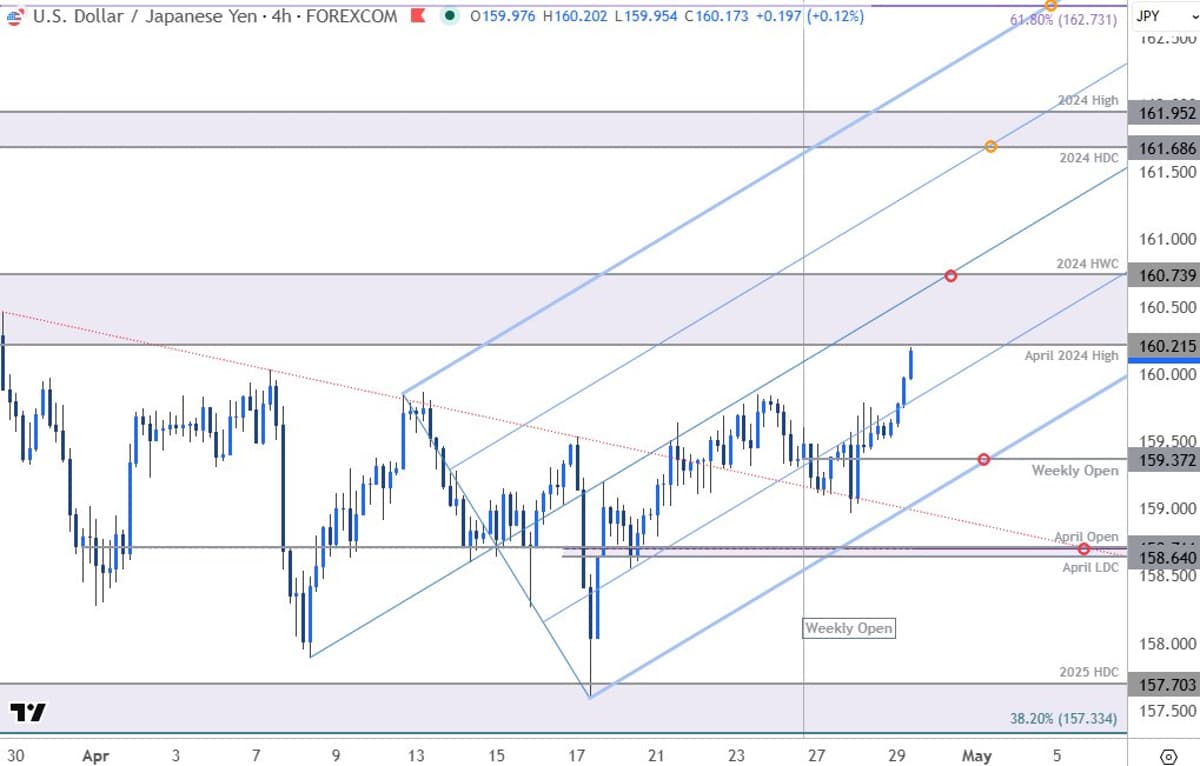
USD/JPY Poised for Yearly High Amid Fed Outlook
Japanese Yen Short-term Outlook: USD/JPY Bulls Eye Yearly High- Fed on Tap https://t.co/ccyORpFfkx $USDJPY Daily & 240min Charts https://t.co/E5R5glIagQ

Back‑to‑back Big Candles Forecast Third Strong Move
When two large green candles form back-to-back, the third one also tends to be a strong bullish move. The same pattern applies to red candles as well. Trading Tip of the day #1

Simplicity Beats Complexity: VWAP, Volume, Execution Edge
ICT is overrated. Most traders are chasing complexity instead of mastering structure. 😬 VWAP + volume + execution. That’s the edge. Comment WAVE and I’ll send the full guide. 🔥📊 #DayTrading #VWAP #TraderLife
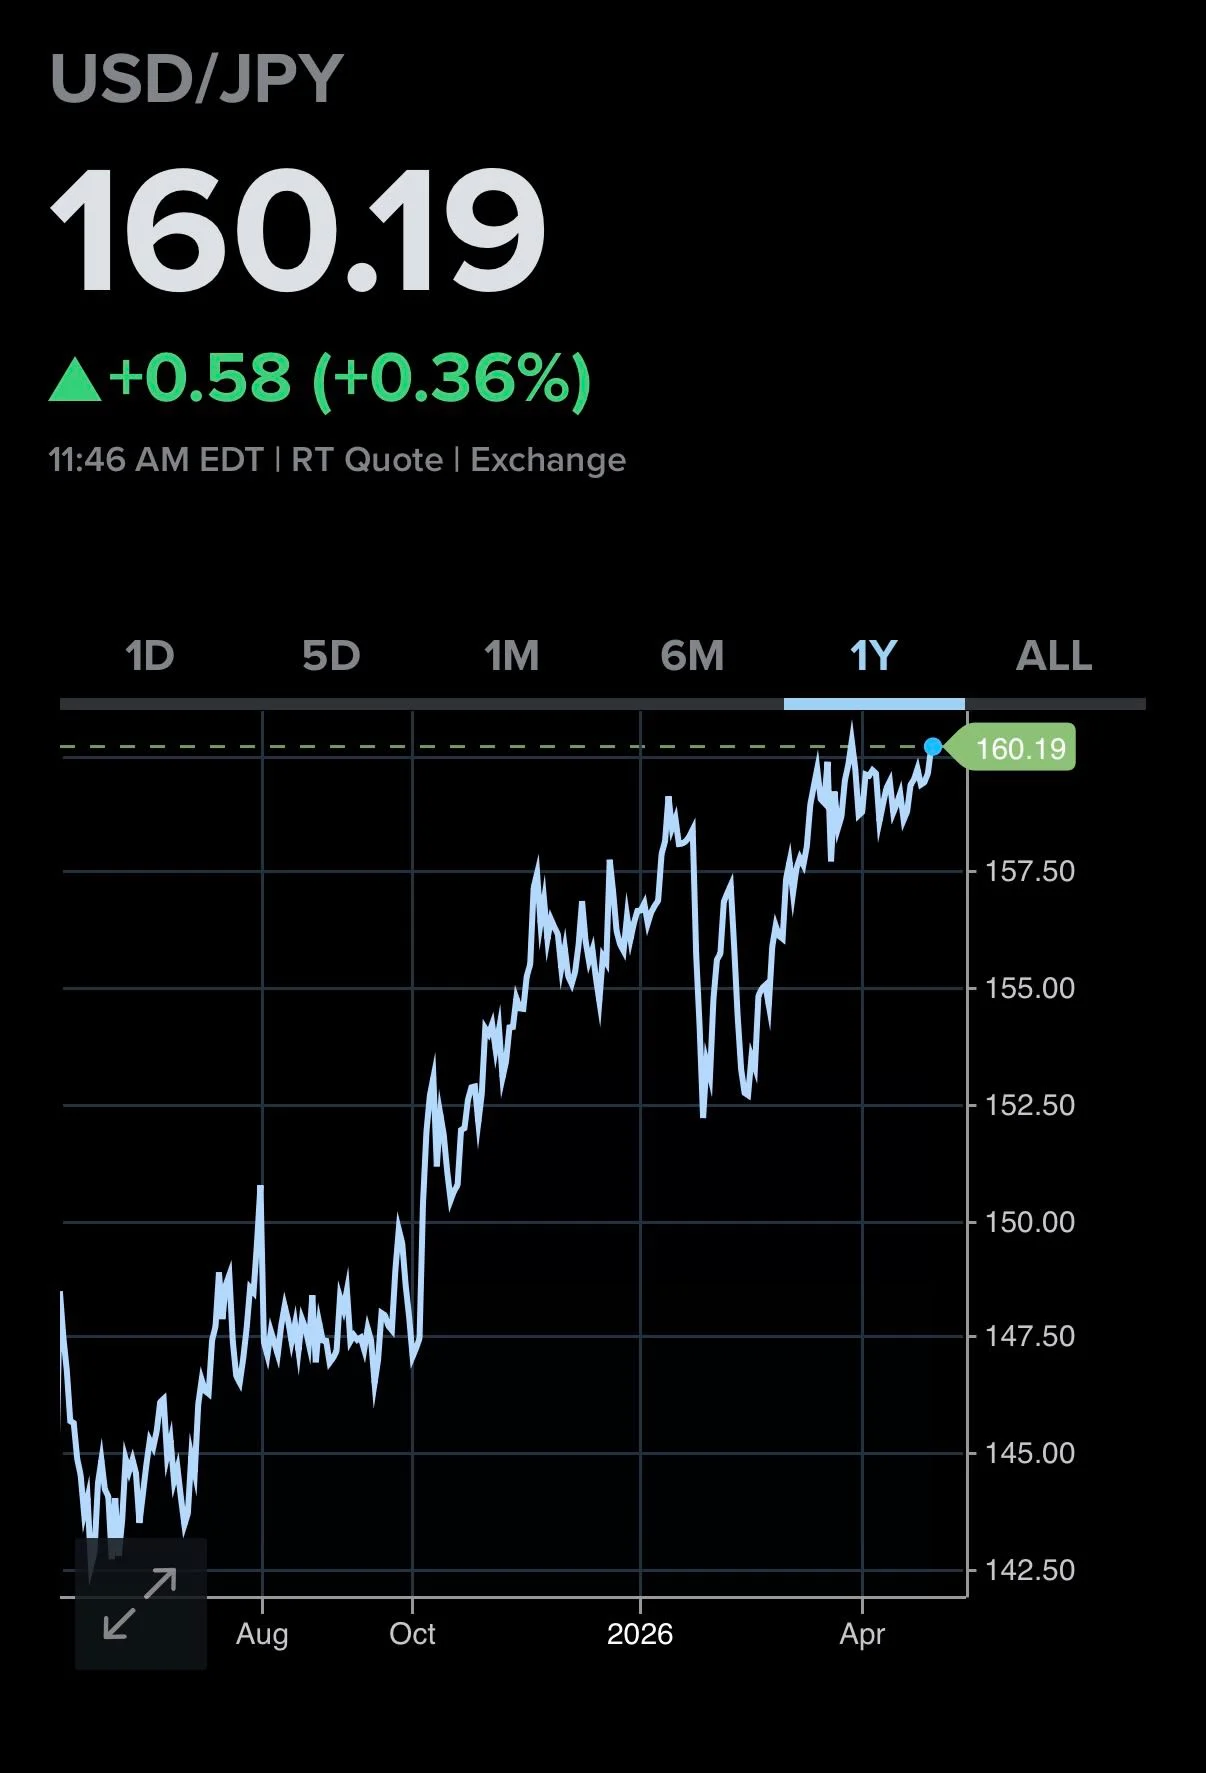
Yen Breaches 160/$: Markets Test Policy Limits
It's not just oil, UK yields, etc... In fact, the pace is starting to feel a little relentless as markets blow through what I regard as various "pay attention" levels. This includes the breach of 160 ¥/$ (CNBC chart below)....
Intel Swing Gains Momentum, High Conviction Praised
So far so good from top two weighed swing in mid 40s 🔥 $INTC Also great conviction on the idea @Respekchemistry thanks for pounding the table so hard 👏
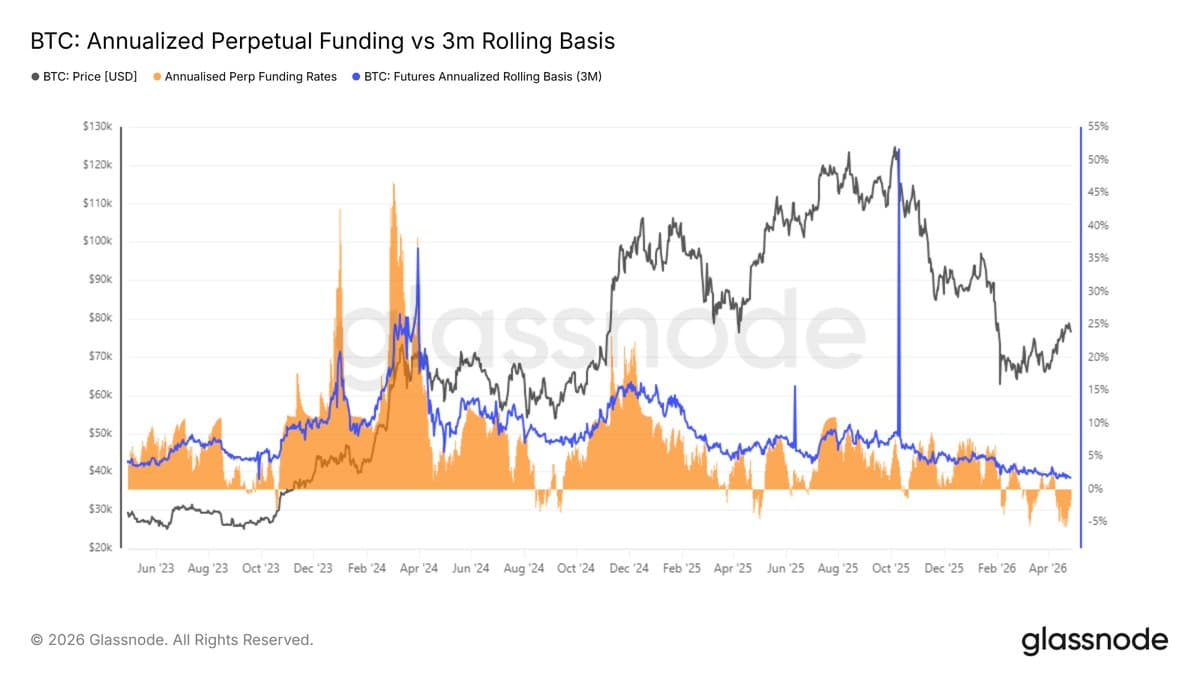
Bitcoin Capitulation Marks Best Five-Year Buying Opportunity
#Bitcoin is at its capitulation point. Eleven indicators are signaling that we're at the best opportunity to buy the asset in the last five years. The last time all these signals flashed was Q4 2022. That also resonates with the current market sentiment,...

Huge XLY Call Purchase Ahead
Consumer Discretionary (XLY) big buy 4000 March $116 calls $12.45 with Amazon a top component reporting, been weighed down by Tesla
Stocks Digest Oil's New Highs, SPY Stalls
$spy morning glance as indices and stocks try and digest new move highs in OIL https://t.co/ywBD1SxyHC

Partial Sale Executed, Stop-Loss Set for Remaining Swing
$ONDS a rung of the ladder sold for good %. Stop set to make some $ on the rest of the swing trade
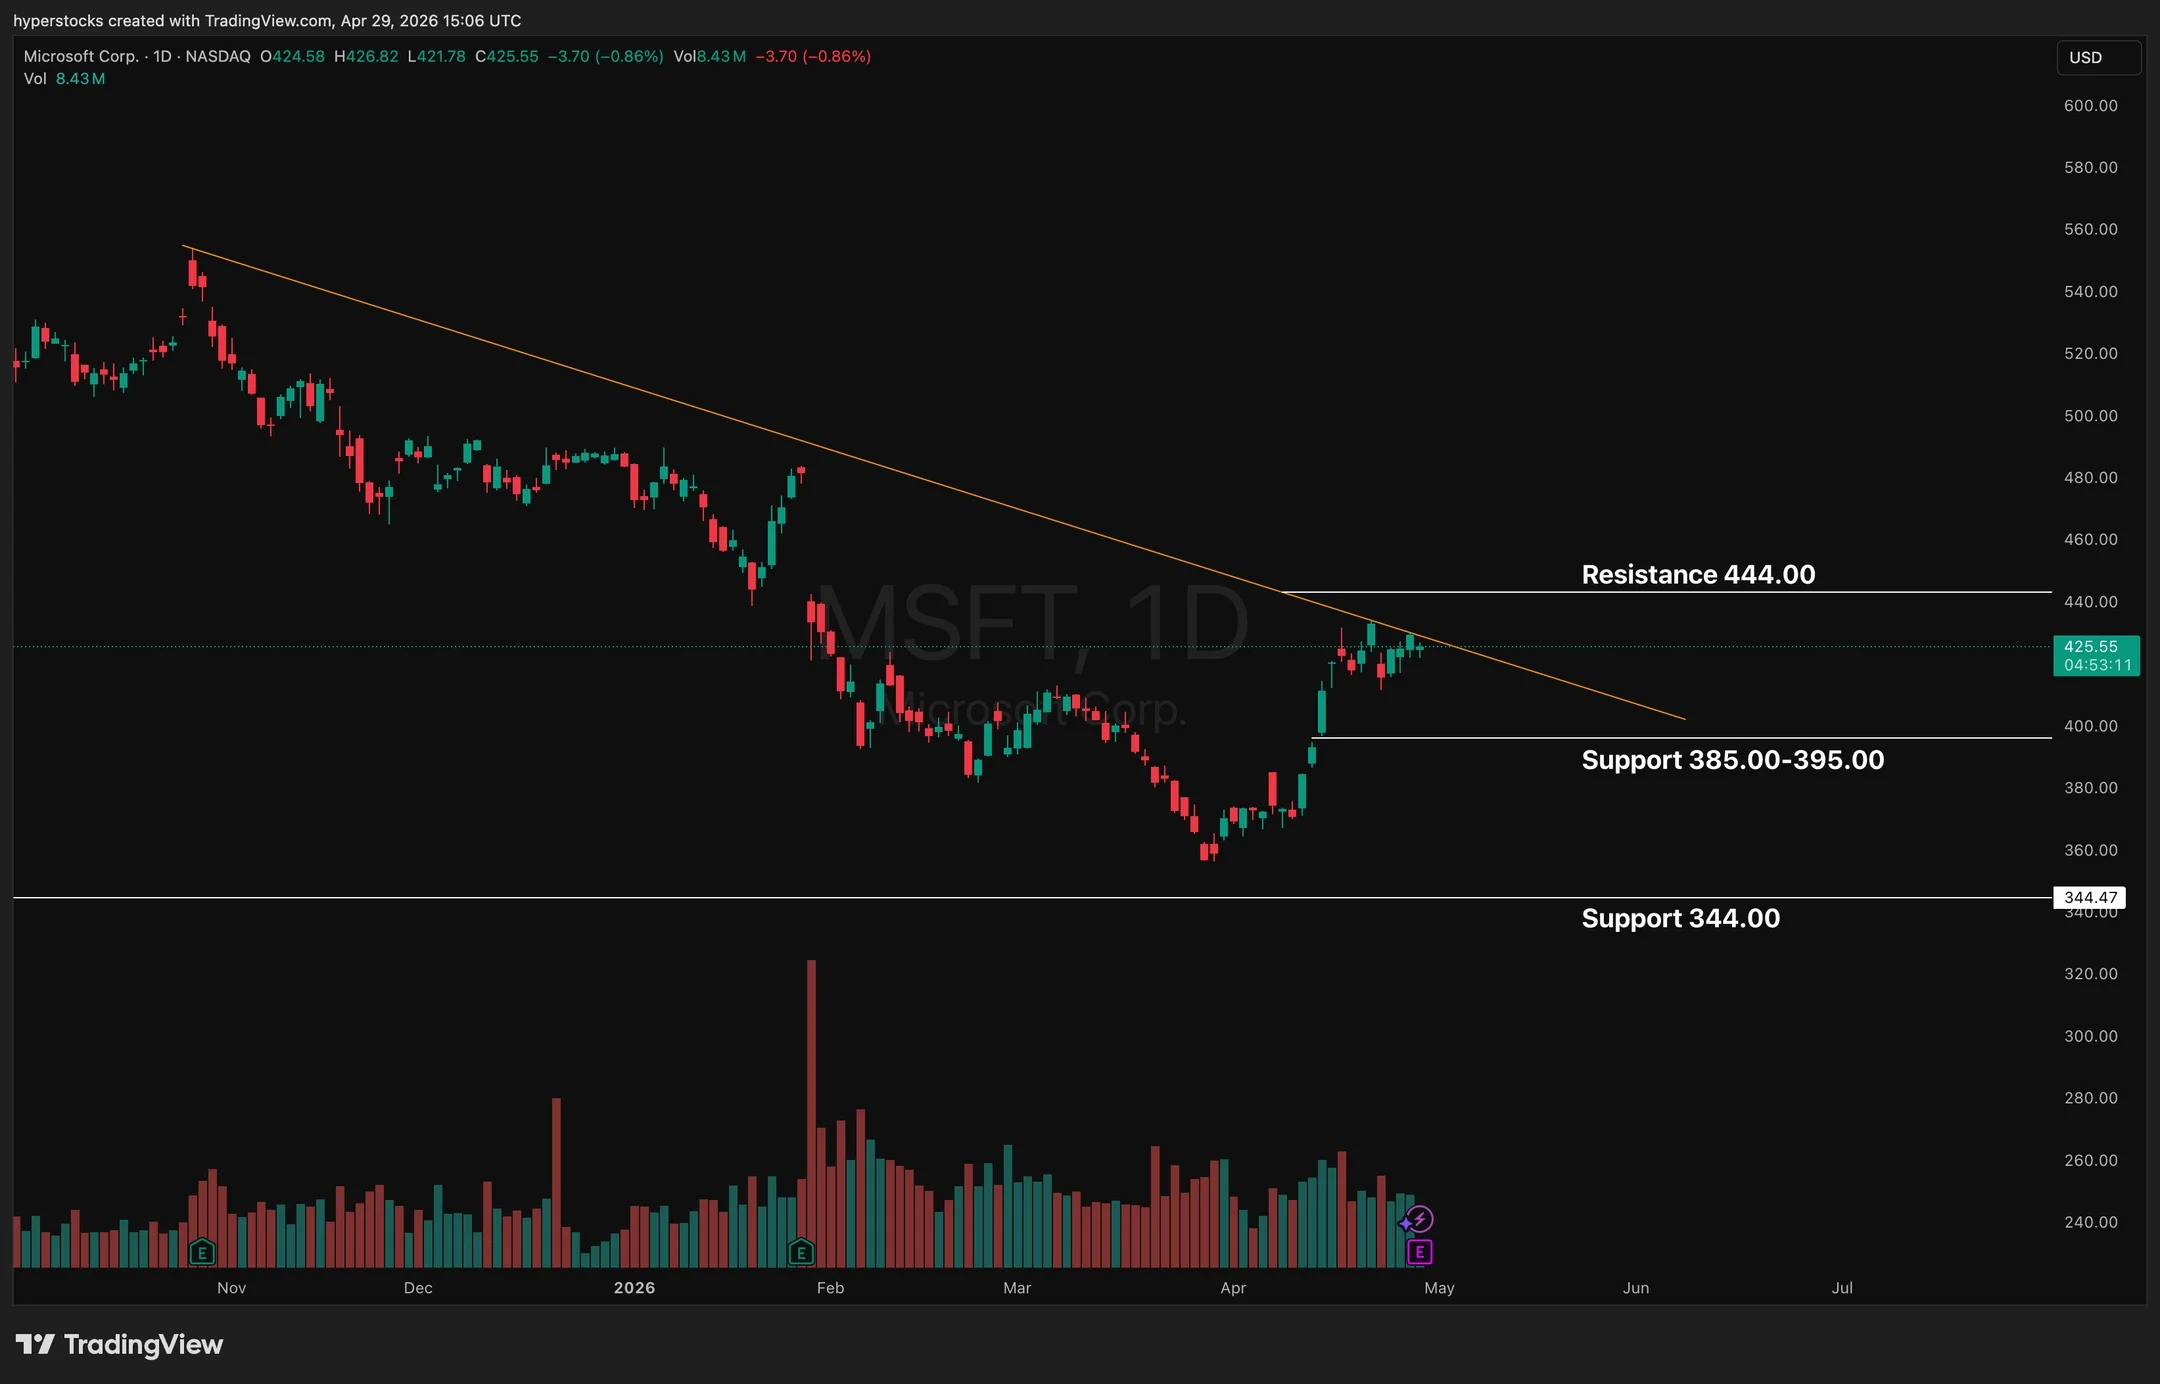
MSFT Options Signal Possible $37 Earnings Move
$MSFT chart ahead of earnings. Option chain expiring on May 15th 2026 projects a (+/-) $37 move from the underlying stock following the report.

Intel Surges 10% on Bullish Opening and OTM Alert
$INTC up 10% now as bull flow continues from early opening bell alert and yesterdays big OTM buy alert
Google Pays Up to $1B for Intel TPU Capacity
Amazing that it only took this bullet point to move $INTC this way today (from 3pdata shop) but then again the Apple chowda is out there today "Intel appears to have won the GOOGL/MTK TPU ramping in late CY27. "We...
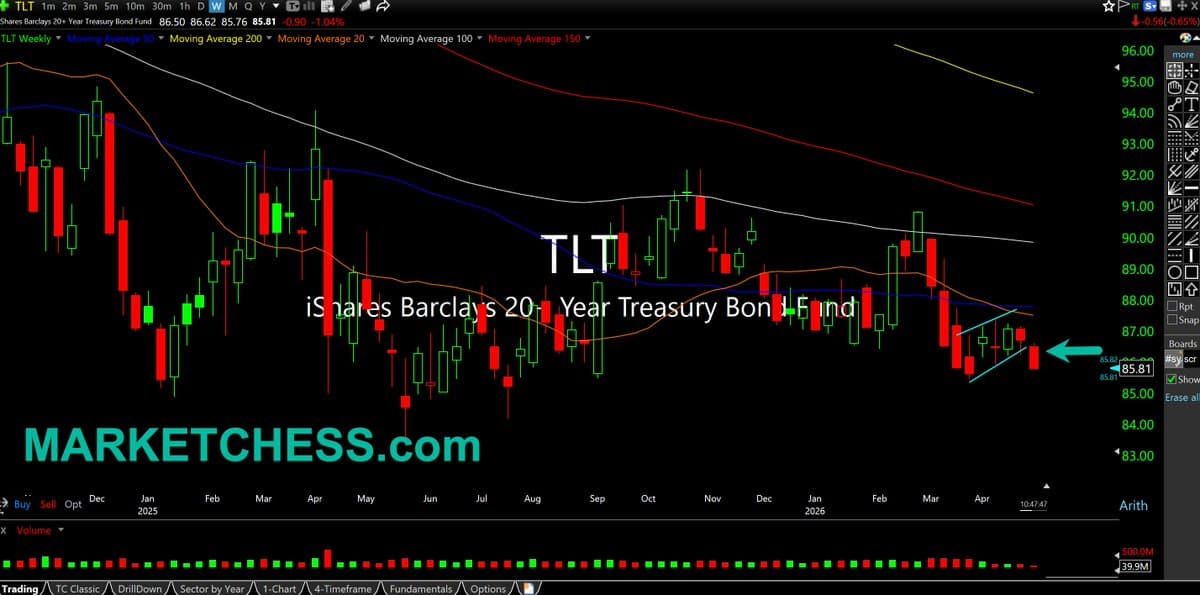
Treasuries Near Multi-Year Breakdown Ahead of Powell's Final FOMC
$TLT Weekly. Headed into Powell's final FOMC, Treasuries on brink of not just multi-month breakdown but multi-year as well. Bear flag threat here, which means risk of rates spiking higher yet https://t.co/BKBIEADTxm
Trade with a One‑Screen, Indicator‑Free Volume Strategy
Most traders are guessing. I’m not. My entire strategy fits on one screen: Volume (4×3 / 25M) Contraction Break trigger Breadth confirmation That’s it. No indicators. No opinions. No noise. Just positioning when the odds shift. I share the process daily. If you want to see how I trade this in real time: 👉...

TTD Fails Breakout, Reverts to Base, Stops Hold
$TTD failing on the break higher and back in the base. No change to the stops
SOXX's Parabolic Surge Signals Unusual Market Momentum
"When you see the $SOXX, that's absolutely gone parabolic, like literally a straight line, over the last few weeks... that's not normal" https://t.co/tqy78j543v

Partial Short-Cover Initiated in Today’s Tactical Update
(PREMIUM) "Tactical Update: April 29, 2026 - Dust up..." First move today is a (partial) short-cover - via The Lyons Share https://t.co/FjyJMVoZD7 https://t.co/aJA1YVsFyf

Holding Positions On
Moved up let it ride stops on $QCOM $WDC $MU No new yet today and no alerts for new sounding.
Memory Stocks Surge; NVDA Remains Core Long
📺 MEMORY STOCKS ARE EXPLODING & WHY I’M STILL LONG $NVDA Memory stocks are exploding after $STX delivered a blowout quarter, triggering massive upside across names like $MU and $SNDK. This group has been trend-perfect — higher highs, respecting moving averages, strong earnings...

ETSY Put Spread Busts, Likely Worthless at Expiry
$ETSY "Trade Idea 1: Buy the May 1 Expiry 63/60 1×2 Put Spread for a 5 cent credit." a bust, will expire.

May Call Spread Bust; Consider Rolling Puts Down‑Out
$HOOD "Trade Idea 2: Buy the May 1 Expiry 83/86 Call Spread ($1.21) and sell the May 1 Expiry 74 Put for 30 cents.' a bust, may need to roll puts down and out.
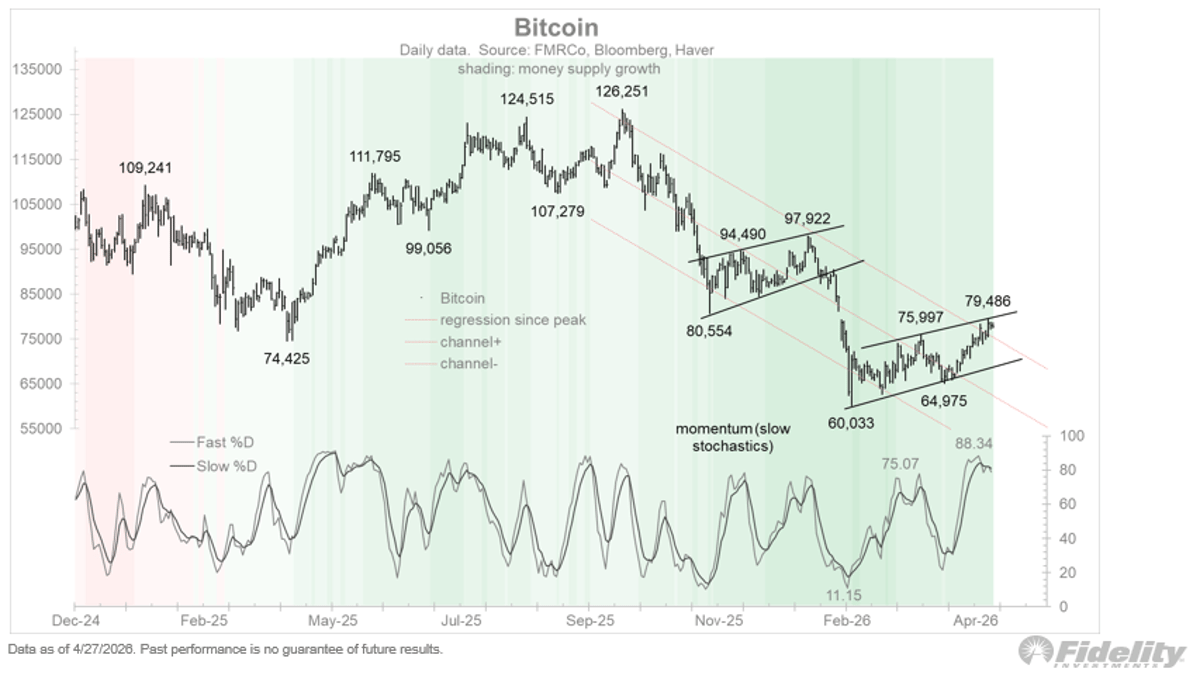
Overbought Momentum Signals Emerging Bitcoin Bull Market
Bitcoin also continues to show resilience as it tests the upper bounds of a potential bear flag. Technical Analysis 101 states that when bear market rallies get overbought (per the stochastics below), it’s usually the kiss of death and time...
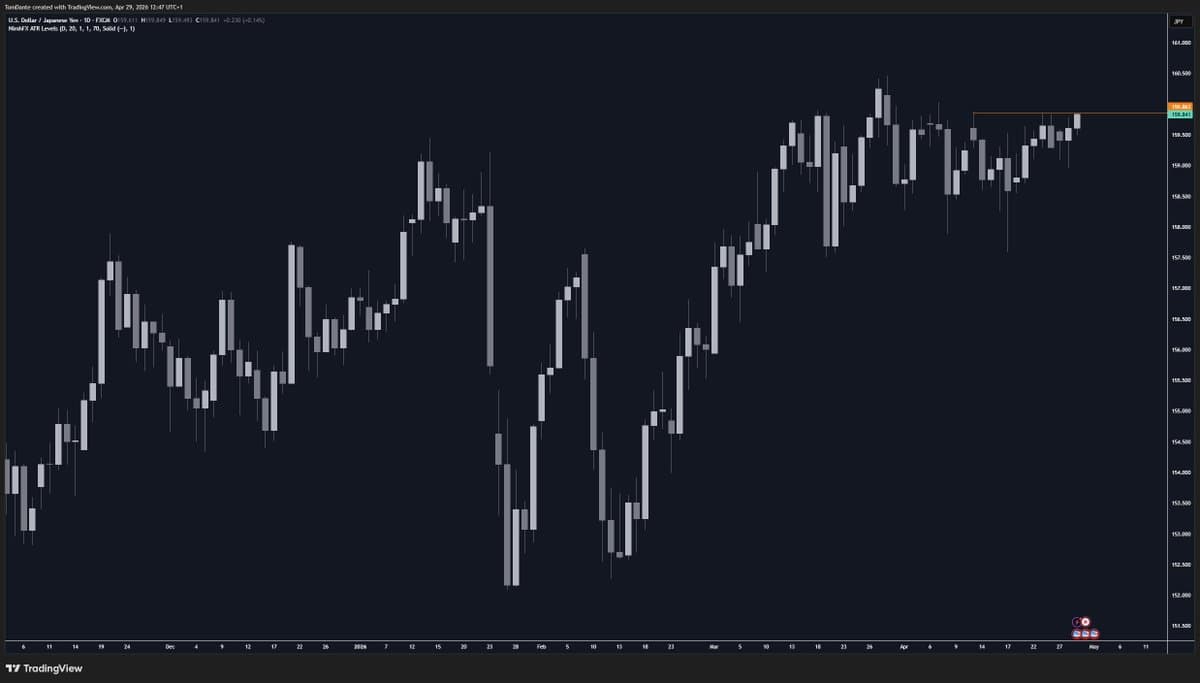
Seized USDJPY Breakout, Earned +6.39R Profit
Caught a great opportunity in USDJPY yesterday morning. Sharp drop on the BoJ announcement flushed support, then recaptured it. Bid the HoH, right into the level, stop below. Closed just now on the breakout of D1 resistance for +6.39R. Sorry for being...
Semi Market
Damned If We Do and Damned If We Don't 💫Semi Surge Seems Stressed 💫Semi Reflexivity In Full View 💫The Stealth Buyer Still In The Room https://t.co/ObymQYFfzf
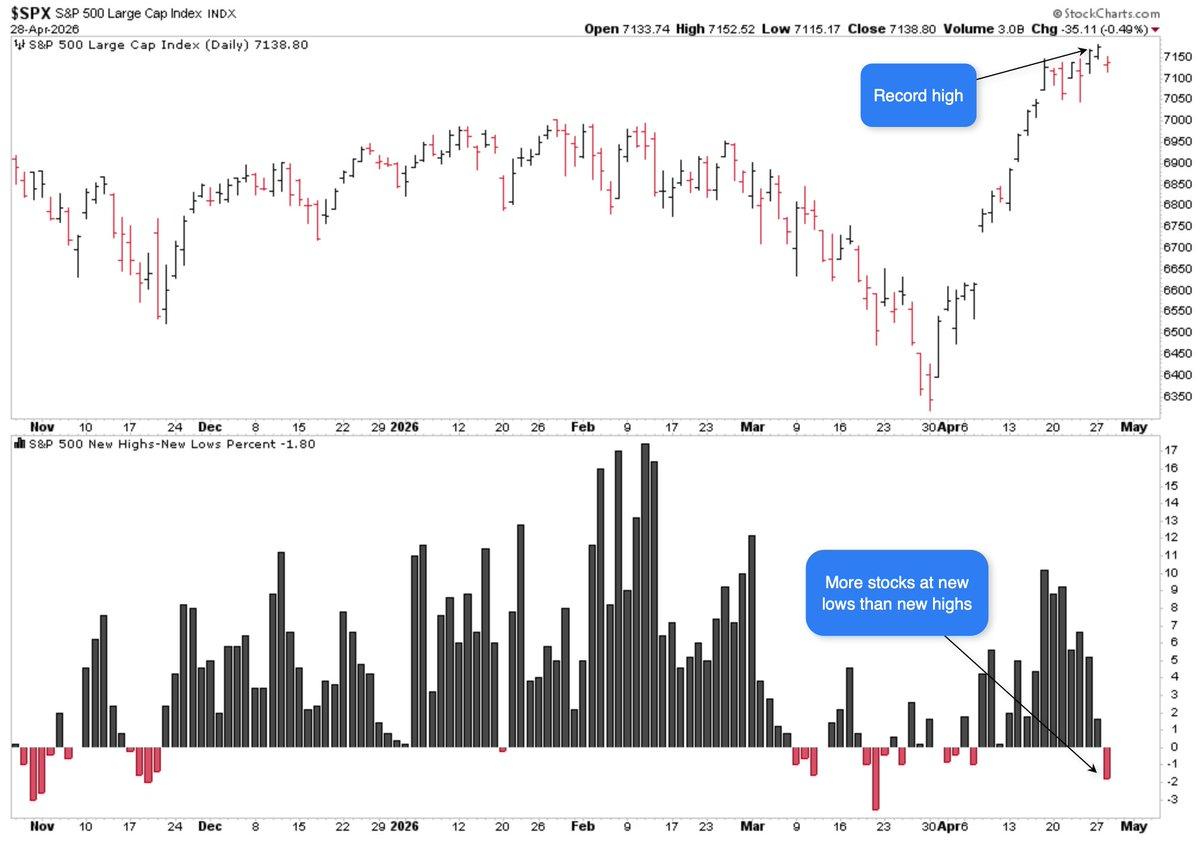
Rare Market Divergence: More Lows Than Highs After Record S&P
On Monday, the S&P 500 $SPY closed at a record high. The next day, at least 1% more stocks hit a 52-week low than a 52-week high. In 70+ years of history, that's happened twice. Yesterday was one. January 3, 2000 was...