Retail's ODTE Call Buying Sparks Scratcher Mania
It's not just that retail is buying call options that matters; it is that their weapon of choice is ODTE. It's scratcher mania.

Small Gap Up: Raise Stops, Hold Longs Despite Overbought
Good morning stock fans. Small gap up allows us to sell some and/or move up stops. I have moved many stops a bit higher this morning. I have not sold any shares yet in premarket. Markets...
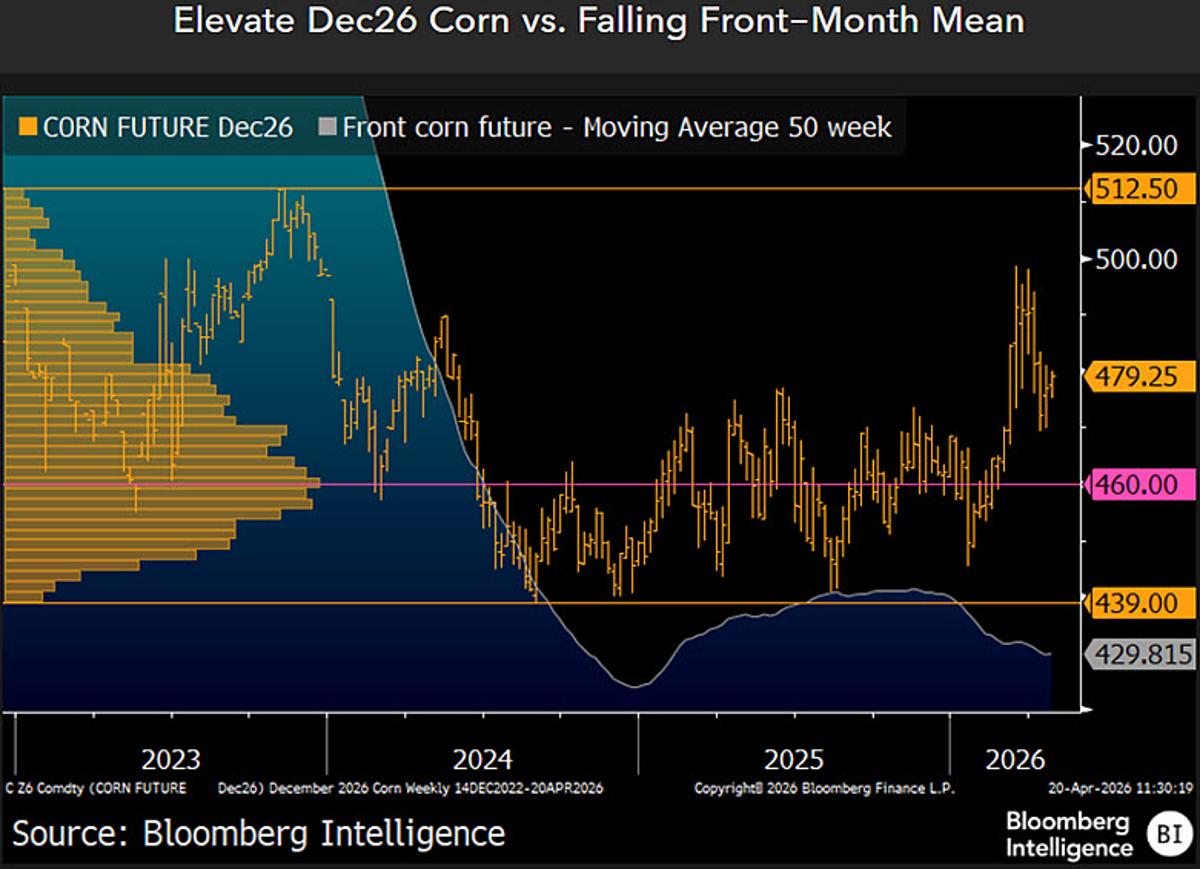
December Corn Likely Slides Toward $4.30
December Corn May Lean Toward $4.30 vs. Above $5 New-crop December (Dec26) corn, at about $4.80 a bushel on April 20, may have a greater propensity to extend its life-of-contract low near $4.39 than to stay above the high of around...
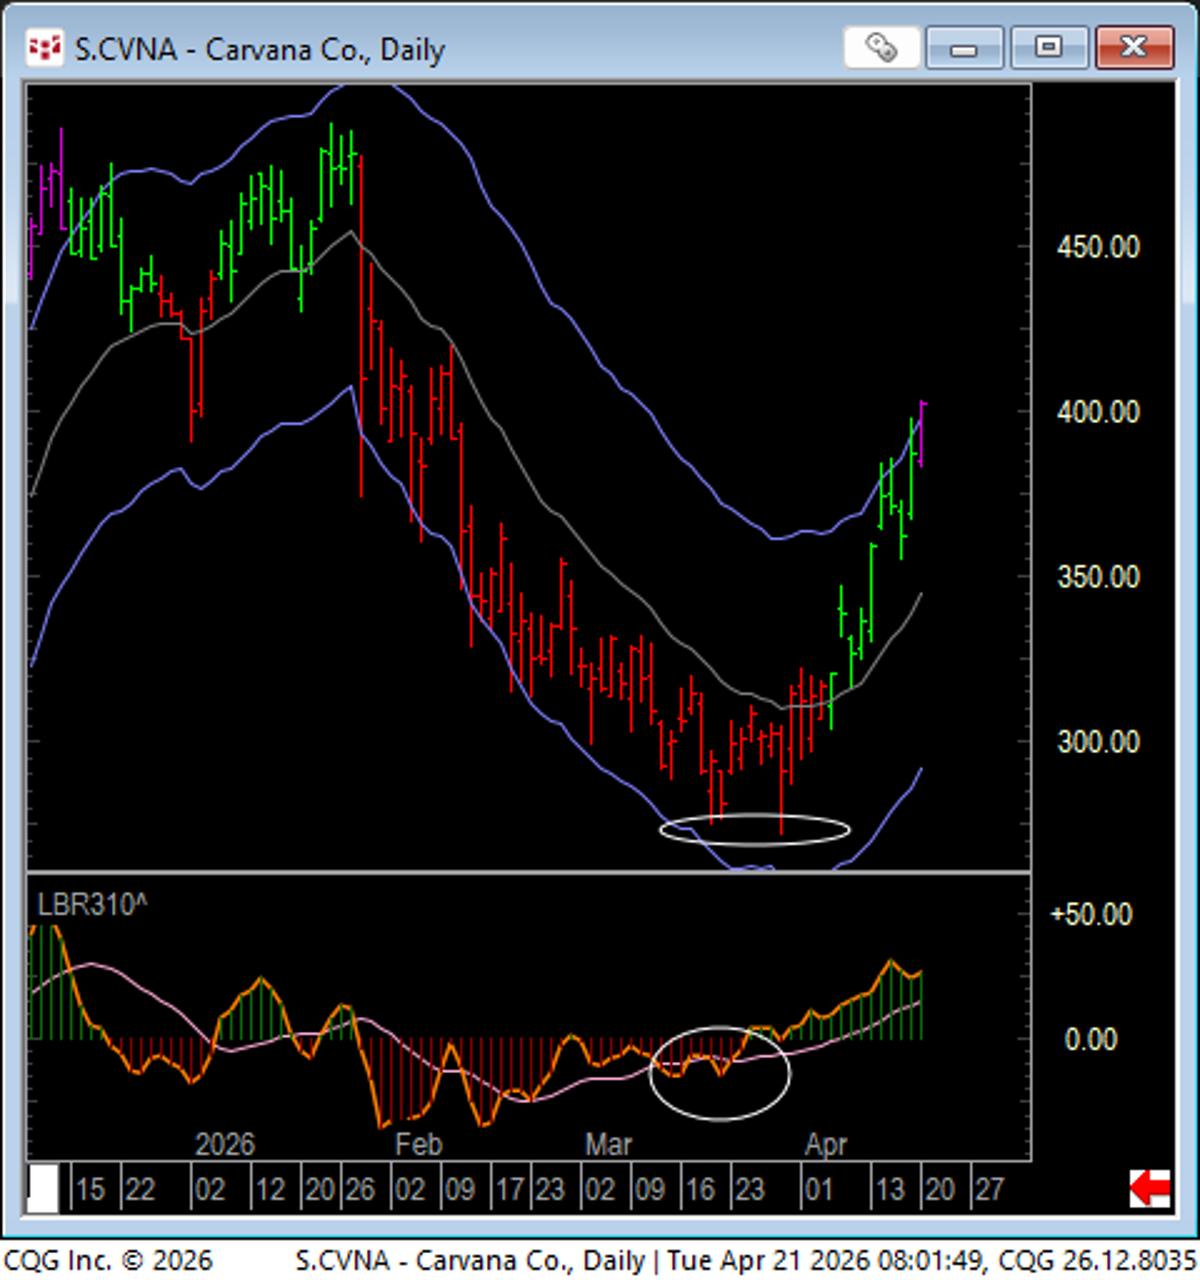
CVNA Spikes, First Keltner Channel
CVNA....zero to 60 in...(!) First close back above KC is an exit when in an overall trading range. https://t.co/AHlHgChU24

Market Surges as Earnings Beat and Strategic Deals Ignite
Another day another run for all time highs, and if you listen closely you can hear $CAR shorts and their tiny little cries. $AAPL announces Tim Cook's replacement come September, and $UNH gaps higher on earnings with a beat and...

Amazon, Apple, GE Aerospace, UnitedHealth Top Premarket Movers
JUST IN: Amazon, Apple, GE Aerospace, and UnitedHealth lead the biggest premarket stock moves, with others following.
CTAs Flood S&P with $8B Daily, $50B by Month‑End
Price-agnostic CTAs are now strong buyers of the S&P 500 and pump $8 bln /day into the market. Until the end of the month, the total increase in S&P exposure could reach $50 bln. There is currently no scenario, where...

High‑beta Assets Surge After Late‑March Market Dip
Off the late March Lows - High Beta Meme $MEME +59% Bitcoin Miners $WGMI +55% Cannabis $MSOS +38% Semis $SOXX +35% Quantum Computing $QTUM +26% Ark Robotics $ARKQ +23% Copper $COPX +22% Uranium $URNM +20% Silver Miners $SIL +19% Nasdaq 100 $QQQ +16% Bitcoin $IBIT +15% Missing?
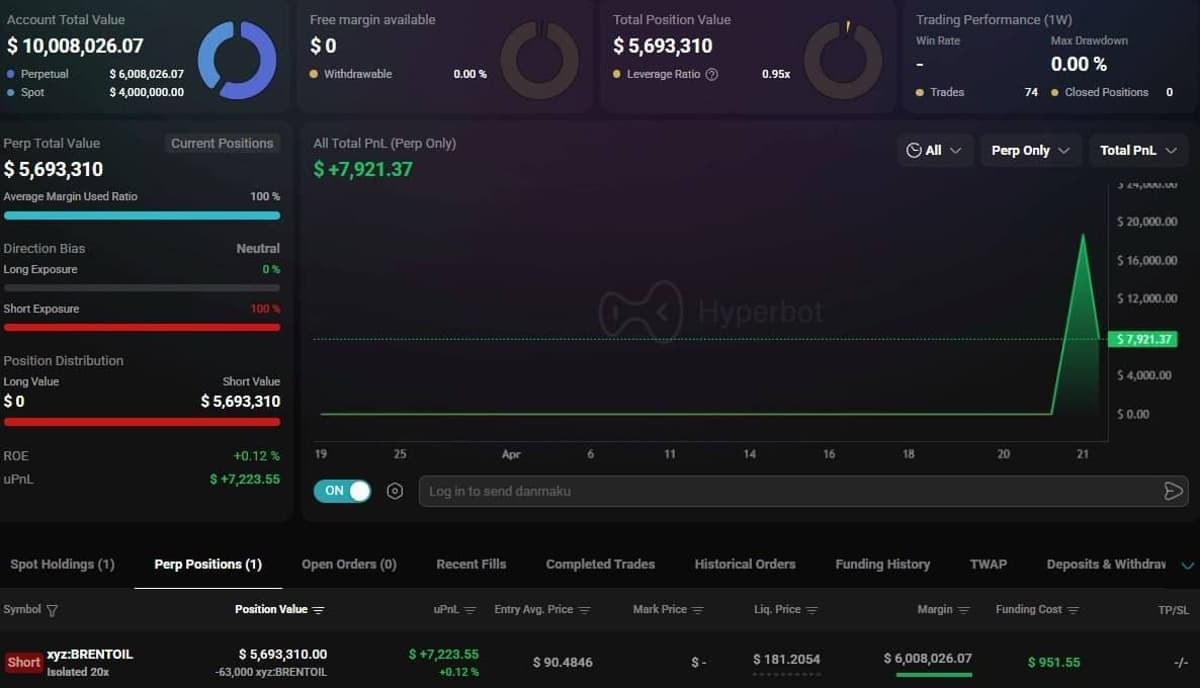
Whale Bets $5.6M on Oil Drop Before Trump Speech
🚨 WHALE BET AGAINST OIL 🚨 A whale just opened a $5.6M OIL SHORT ahead of Trump’s speech today This isn’t random… Does he know something we don’t? https://t.co/1gzLAufWll
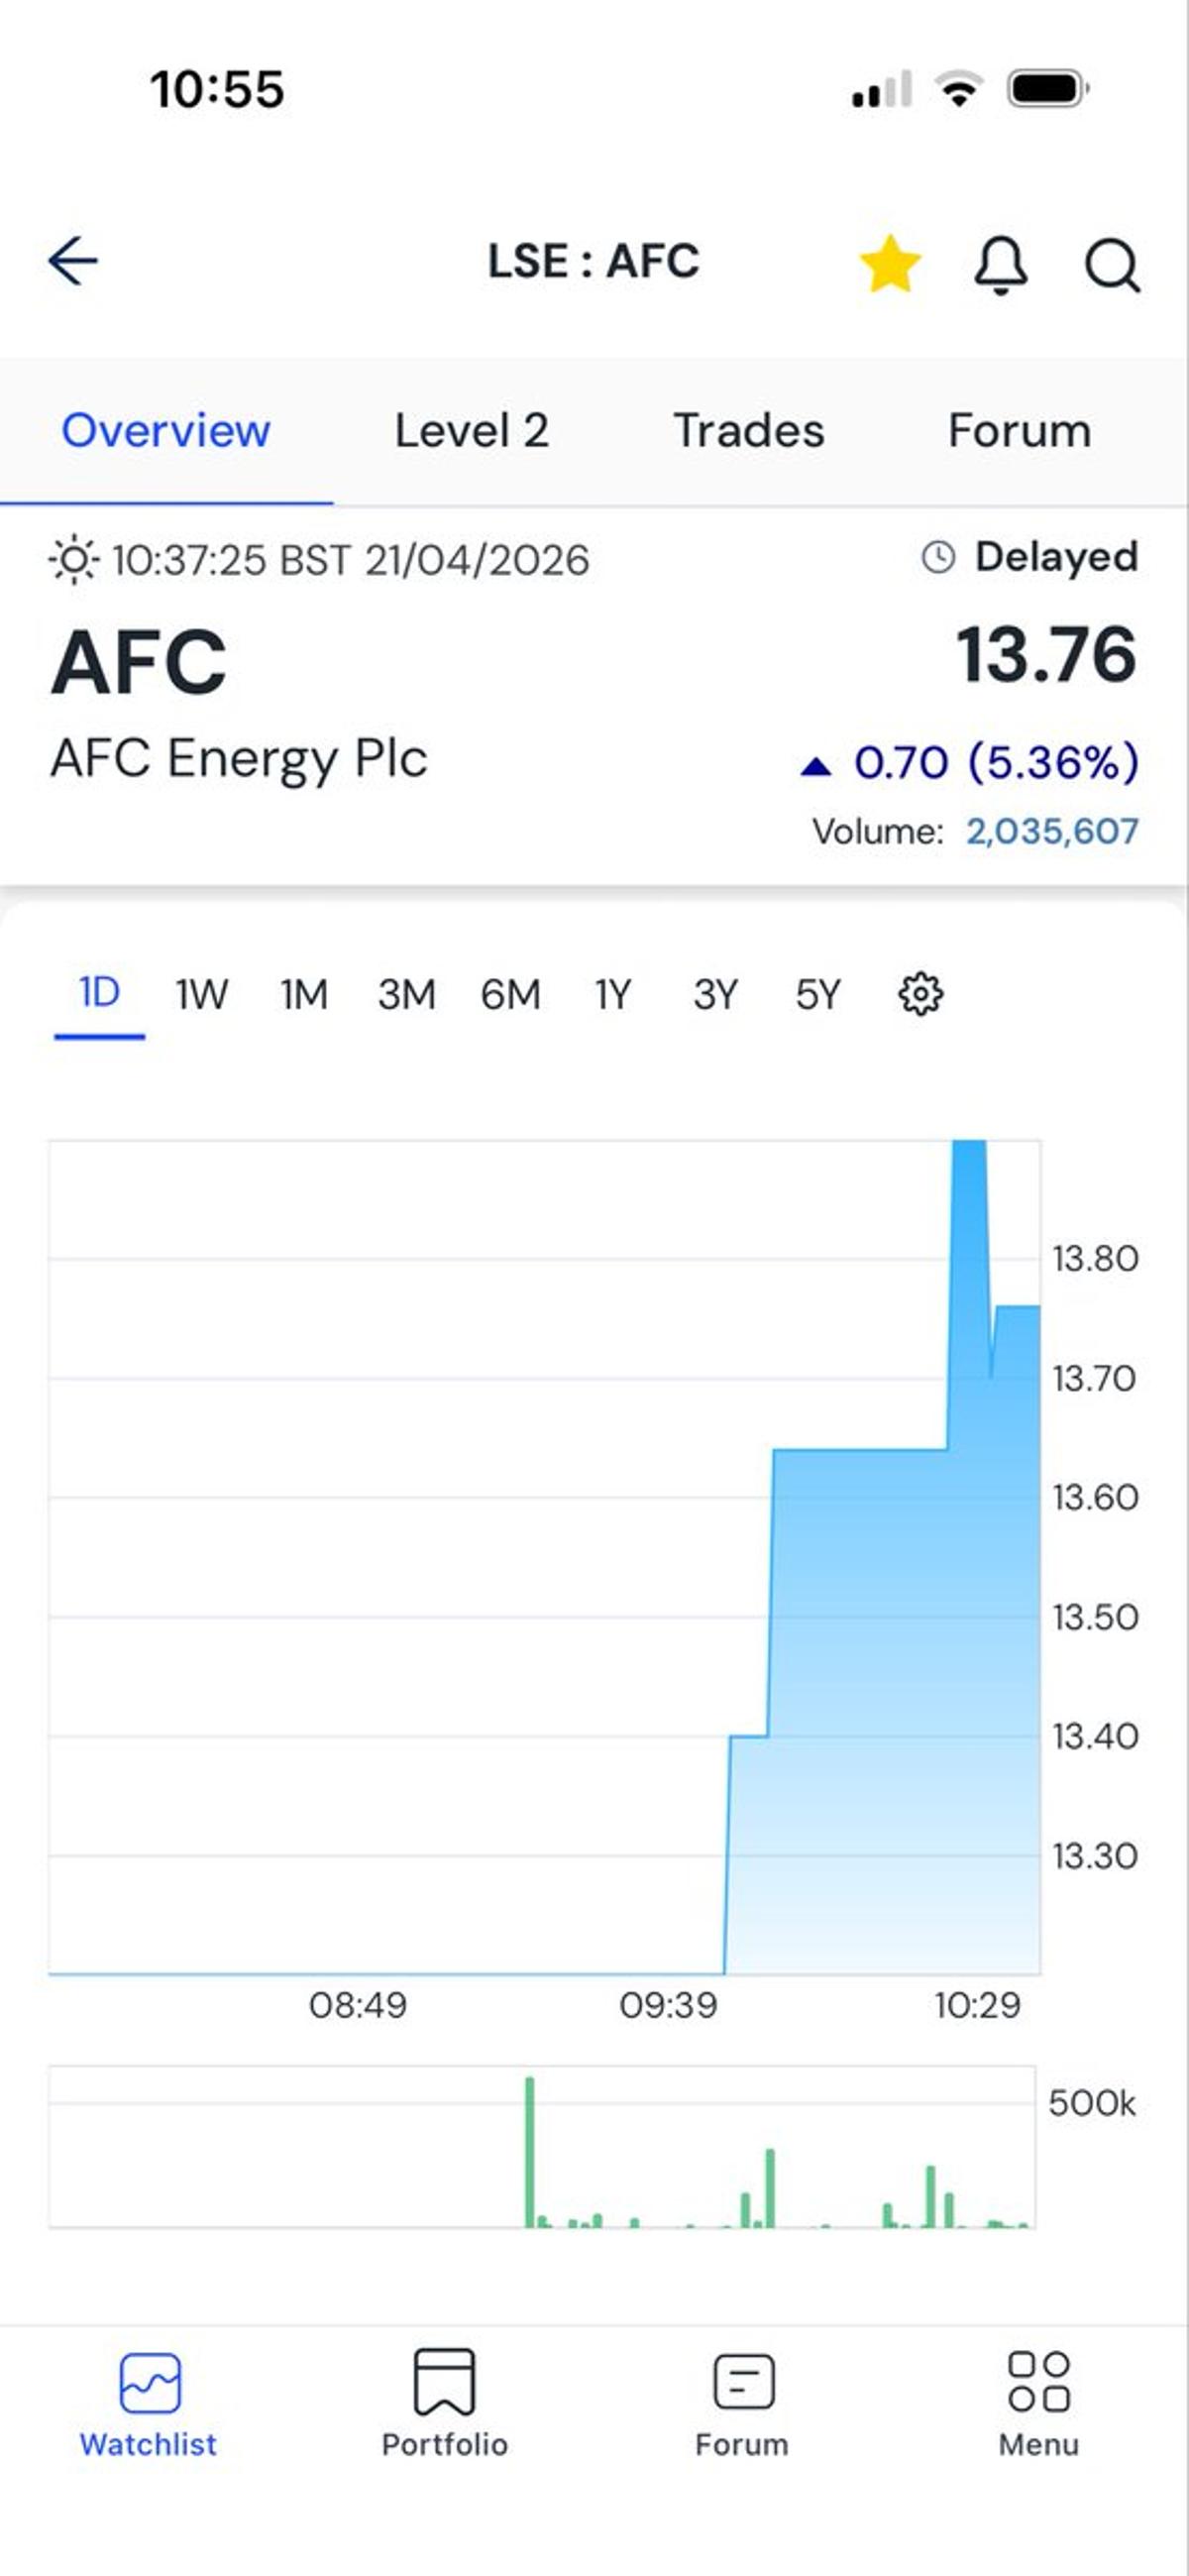
Don’t Complain if AFC Hits 20p—Momentum Ahead
When #AFC are 20p please please don’t moan at me you never bought as like #Kino at 11p (88.5p sold ) it’s gonna happen . dyor #afc #cwr #itm Ride the momentum 😜 https://t.co/yD71SSCQSd
Screenshot‑worthy Gains Mean It’s Time to Cash Out
If your trading profits are big enough to take a screen shot of then they’re big enough to exit for a profit.
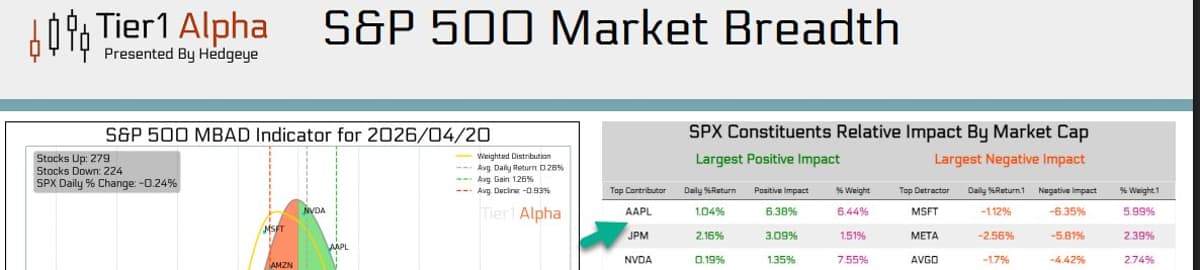
Hedgeye Bullish Breakout Signals Hit Apple, JPM
SIGNALS: our Bullish @Hedgeye TREND Breakout Signals on both $AAPL and $JPM came right on Quad Shift Time https://t.co/mbbhsQ5SRt
IGP Gains 8% on New Orders, Valuation Drops
#IGP won $3.8m over 3 new orders. ShareScope has fwd p/e 18 falling to 15.4 and no Dividend, BEFORE 8% jump today. Still interesting. I don't hold.
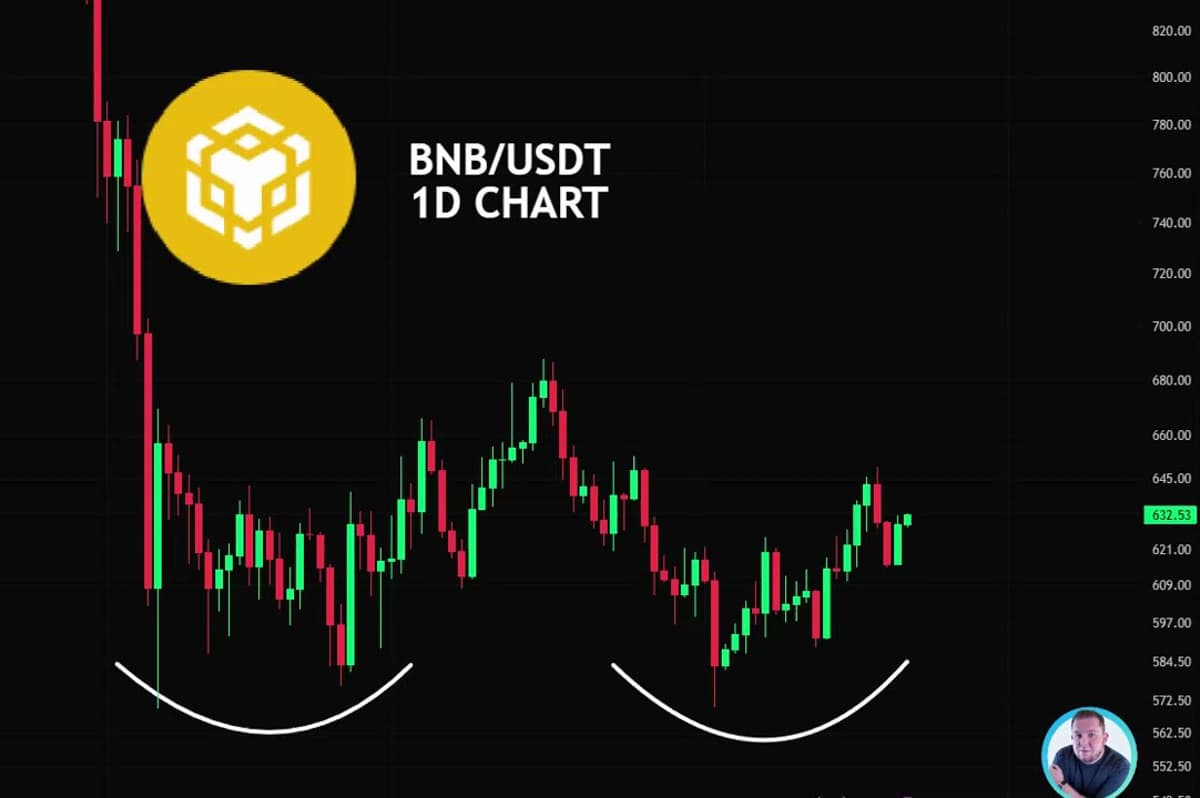
BNB Shows Double Bottom Formation—Stay Alert
🚨 RIGHT NOW 🚨 $BNB is forming a double bottom pattern 👀 Don’t miss this - stay alert. https://t.co/hxNrCpaBL8
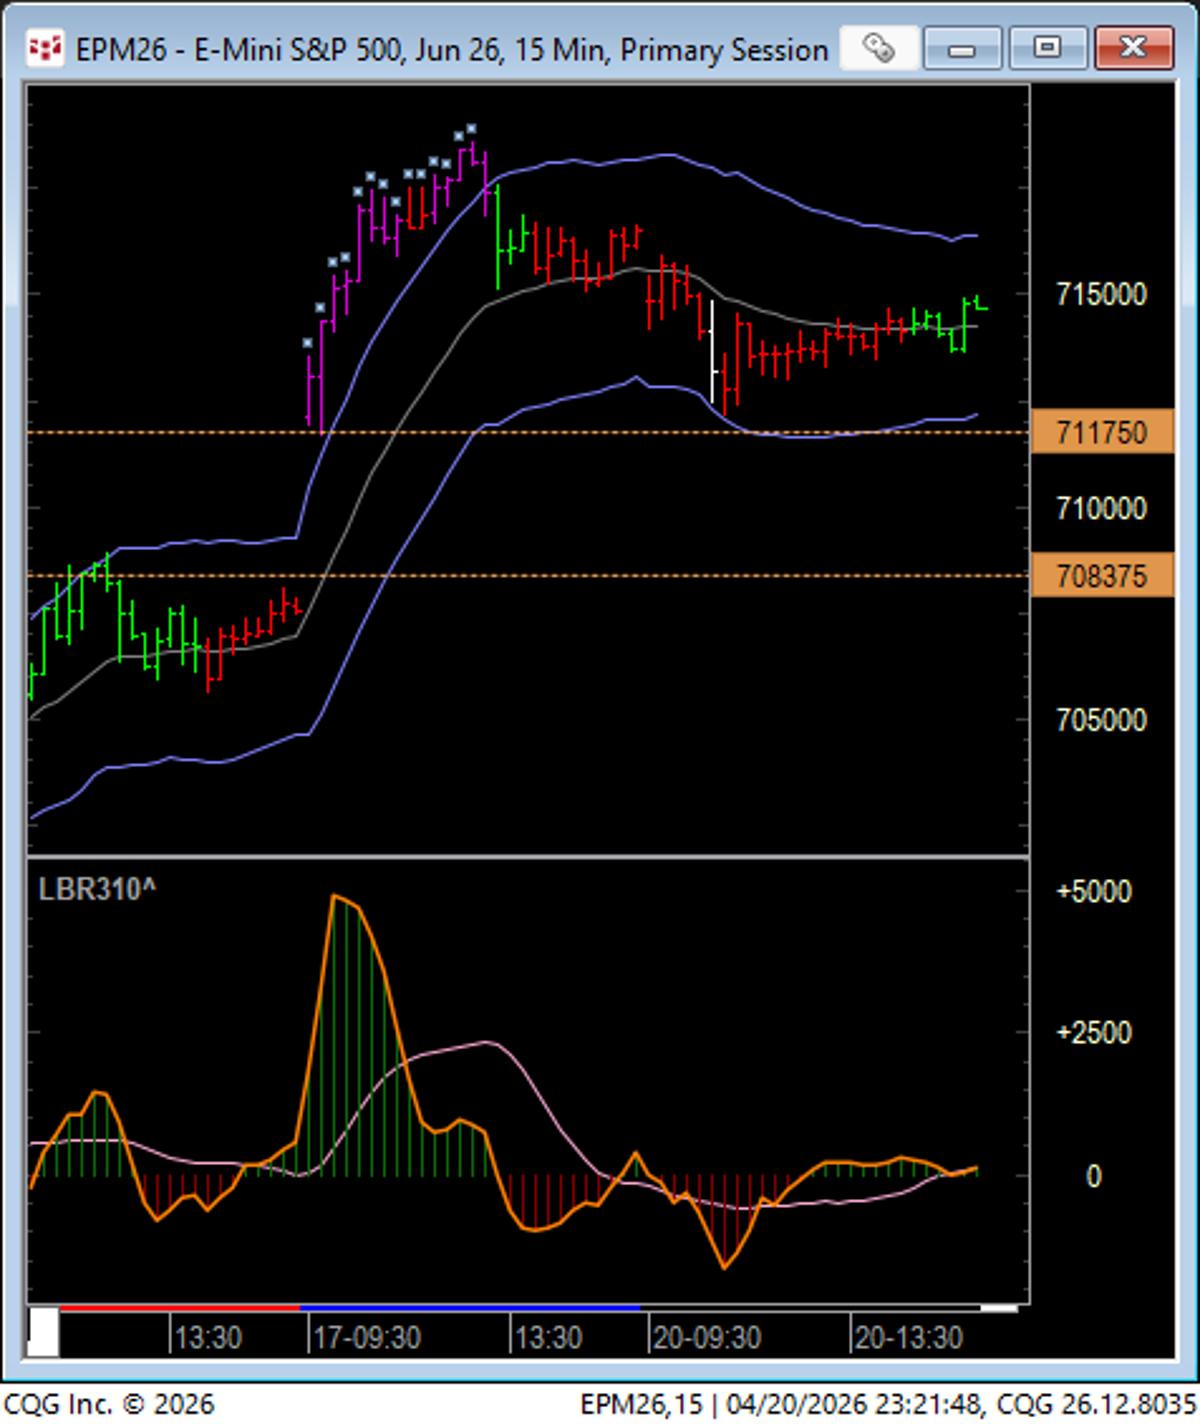
Monitor Unfilled Gaps Below Inside Day Patterns
watch the unfilled gap areas if the indexes look below their Inside Day patterns, (often a mini breakout mode). https://t.co/h1r5xigic9
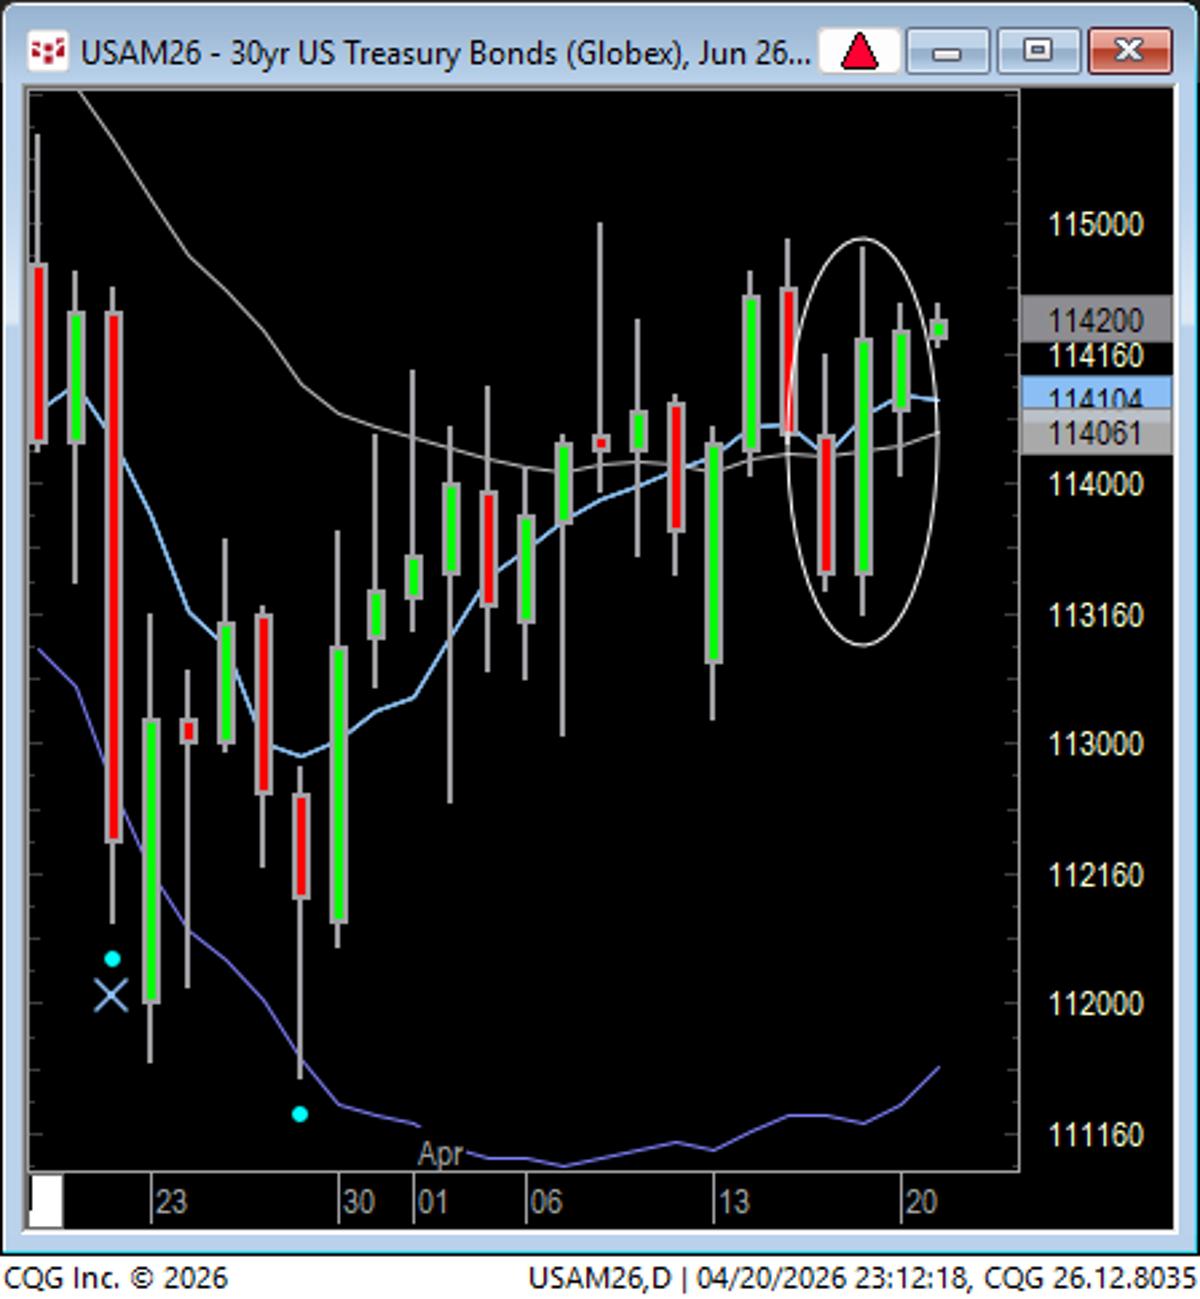
OD/ID Pattern Drives Strong Bond Breakouts At
Bonds: OD/ID...often a powerful breakout pattern. (ideally at the bottom or top of a swing, though). Let's see..... https://t.co/GsMqqNvTKb
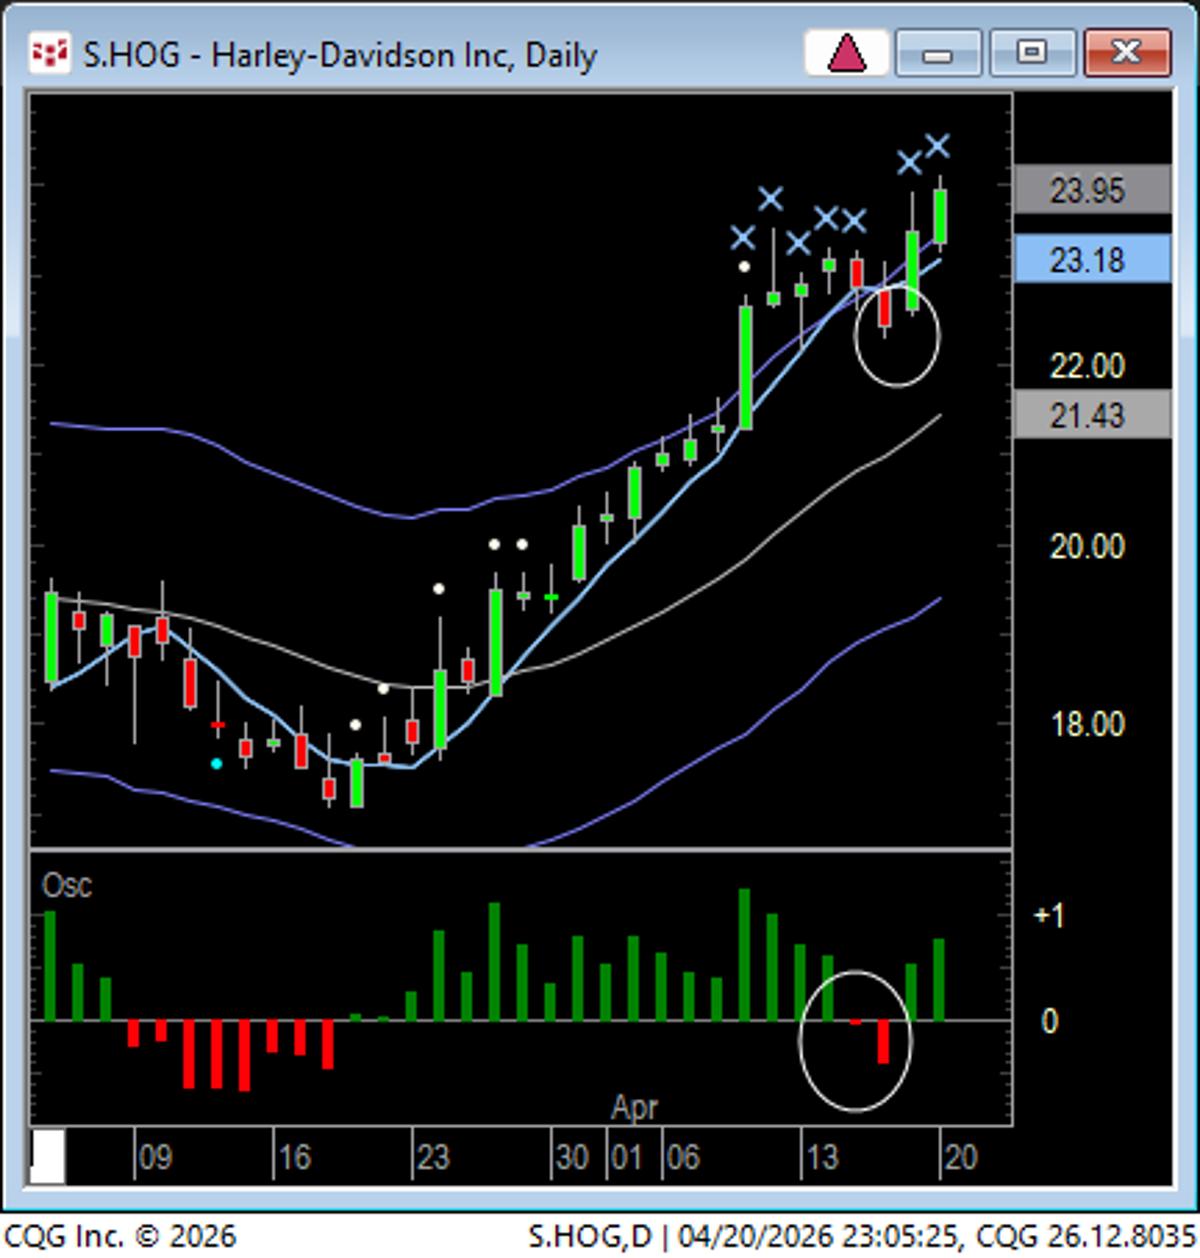
Few New Plays
Not so many interesting new plays for tomorrow, IDs on the indexes. This was a textbook 5 SMA buy on HOG (now played out). Micron has one tomorrow. https://t.co/OjLQ6T4gKY
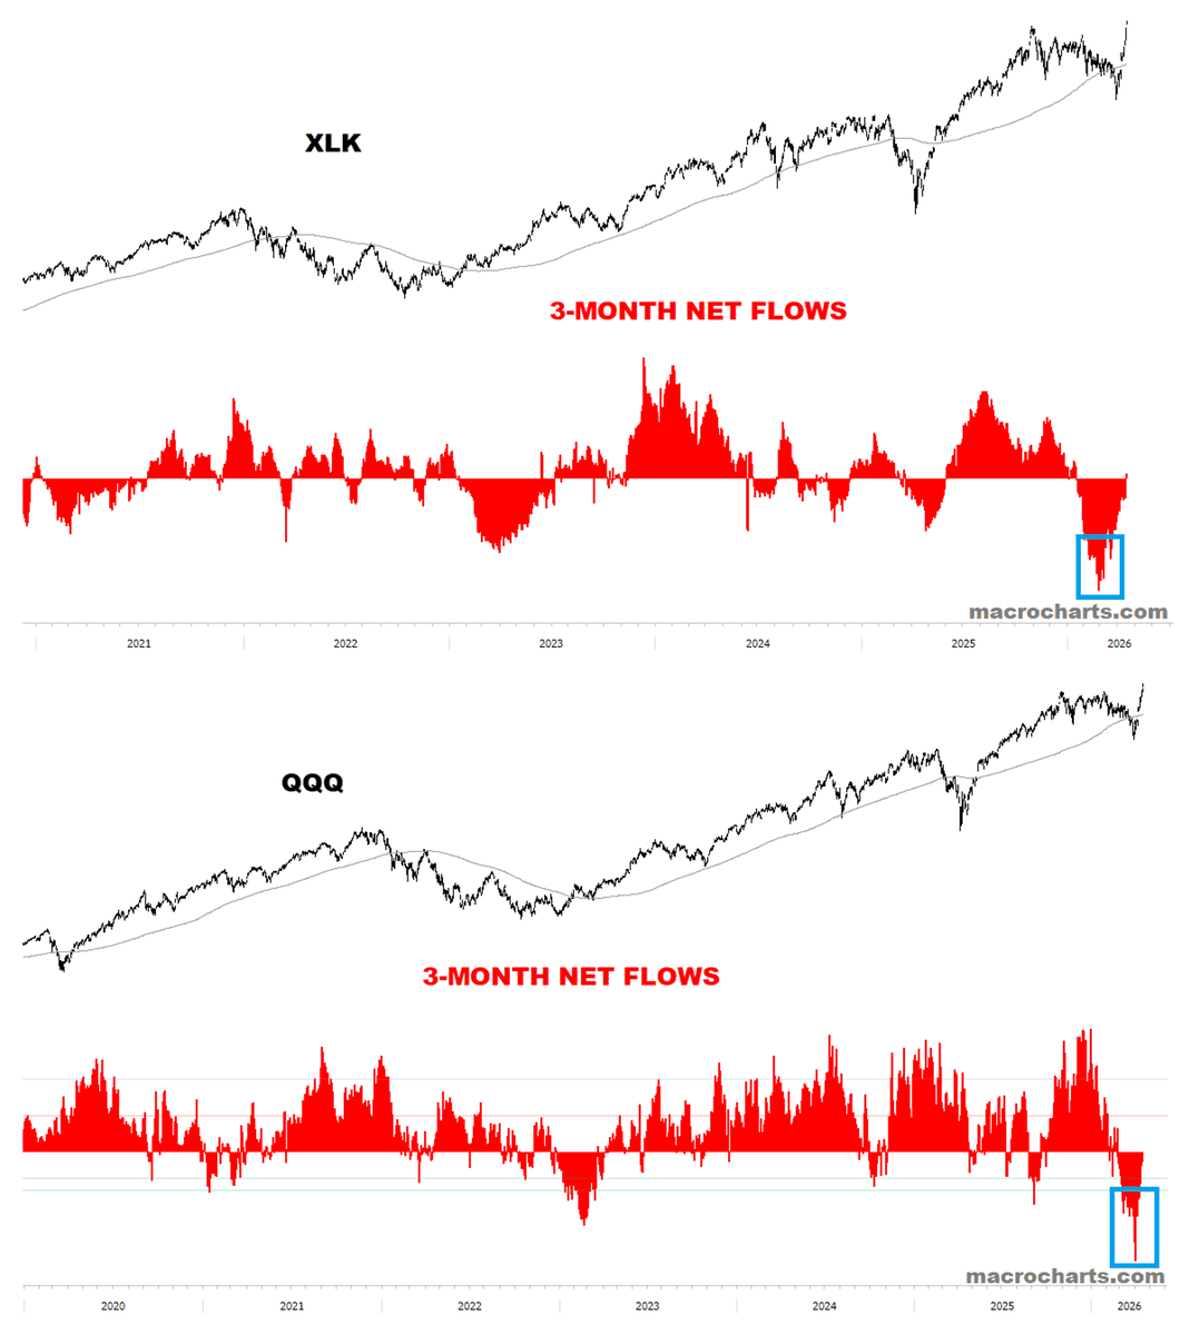
Investors Prematurely Swapped Tech for Staples at 25x
Another great report from @MacroCharts, but this one stood out. Five weeks ago investors were dumping tech to buy staples at 25x. Whoops. https://t.co/kHSzcGfSN2
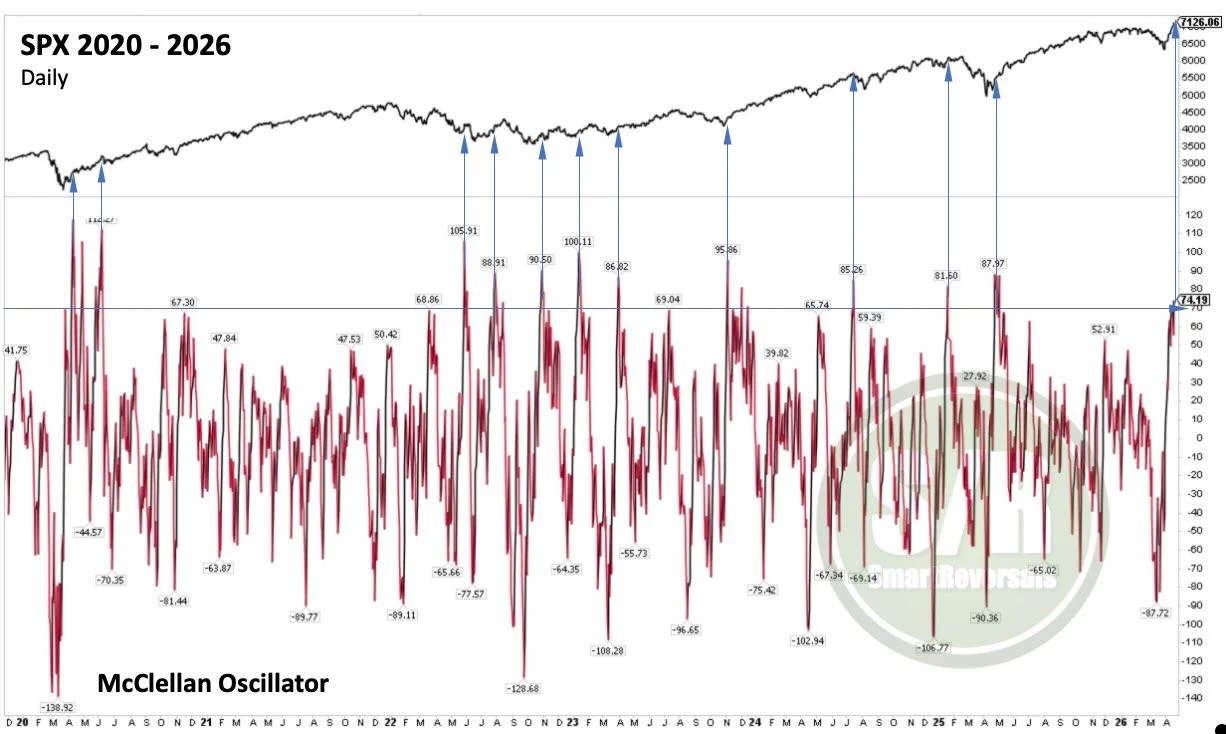
Overbought McClellan Signals Short-Term Pullback Ahead
SPX: Overbought McClellan Oscillator +70 following a market bounce signals a short-term consolidation before the bullish continuation resumes. When the overbought condition is reached in a mature uptrend, it can precede a major pullback. The current case is a market bounce...
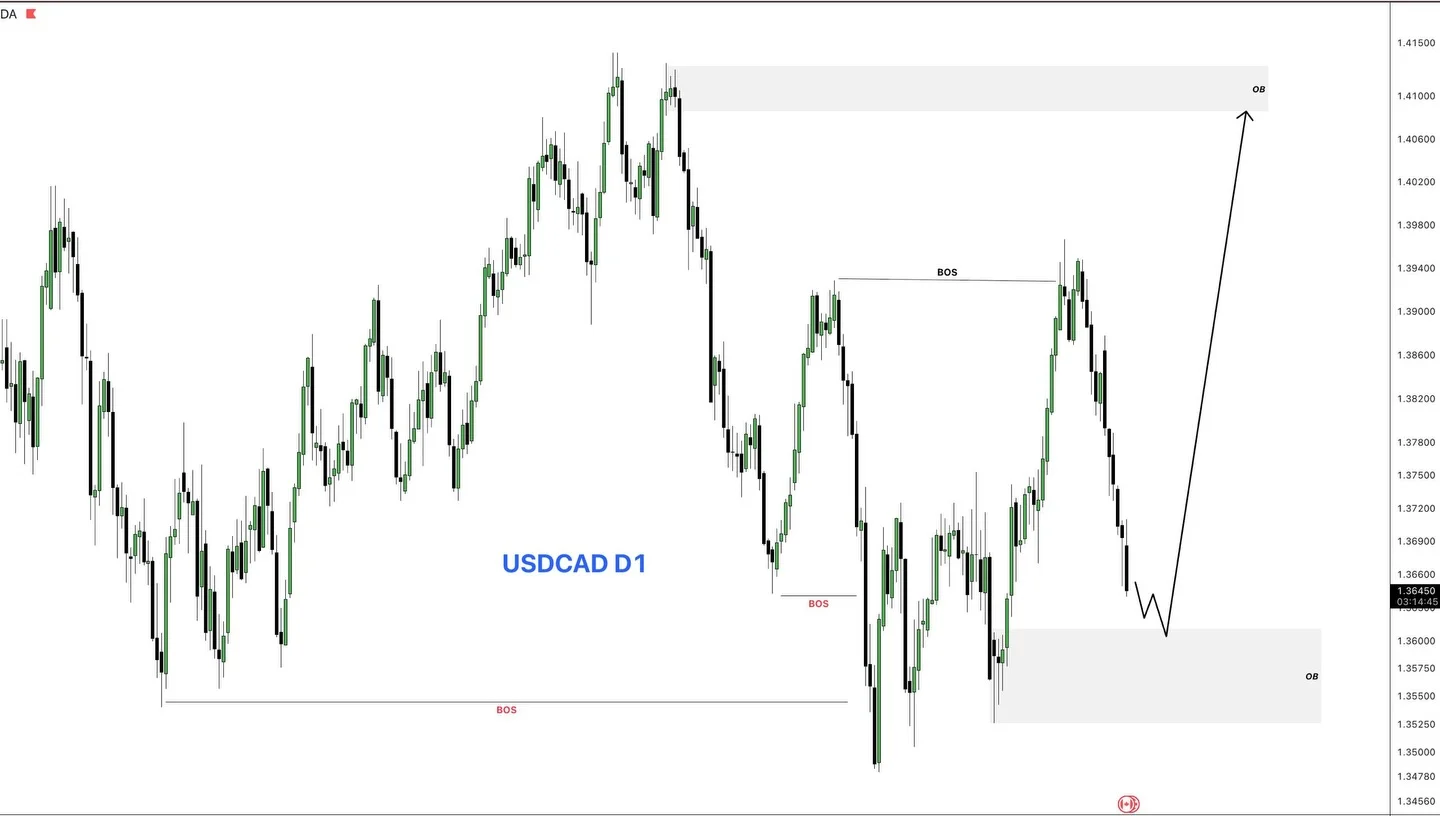
USD Pairs Set for Bullish Swing Trades Tomorrow
📊 Tomorrow’s Plan – USD Pairs 🚀 Guys, tomorrow we will focus on USD pairs for swing opportunities 📈 🔎 Current Outlook: ➡️ USD pairs are showing bullish potential ➡️ USDCAD (D1) is now on our watchlist 👀 🎯 Our Plan: • Wait for price to...
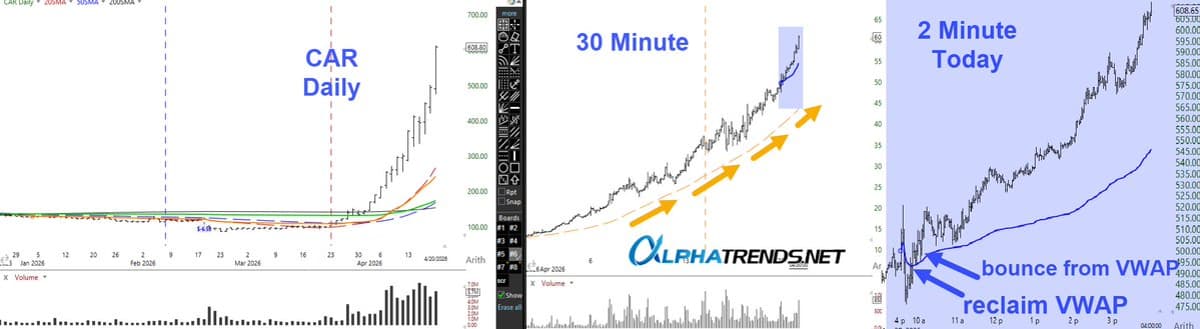
CAR Remains a Perpetual Short‑squeeze; Trade with VWAP
Observations in $CAR ✅there is no such thing as "up too much" if there are still buyers ✅the intermediate term trend is innocent until proven guilty while above the 🟠rising 5sma ✅daytrades should only be taken in the direction of the 🔵daily...
Bulls Need Miracle to Achieve 2,505 Net Advances
Breakaway Momentum Watch: Will now take a miracle -- 2550 net advances tomorrow (i. e. no more than 150 declines). But the bulls do have that Whaley Price Thrust working for them...

Onto's Rigaku Stake Raises Valuation Risk, Trim Suggested
Onto buys 27% of Rigaku for $710M, bolstering X‑ray/CD‑SAXS tie‑up; strong cash but 105x P/E flags valuation risk. Trading insight: trim ONTO on strength; watch execution. — Viktor Kopylov, PhD, CFA More insights: t.me/si14Kopylov
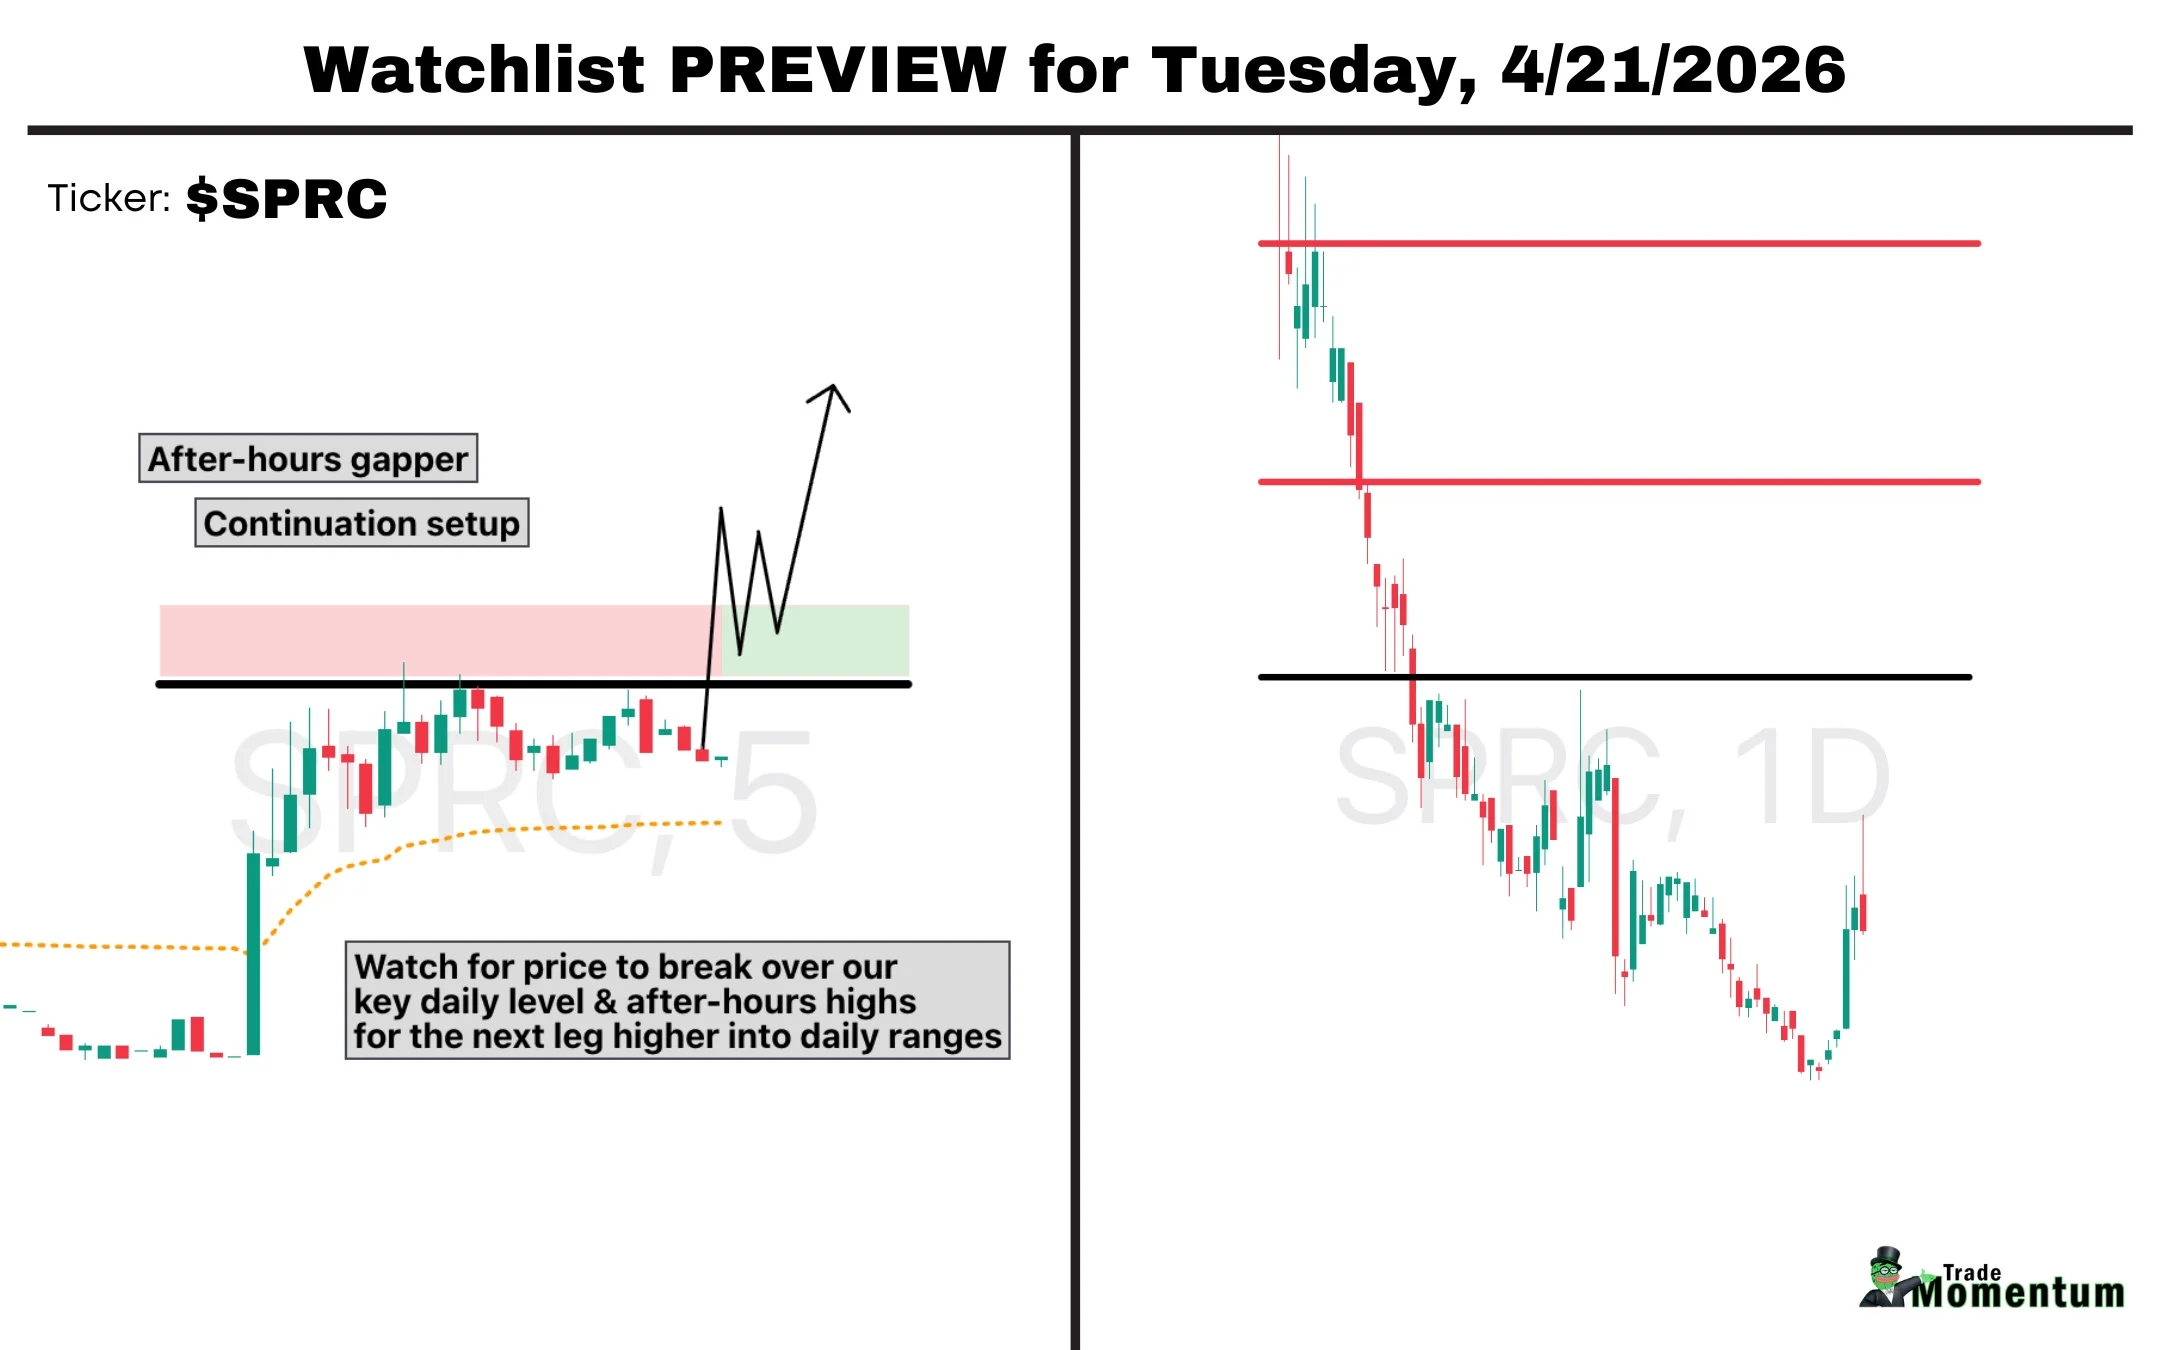
SPRC Surge 21x Volume, Eye $8‑$10 Continuation
$SPRC over 21x relative volume here in after-hours, and if this holds up overnight, I'll be watching it for continuation opportunities tomorrow on the simple S/D flip over highs. Range to $8/$10+
AI Fuels Rally; VRP Vanished, Options Now Pricey
@WarrenPies on debasement, AI = stock tailwind + VRP gone, single stock options rich after the recent record rally https://t.co/HQ57lAcHbm
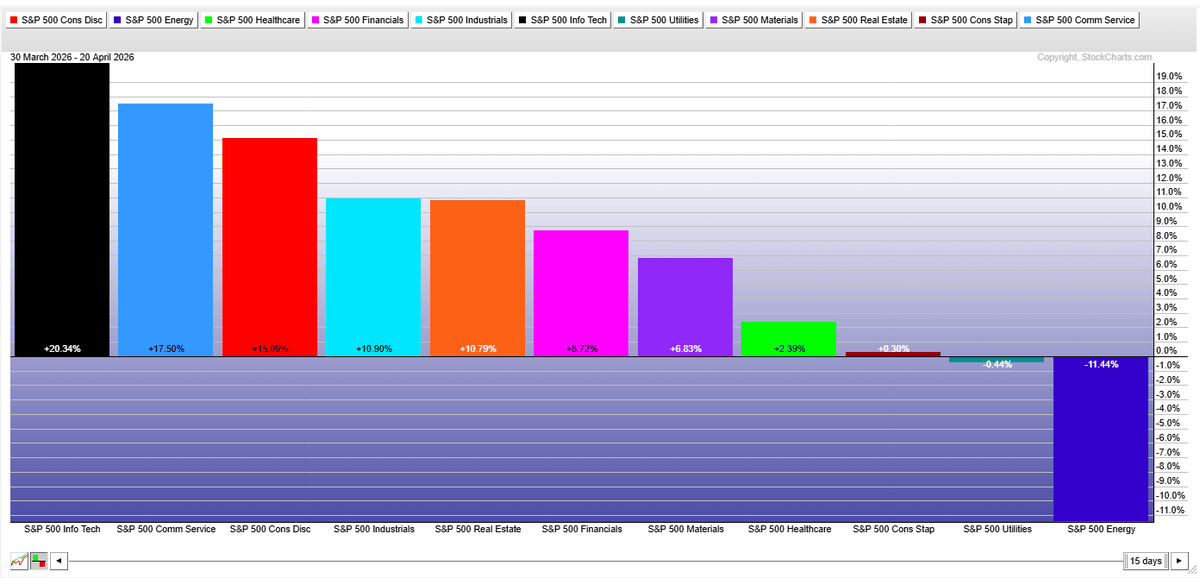
Tech Leads Sector Rotation, Reviving Equity Momentum
"While there was some handwringing about weak breadth over the weekend, it’s important to note that sector rotation has played a starring role in the recent equity drama. Tech stocks have sprung back to life..." More from me on @stockcharts $SPY...
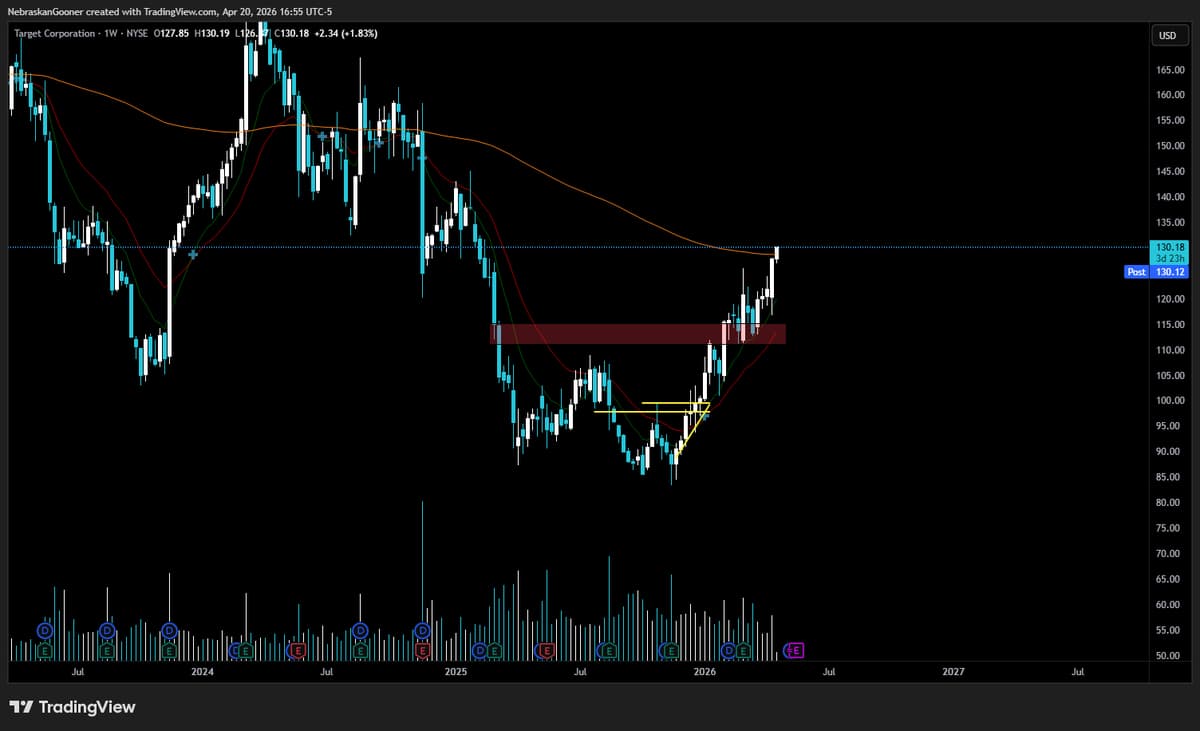
Target Back Above 99‑week SMA, First in Two Years
$TGT Back above 99smma on weekly for the first time in 2 years. Looks like I should've my sub $100 entry longer whoops https://t.co/AbJHtt8VQF
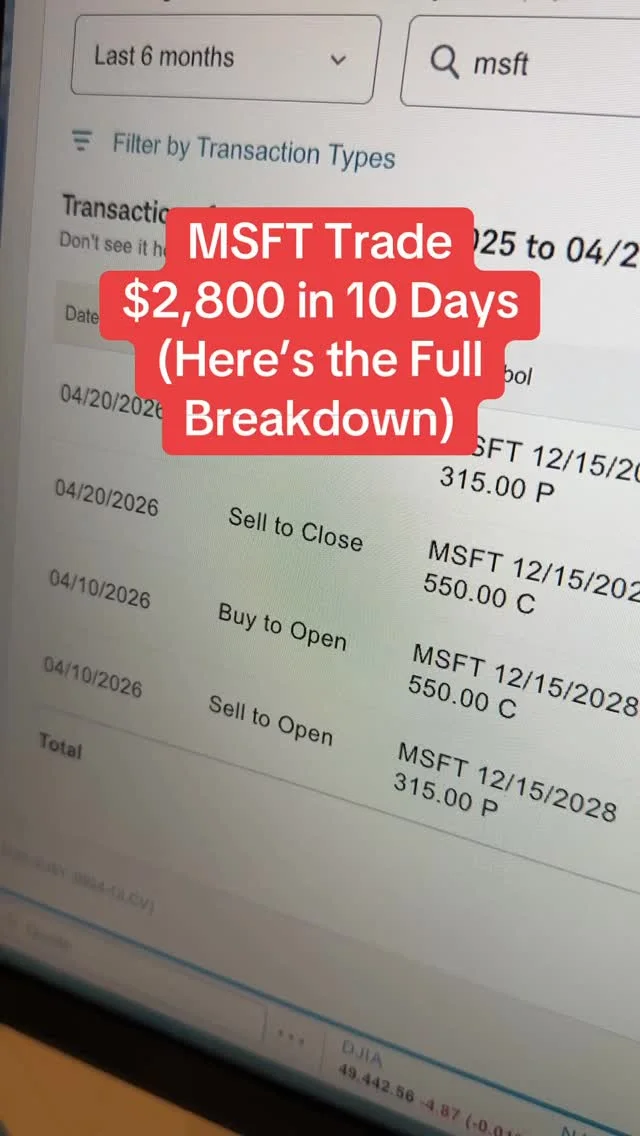
Microsoft Trade Nets $2,800 Profit
MSFT Trade $2,800 in 10 Days (Here’s the Full Breakdown) #optionstrading #tradingtips #stockmarket #tradingstrategy #msft
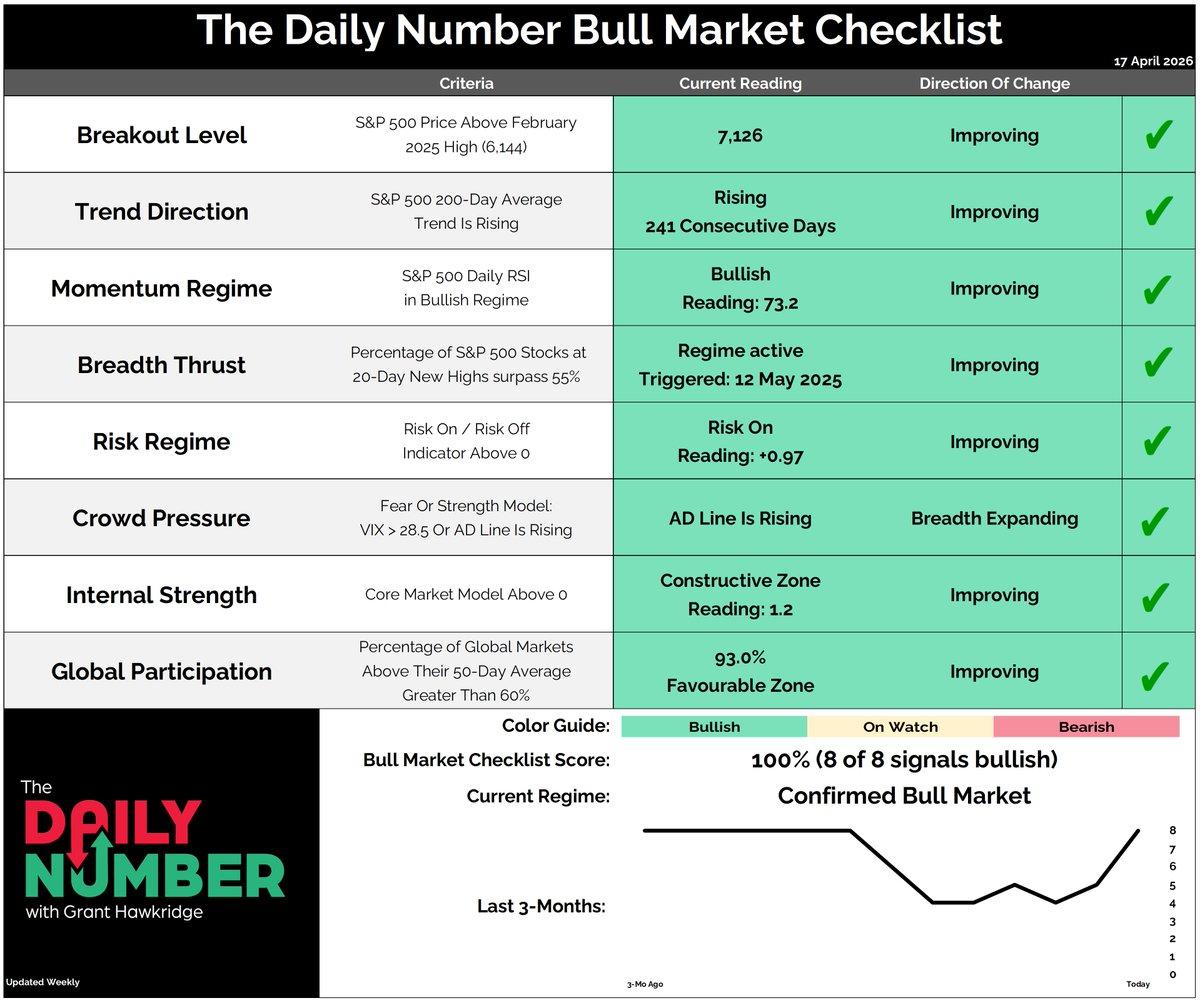
All Eight Signals Confirm Bull Market Resurgence
🟢 8 of 8 Bullish 🟢 Regime: Confirmed Bull Market After a few weeks of caution, 8 of 8 signals say we’re back in go mode. Price back at all-time highs. Momentum flipped back to bullish. Internals, breadth, and risk appetite all improved together. This is...

Oil Rebounds as Material Momentum Drives Targets and Exits
Oil is on the rebound but so are pockets of momentum. We’re still seeing strength show up in materials, hitting targets and raising exits while new setups continue to trigger. Today's momentum report: https://t.co/4SRJUfV3YA
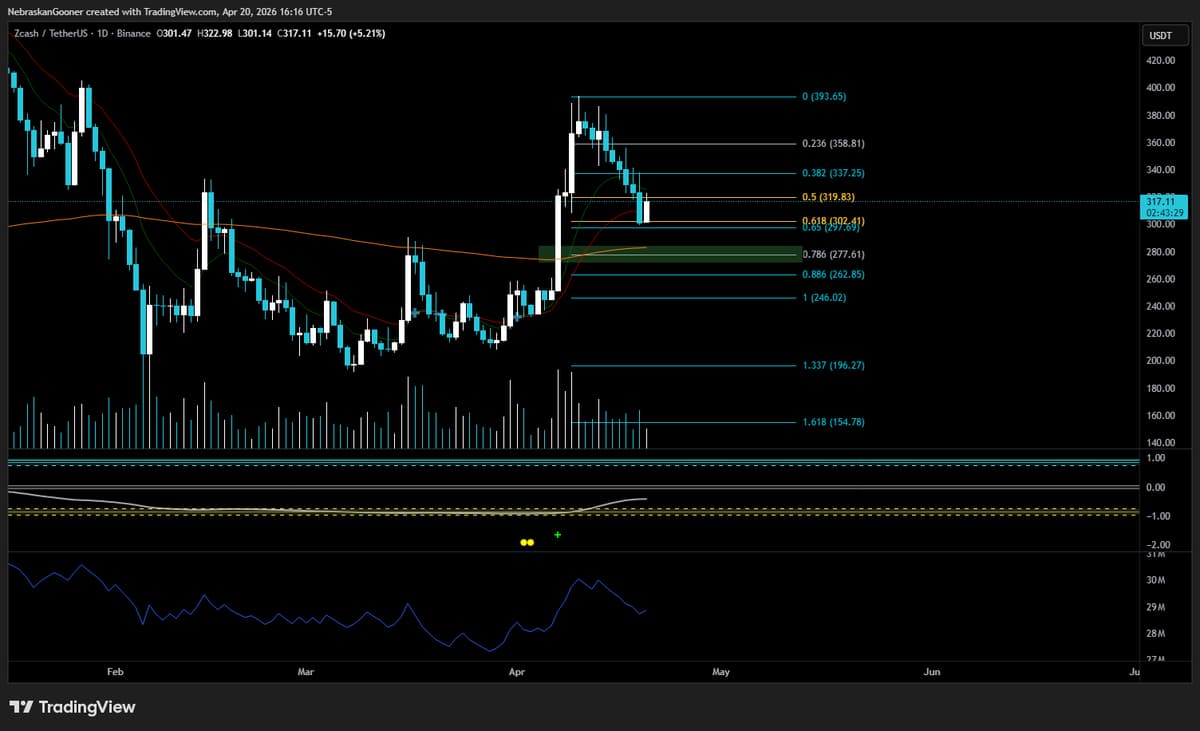
ZEC Drops; 0.786 Fib Support Key
$ZEC Dropping after the "buy approaching" alert from Top Goon X Buy zone per TG X rules is the 0.786 fib if it holds as support. https://t.co/TSK5lYPFux
Gap‑filling Myth Debunked: Not All Gaps Close
"As a reminder, gaps are measured by the period’s closing price and the subsequent period’s opening price. The thinking is that there’s unfinished business on the chart. In Japan, they say there’s an open window that must be closed. In Western...

FTSE250 Faces Minor Dip Amid Strong Bullish EMAs
#FTSE250 small Down Candle. Resistance 23231, 23844. Support 22627, 22000, 21373. RSI 63 not high. 13/21 day EMAs Bullish. Top Bollinger Band 23402. Midpoint Line 22500. Bottom Band 21645.
S&P Short‑Range Oscillator Hits Extreme Overbought Level
Neither overboughts/oversolds nor sentiment/surveys are good clocks... but they are (especially in the extreme) a good weather forecast .. S&P Short Range Oscillator at close stands at 7.61% - very overbought. @SquawkCNBC @andrewrsorkin @BeckyQuick @CNBCFastMoney @HalftimeReport @carlquintanilla @ScottWapnerCNBC @SullyCNBC @saraeisen @tomkeene...
Dow Shows Bullish Bias Near Resistance, Strong Support
#DOW doji Candle. Resistance ATH 50512. Support 48788, 48000, 46978. RSI 64 not high. 13/21 day EMAs Bullish. Top Bollinger Band 49914. Midpoint Line 48338. Bottom Band 46762.
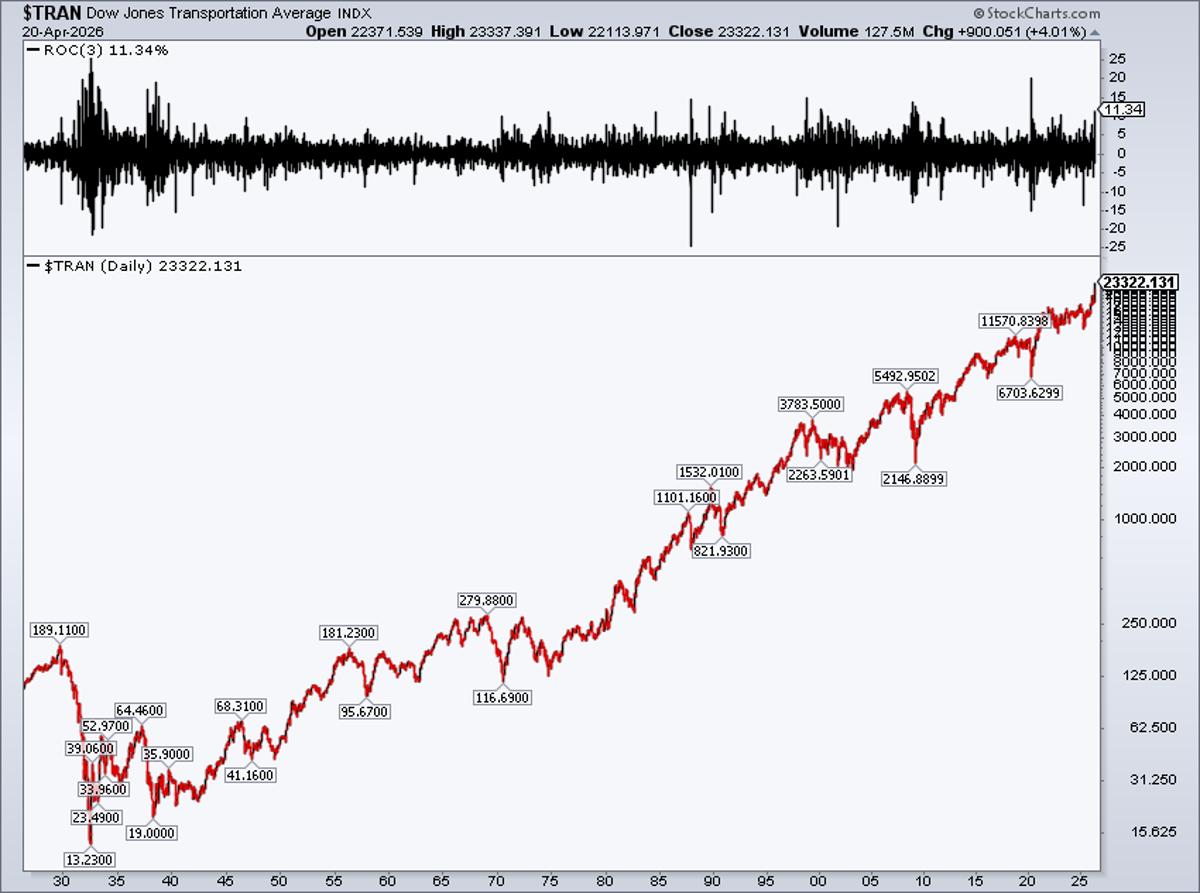
Dow Surges 11.3% in Three Days, Biggest Rally Since 1930s
Dow Transports +11.3% last 3 days.. best rally since COVID...among the biggest jumps back to the 1930s @stockcharts https://t.co/Ng9Zzel9yw
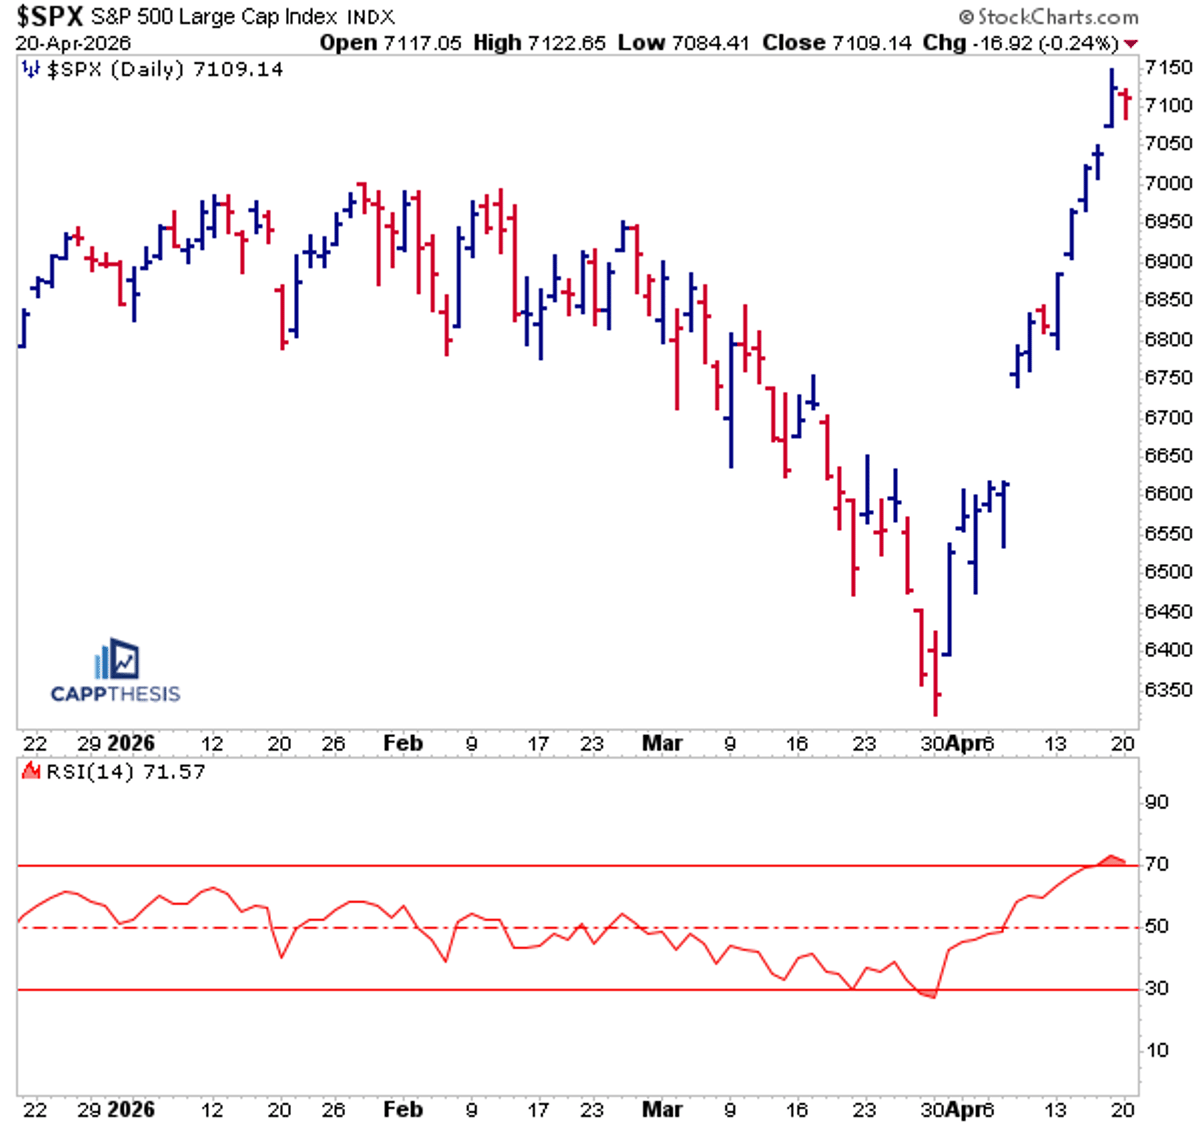
S&P 500 Stalls, Over
$SPX - Fails to make a higher high for the first time in 9 days. Finishes near the top of its intra-day range and remains overbought. Does this show a failure to go up or the inability to go down?...
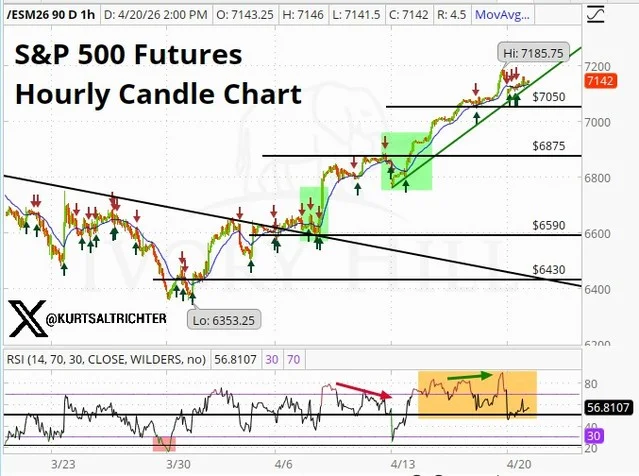
SPX Futures at 7,050: RSI Drop Signals Bearish Warning
SPX Futures sitting on the 7,050 breakout with RSI rolling from 80+ to 56. Bearish Divergence is confirming (warning, not a sell signal).

Added Bullish Call Spreads on FDX
added $FDX May 8 Exp 395/410/420 broken wing call flys, $SKY May 85 calls and $Z May 50 calls
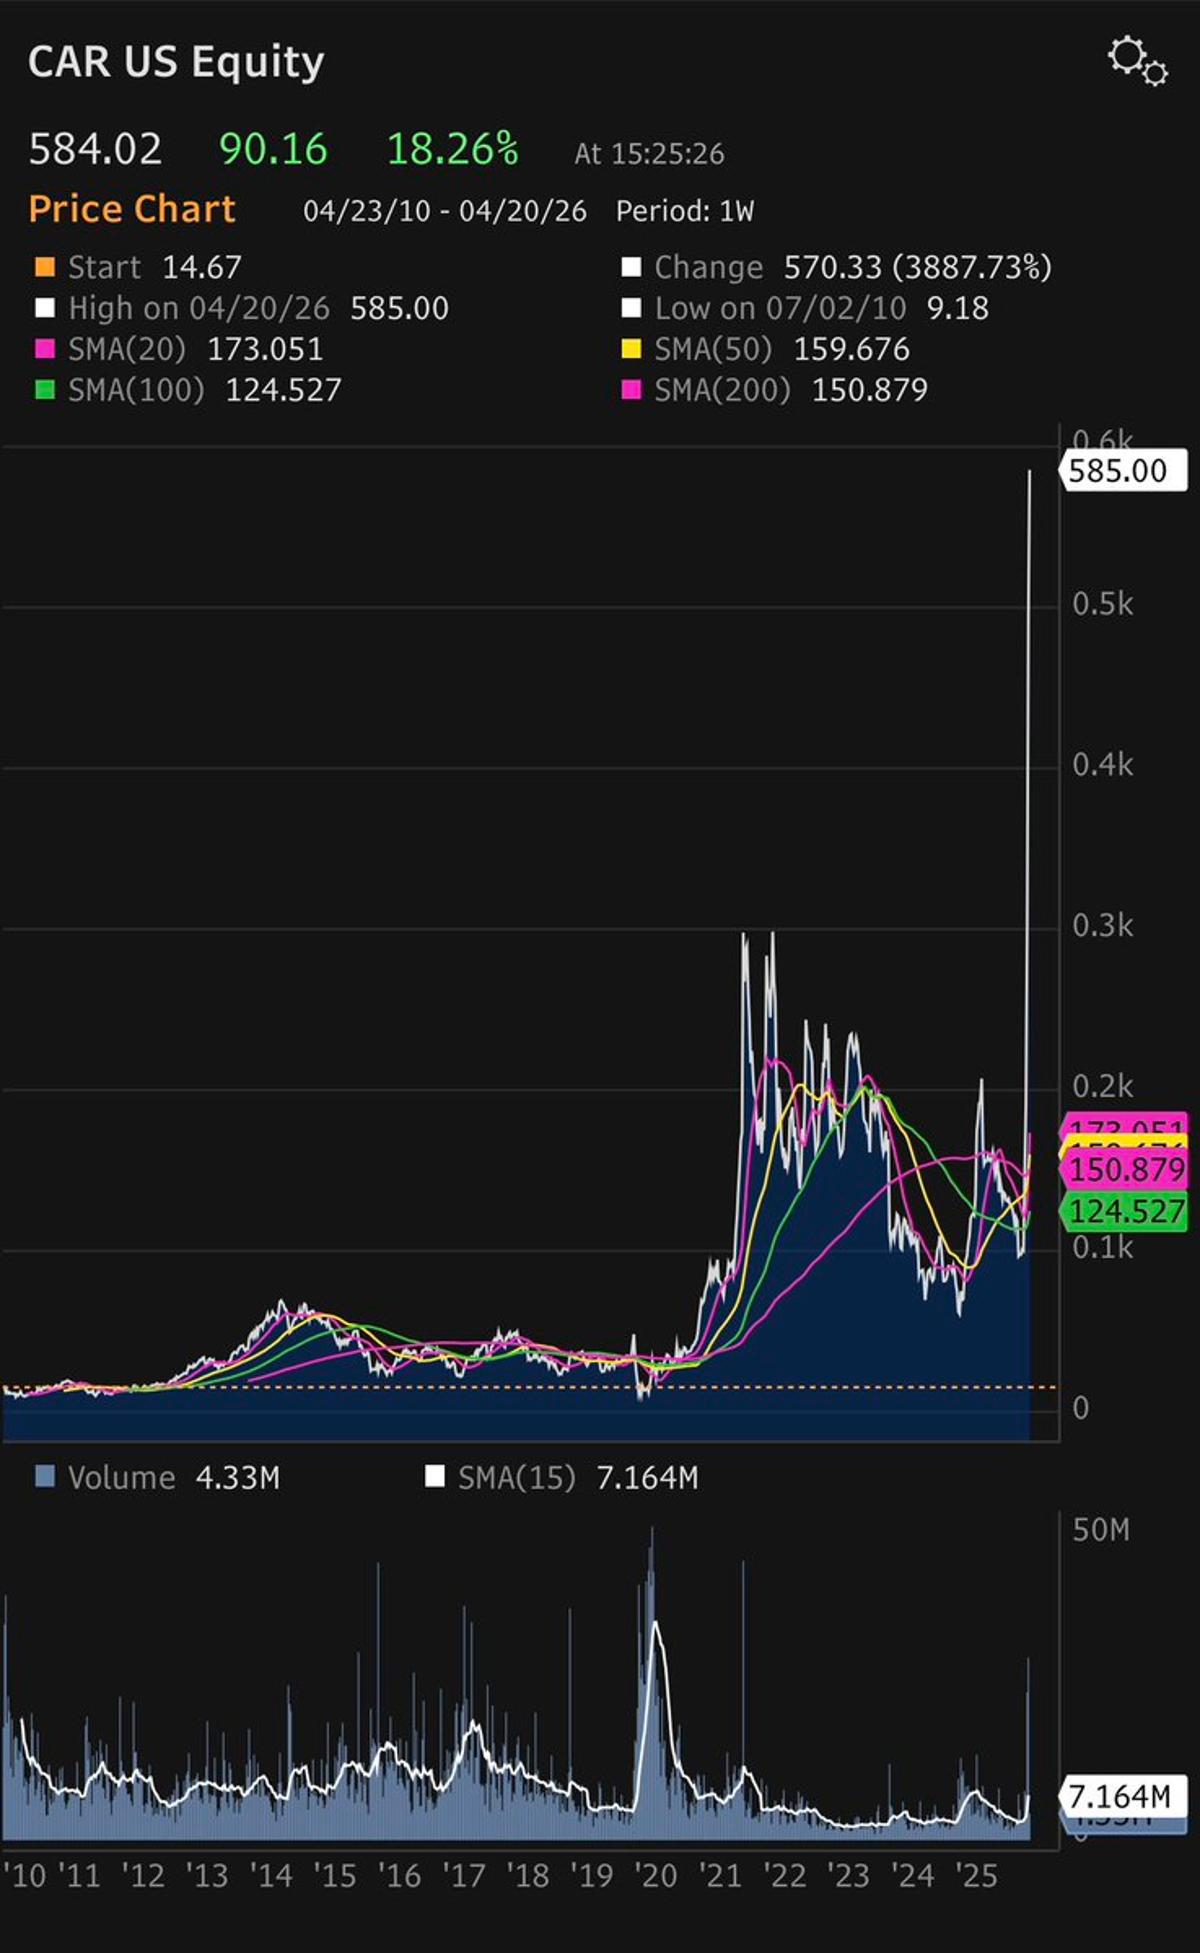
Gamma Squeeze Likely Ends as CAR Meets Demand
Gamma squeezes end when the company fills all the demand. Should be a this week imho. $CAR https://t.co/pqIlOKiO3F
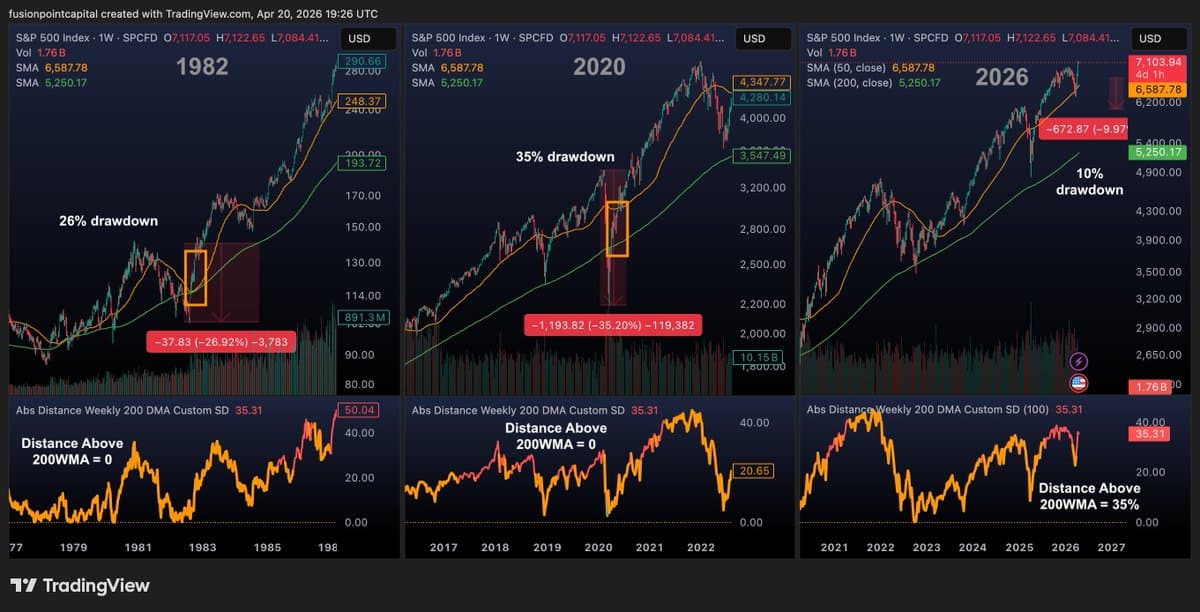
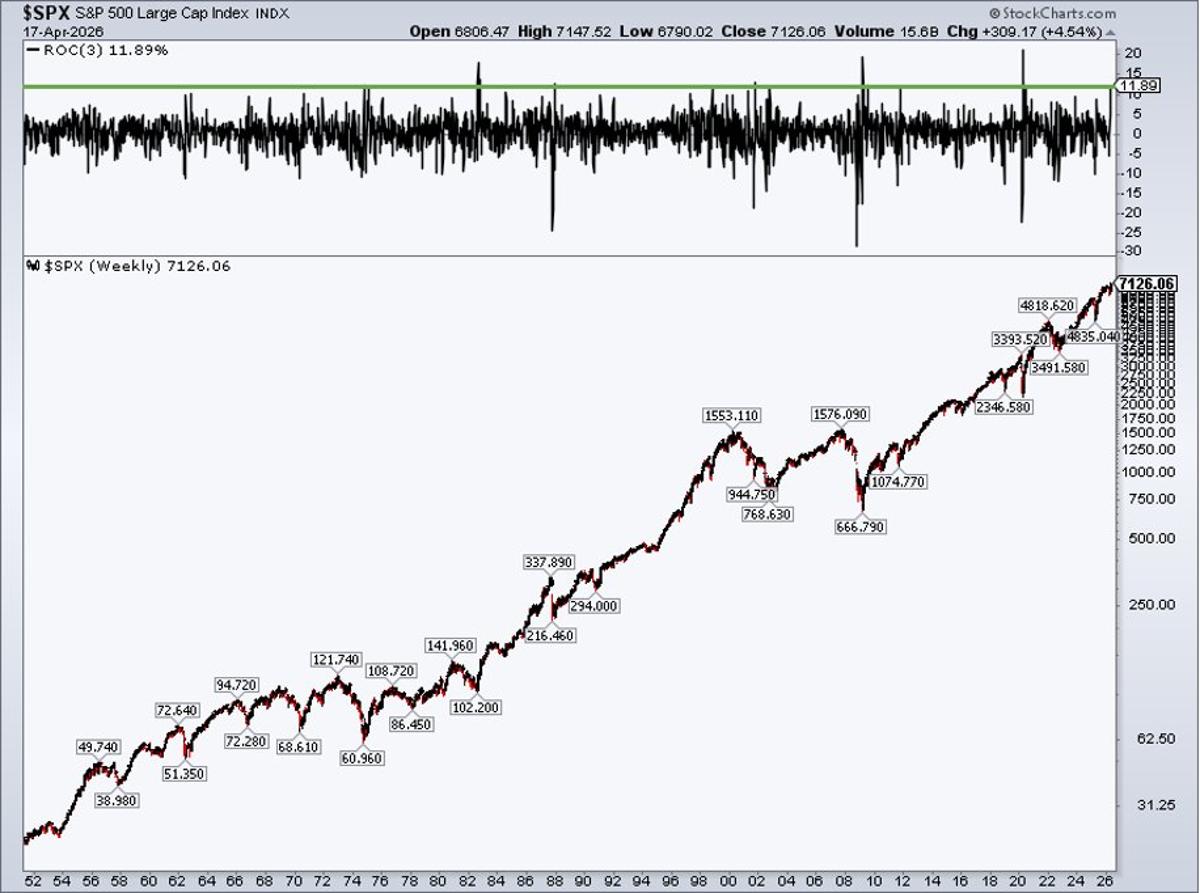
Past 3‑week Spikes Don’t Predict Future 30% Moves
Pomp/others using '82 + '20 as examples of 3 weeks up leading to 30+% moves, obv most don't need to see this to know (and N = 2) but just a very cursory trend/ta only perspective shows how overly simplistic...

Prepared Alerts Turn Market Noise Into Trading Opportunities
There are positions to be taken on both the long/short sides for those who are nimble. I wait for my alerts to sound on names I have already completed homework and have my plan ready. Some alerts will never...
QQQ Still Sweet Spot, Requires Extended Unwinding
$QQQ daily still in the sweet spot but needs more unwinding. Likely take many days. Unwinding is what we need if holding longs.
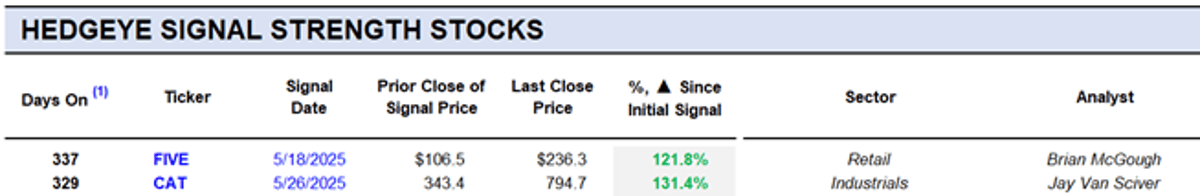
Continuing Strong Momentum in $FIVE and $CAT
Signal Strength Stocks (now with daily updates) Still riding High Fiver $FIVE and The Big $CAT https://t.co/3zlIG6VKfp
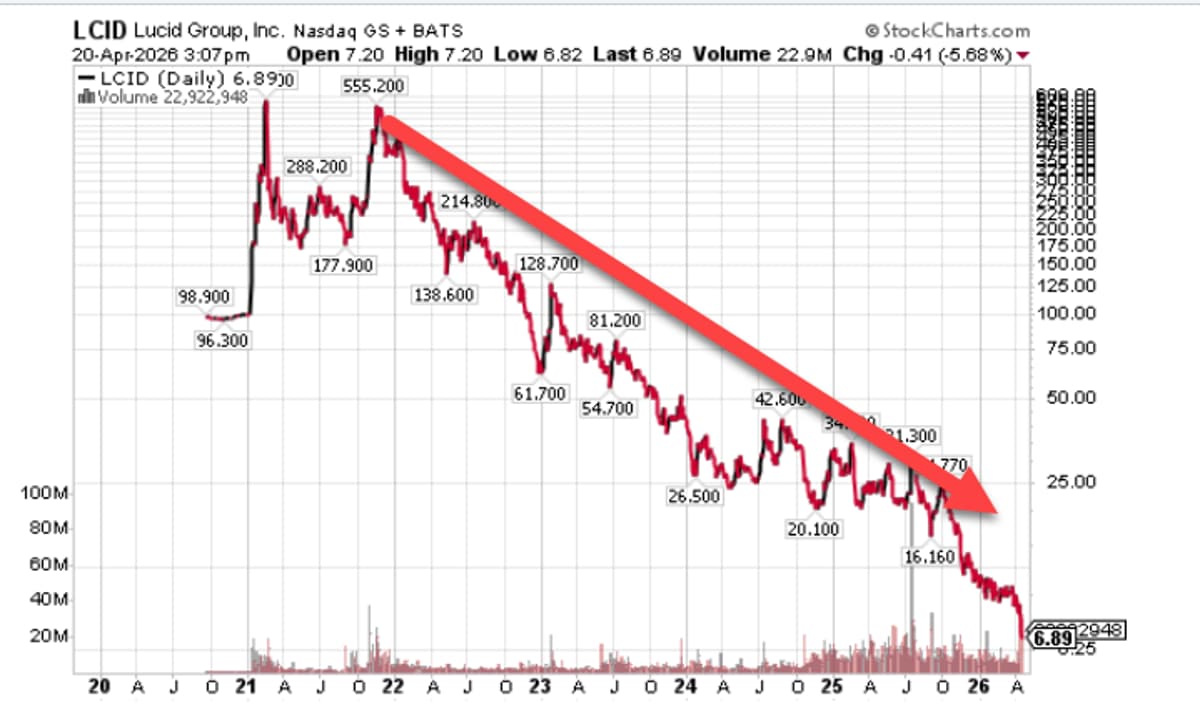
Retail Investors Missed Lucid Crash; $LCID Plummets to $7
It's a good thing CNBC-type "Retail Investors" weren't chasing Lucid $LCID at $555 It just broke $7 and remains a SELL @HedgeyeIndstrls https://t.co/bKtUiaG36n

Apple Nudges Higher; Watch for Break Above $273
$AAPL inched up one of the orders on the let it rides others staying the same. Watching for hold or close over 273 to move others.
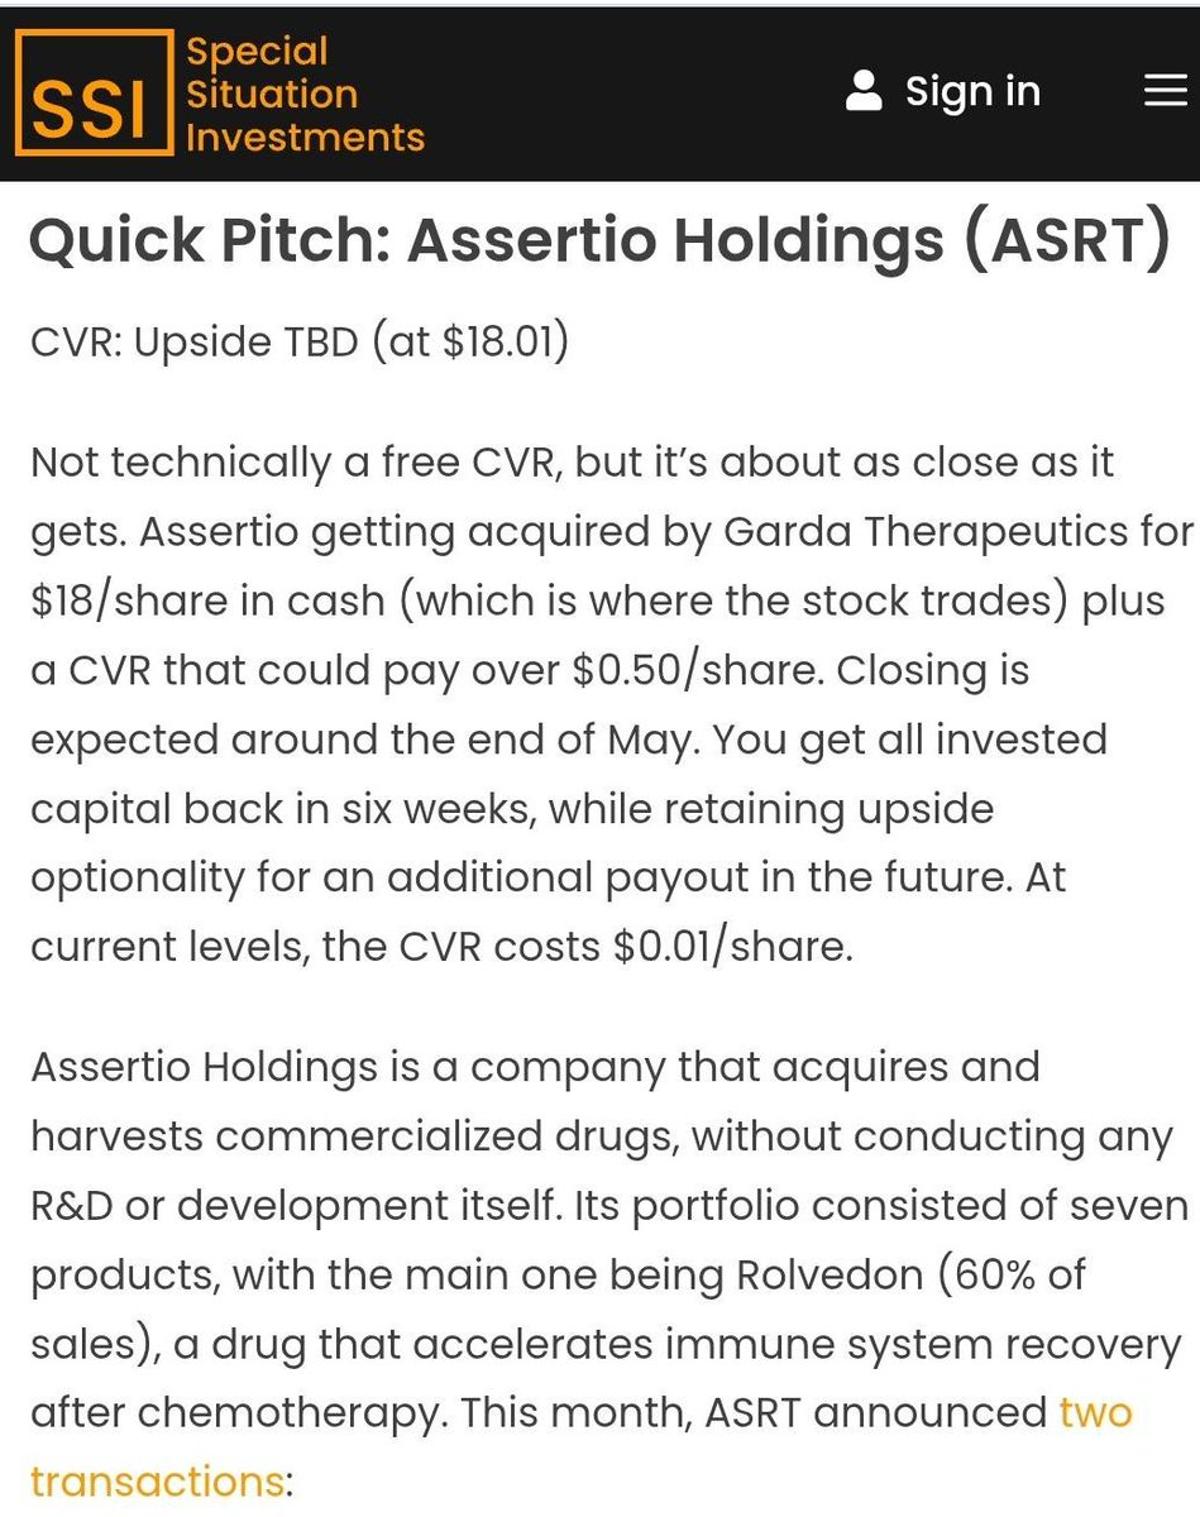
ASRT CVR: 1¢ Entry, 50¢ Potential Return
Another CVR play posted on SSI. $ASRT not technically a free CVR, but about as close as it gets. 1 cent for a 50 cent per share potential payout. Capital back in 5 weeks. Full write-up is in the public domain👇 https://t.co/FCRt9gHyy2
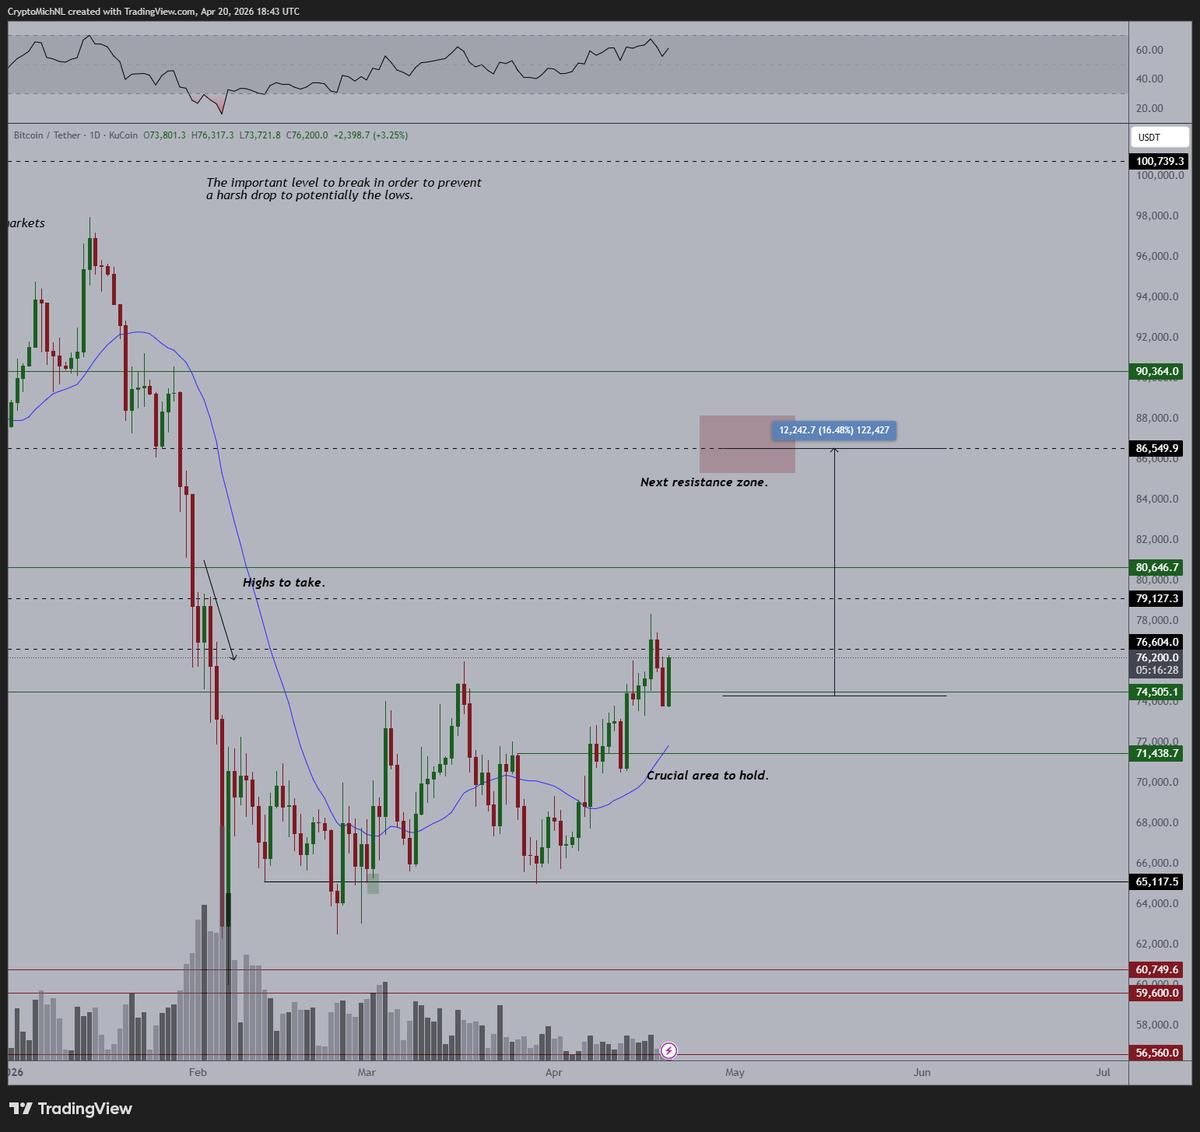
Bitcoin Poised to Break $85K Amid Bullish Inflows
I don't see a reason why markets shouldn't go higher. I've mentioned this before, but the risk-off weekend correction is quite normal for #Bitcoin. It's a Monday, nothing bad has happened, so the risk-on appetite comes back. Great bounce upwards, and lower...
HPE Breakout: Holding Position From Lower Levels
$HPE on breakout. I do own this in my investment/spec/gamble account from much lower levels
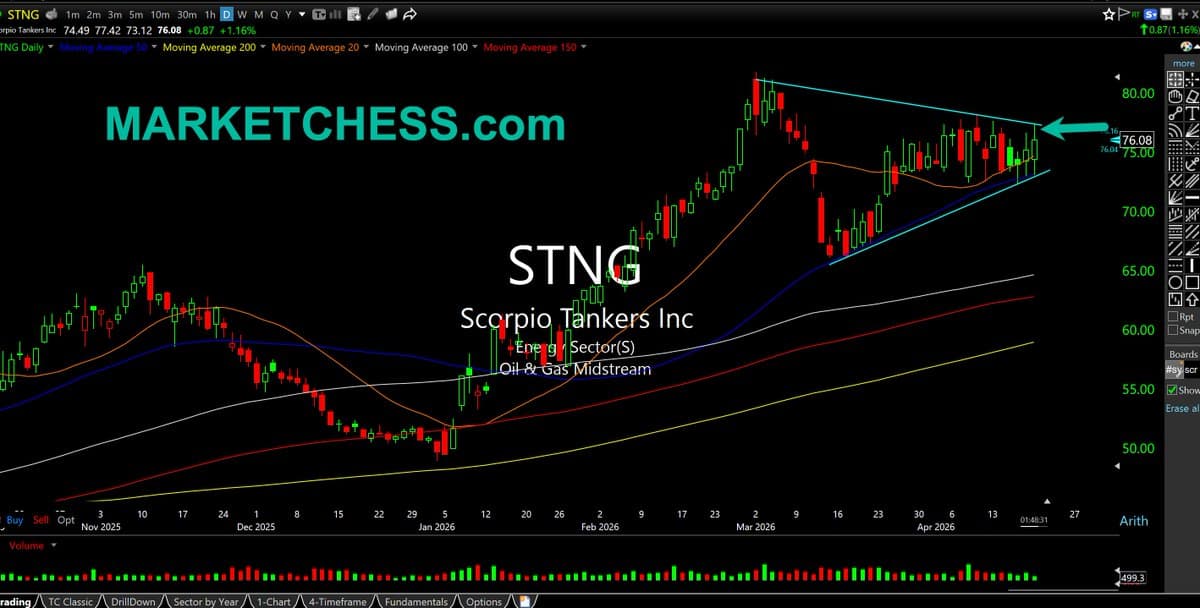
Scorpio-Like Tankers Consolidate, Poised for Breakout
$STNG Daily. Following up on oil tankers: Most look like Scorpio, consolidating well since the start of Iran War. Narrowing in context of overall uptrend. On watch for another breakout https://t.co/zR6437t3A5