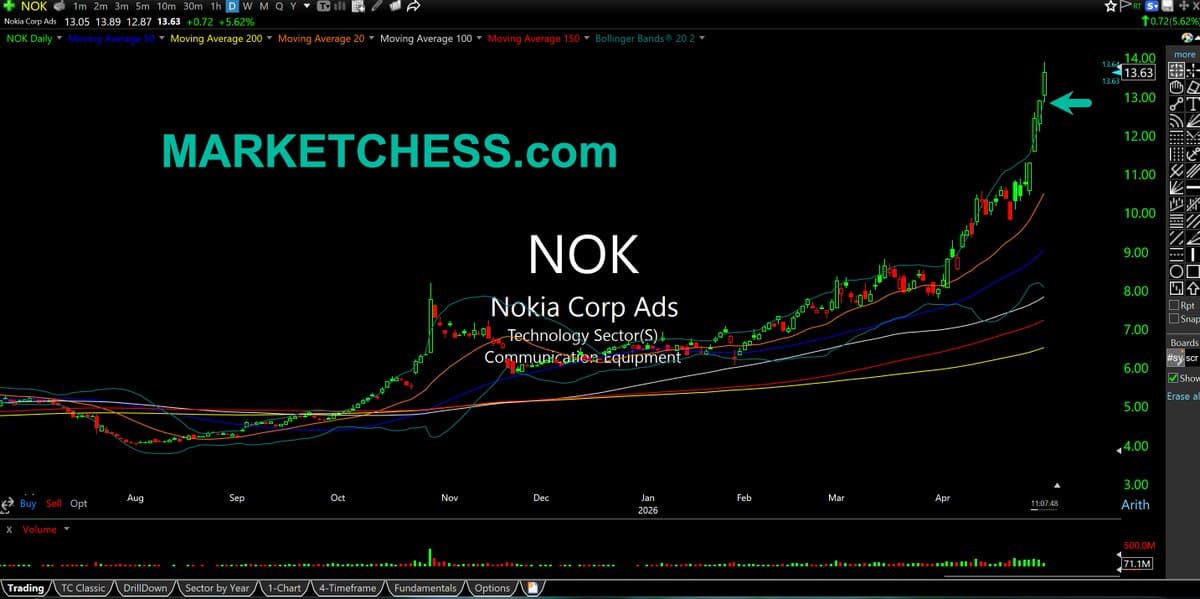
Nokia Stock Surges Above Bollinger Band, Overbought
$NOK Daily. Dot-com era relics going vertical now. Nokia's daily candle free & clear outside upper Bollinger Band, indicative of wildly overbought conditions. https://t.co/taDWQc0jkY
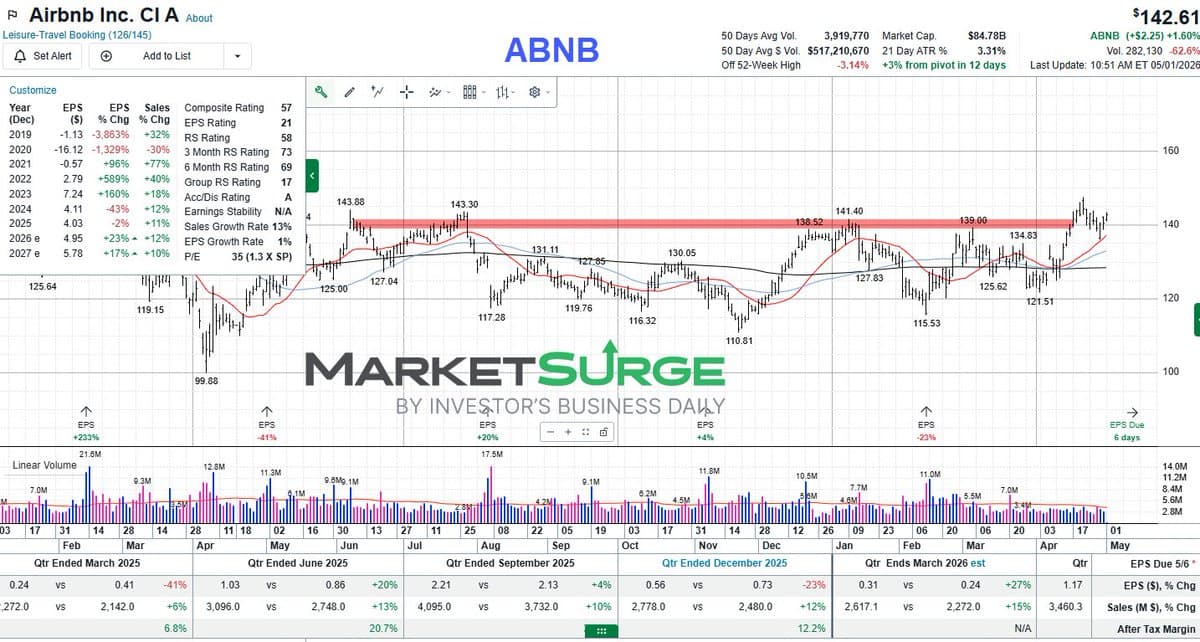
Airbnb Breaks Resistance, Pulls Back to Strong SMA
Earnings due 5/6 for $ABNB the stock broke resistance and then pulled back to the rising 🔴20sma which is above the 50 and 200 sma. I do not plan on holding thru earnings, do what is right for you chart from @marketsurge...
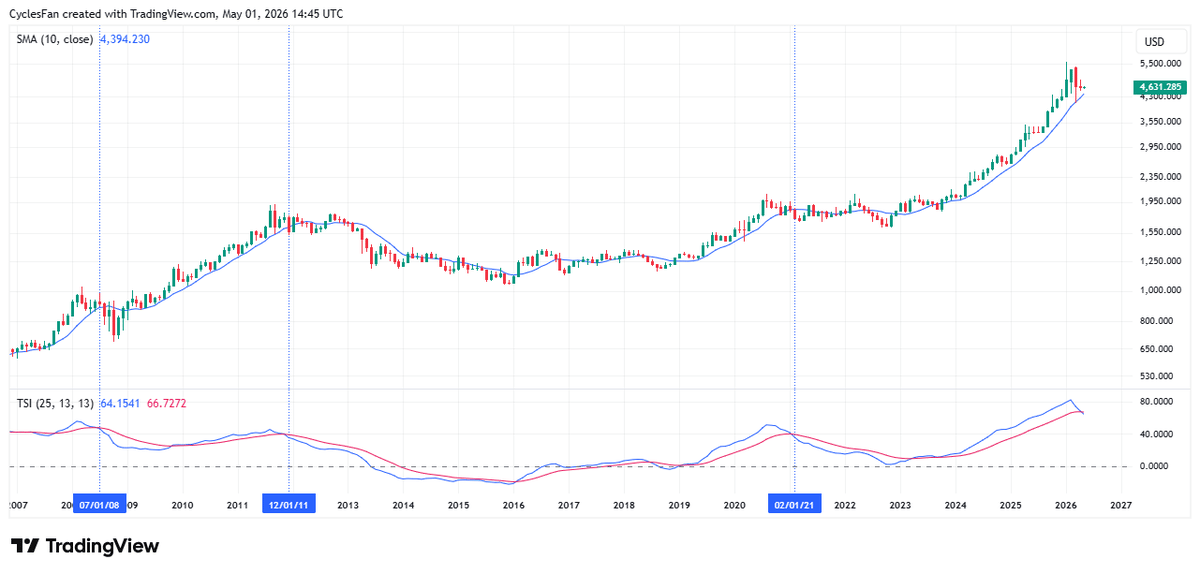
Gold's TSI Bearish Crossover Signals Potential Top
$Gold - Major warning sign: the TSI has a bearish crossover as it had in 2008, 2011 and 2021, but it's a monthly chart so the crossover has to remain intact at the end of May to be valid. The...
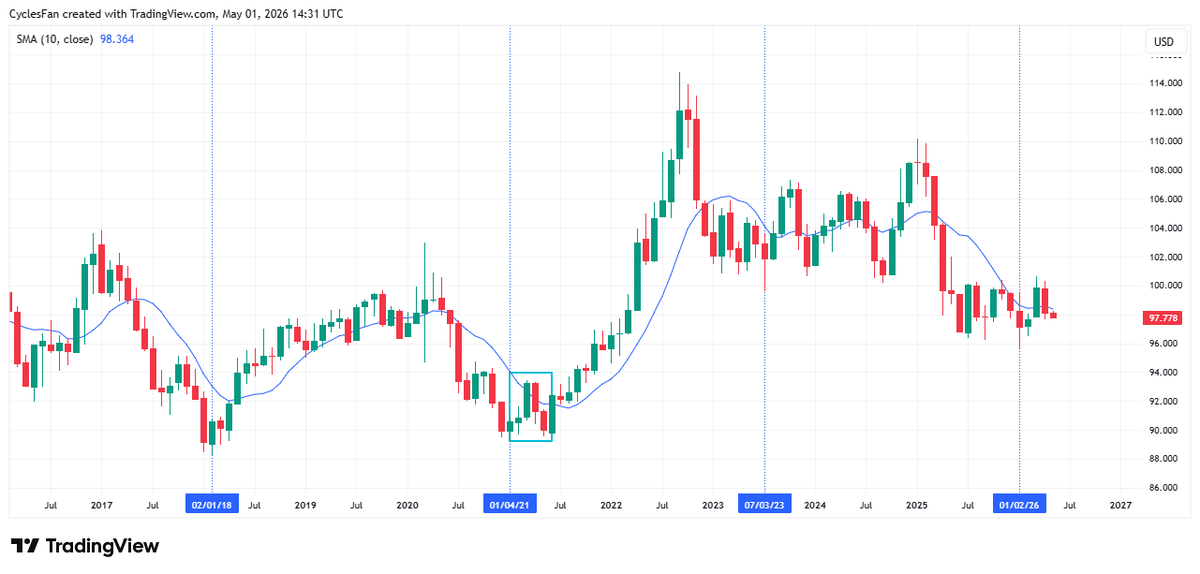
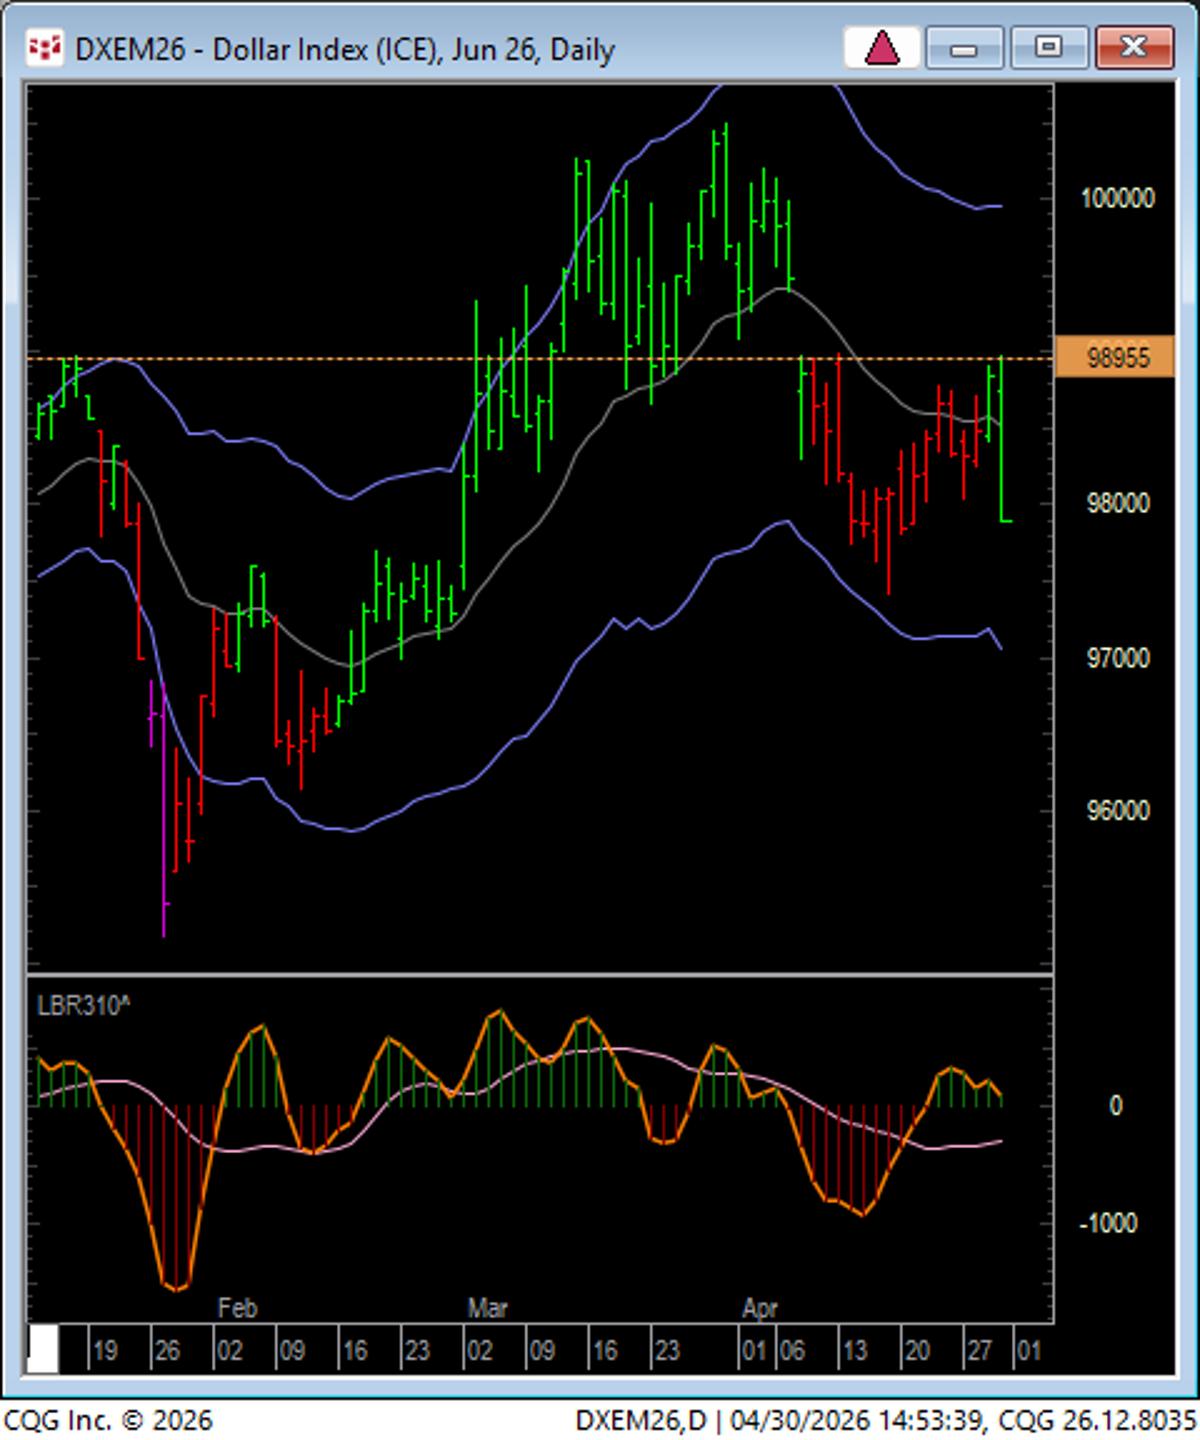
DXY Hits 3‑year Low, May Slip to 96
$DXY monthly - Made a 3 year cycle low in January. The action this year has been similar to 2021 when it rallied into March but retested the low in May. At the moment it looks like May will be...
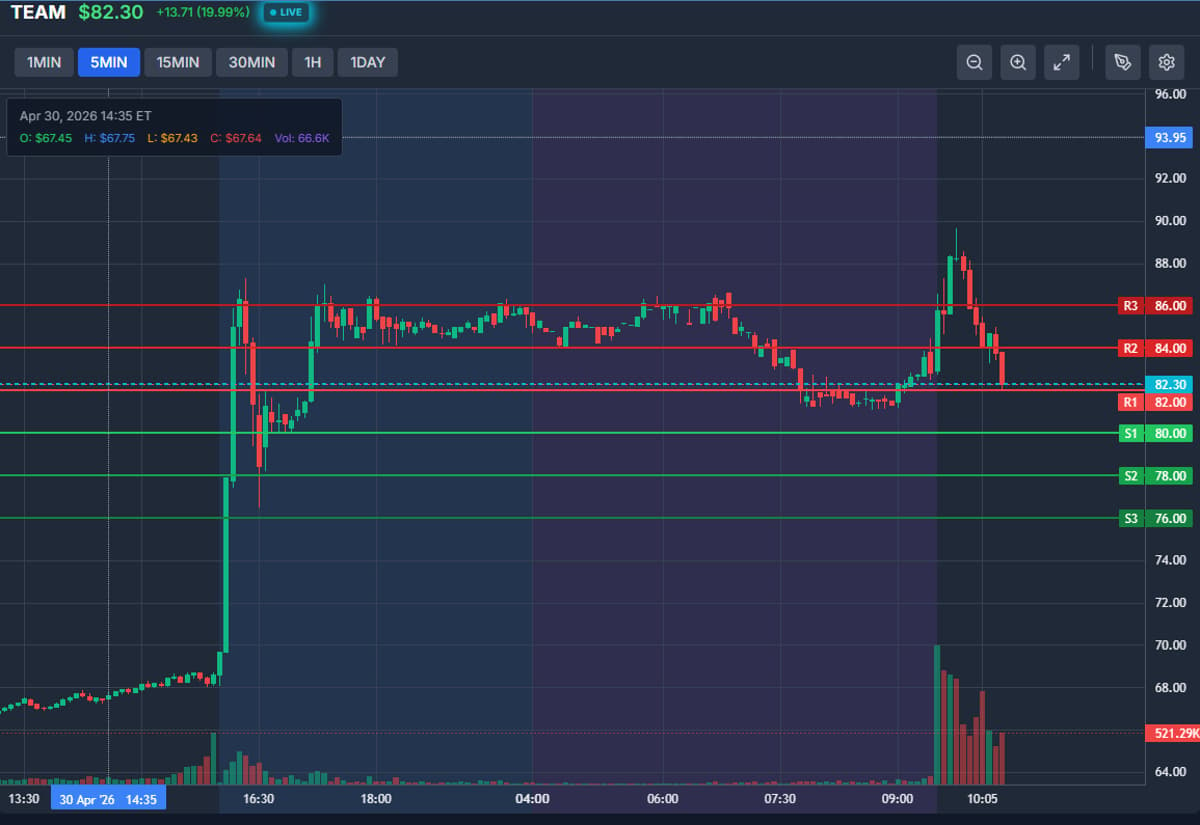
Buy Pullbacks to R1 After R3 Breakout
often, when you see a strong opening drive above R3 the pullback to R1 will be bought... $TEAM https://t.co/7TF8533yTV
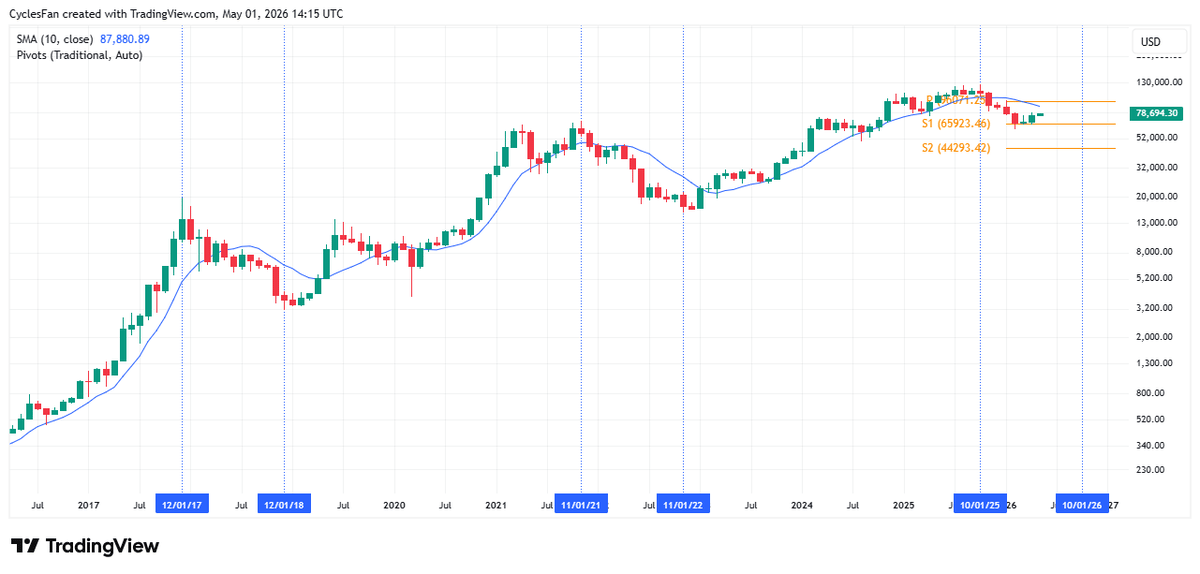
BTC Bear Market Likely Extends to October, 44K Bottom
$BTC monthly - April was an up month but I still expect the bear market to last 1 year as the previous ones lasted, and bottom in October. The current bounce may reach the 10 month MA(87.9K) in May/June before...

Snowflake Gaps up, Holds Above 10/21 Moving Average
$SNOW with a small gap up and back over 10/21ma's daily. Still own it here
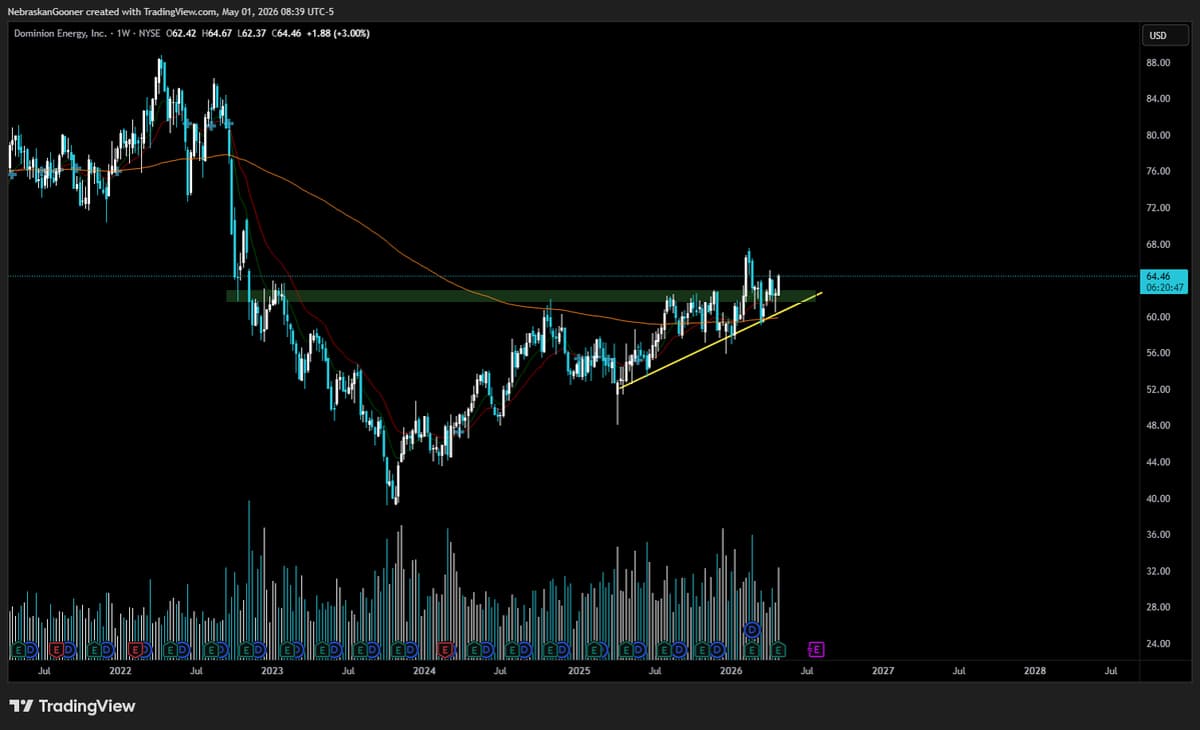
Holding $D: Positive Earnings, Bullish Structure, Strong R:R
$D Been holding this one for a bit now. Positive earnings today and bullish structure. Has a chance to push nicely. R:R is still solid even from here. https://t.co/zsPxbM4pAr
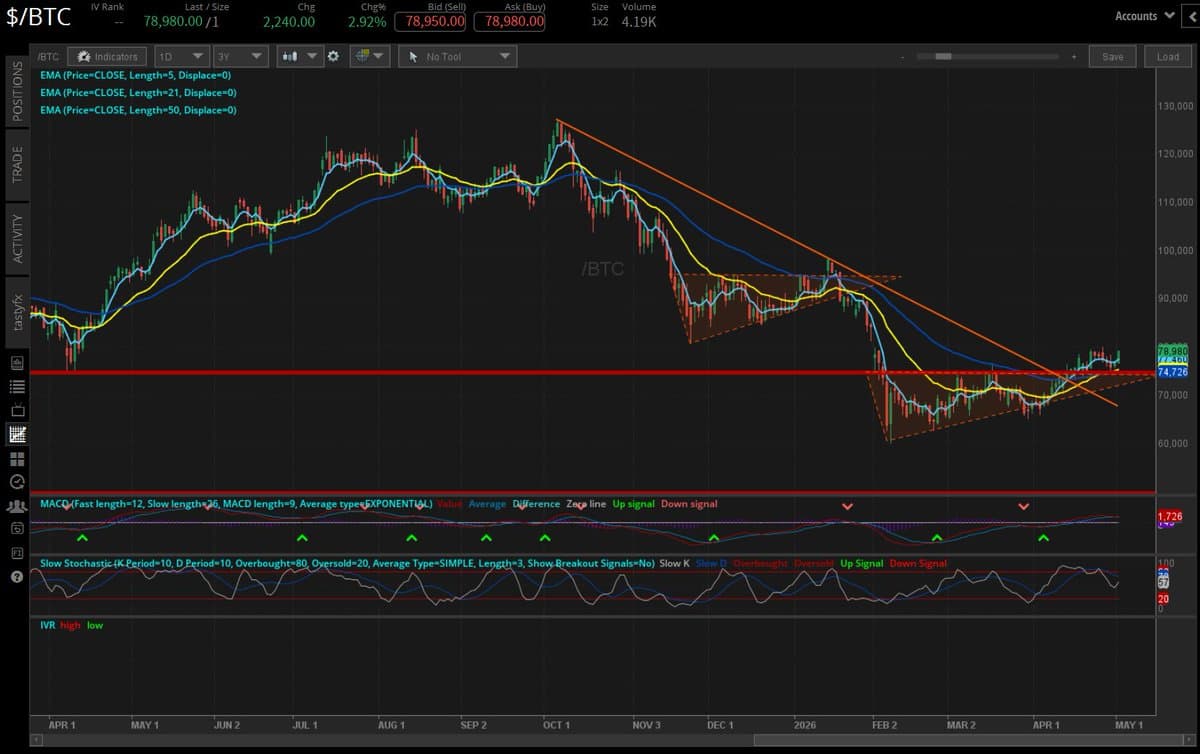
Bitcoin Appears to Break April 2025 Low, EMA Trend Reversal
Bitcoin $BTC looking like it's turning a corner off the April 2025 low & 1-month+50-day EMAs https://t.co/wjnQFDfPZv

Target $7.50 Profit on May 1 Call Spread
$TWLO "Trade Idea 2: Buy the May 1 Expiry 145/152.50 Call Spread ($3.00) and sell the May 1 Expiry 128 Put for 20 cents." puts expire, sell top close call spread near $7.50

Sell May 1 $257.5/$282.5 Strangle for $2.15 Credit
$AAPL "Trade Idea 4: Sell the May 1 Expiry 257.50/282.50 Strangle for a $2.15 credit." puts expire, calls on the edge, may need to roll up and out. can buy to close after IV falls
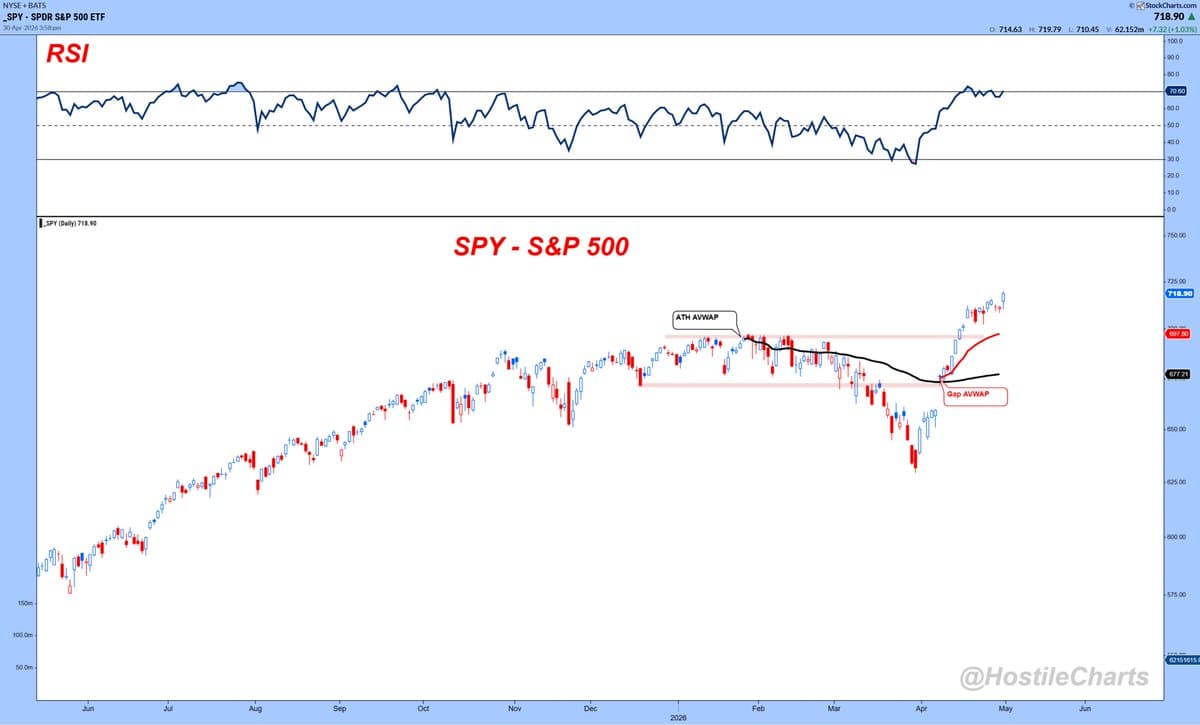
S&P Breaks Out After 6‑8‑Month Stagnation
$SPY - Sure...the S&P moved fast off the lows...but it's also just now resolving a 6-8 month range of nothingness. https://t.co/Ve4gwxbkrC
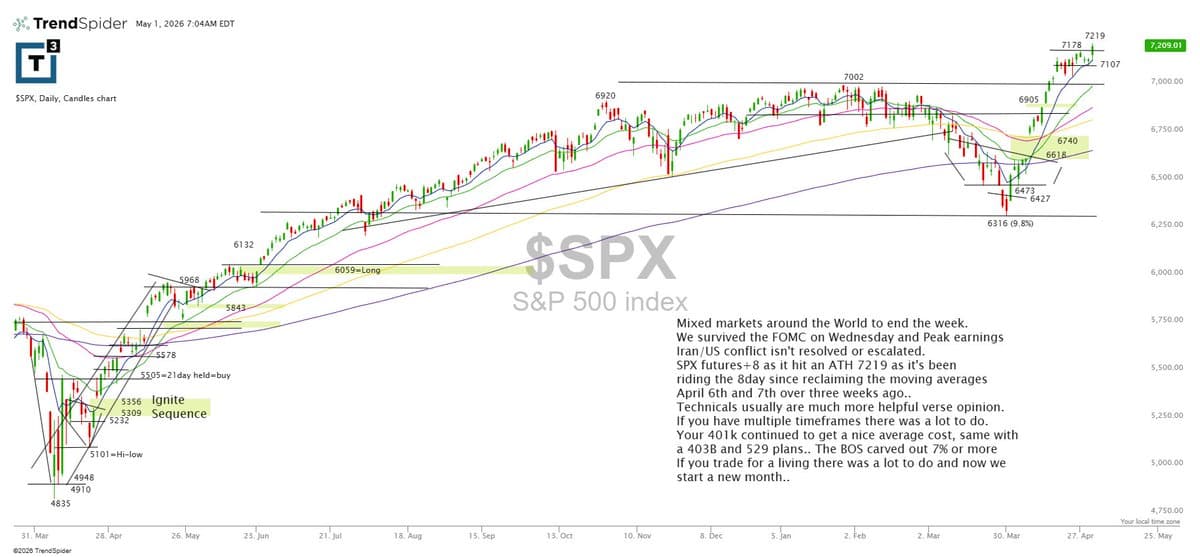
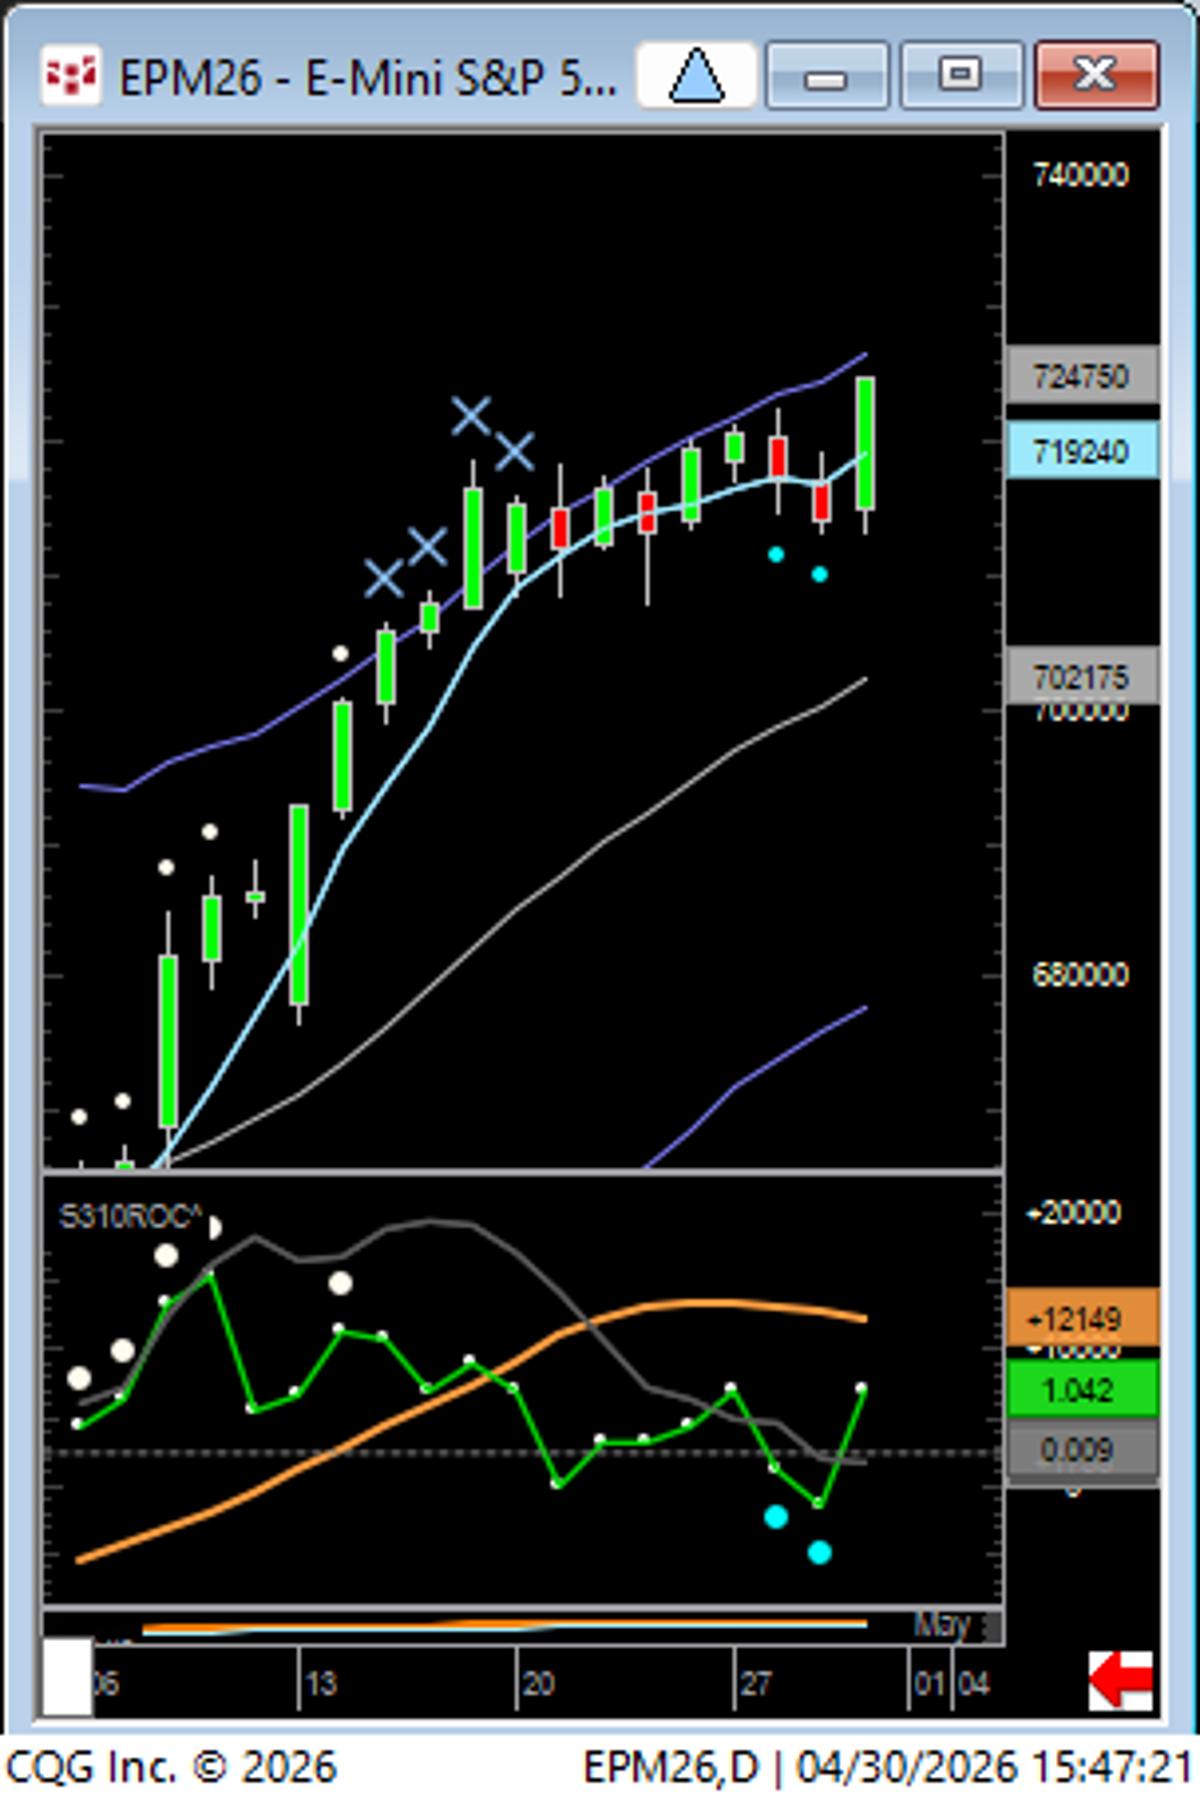
SPX Futures Surge 8 Points After New ATH
$SPX futures +8 after tagging a new ATH at 7219, as it’s been riding the 8-day since reclaiming the moving averages in early April. There was a lot to do across timeframes, and now we start a new month. https://t.co/tGRY36Jv0v

Apple's Strong Earnings Boost Mega Caps, Manufacturing Data Next
🚨 Morning Market Rundown – May 1, 2026 🚨 Manufacturing data + a big $AAPL earnings reaction headline the open 👀 🗓️ Economic Events: 0945 - S&P Manufacturing PMI (Apr): Exp 54; Prior 54 1000 - ISM Manufacturing PMI (Apr): Exp 53.2; Prior 52.7 📈...
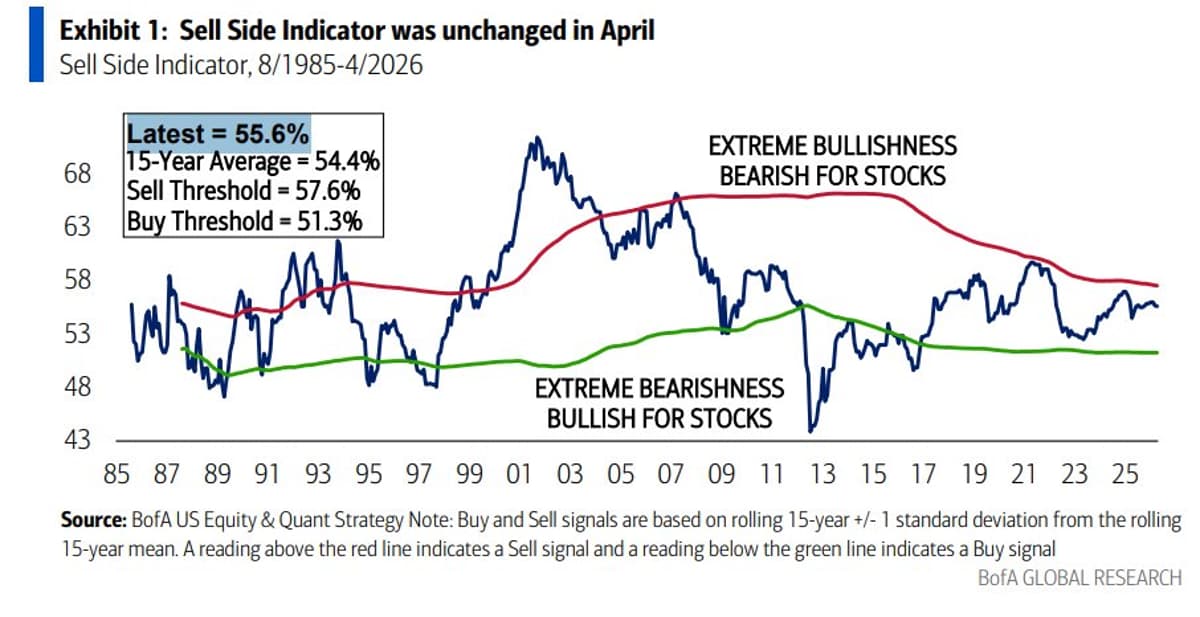
BofA Sell‑Side Indicator Stays Neutral, Near Sell
BofA Sell Side Indicator was unchanged in April Strategists’ equity sentiment unchanged in April, “Neutral”, but closer to a “Sell” signal than a “Buy” https://t.co/pf5gAkdMLy
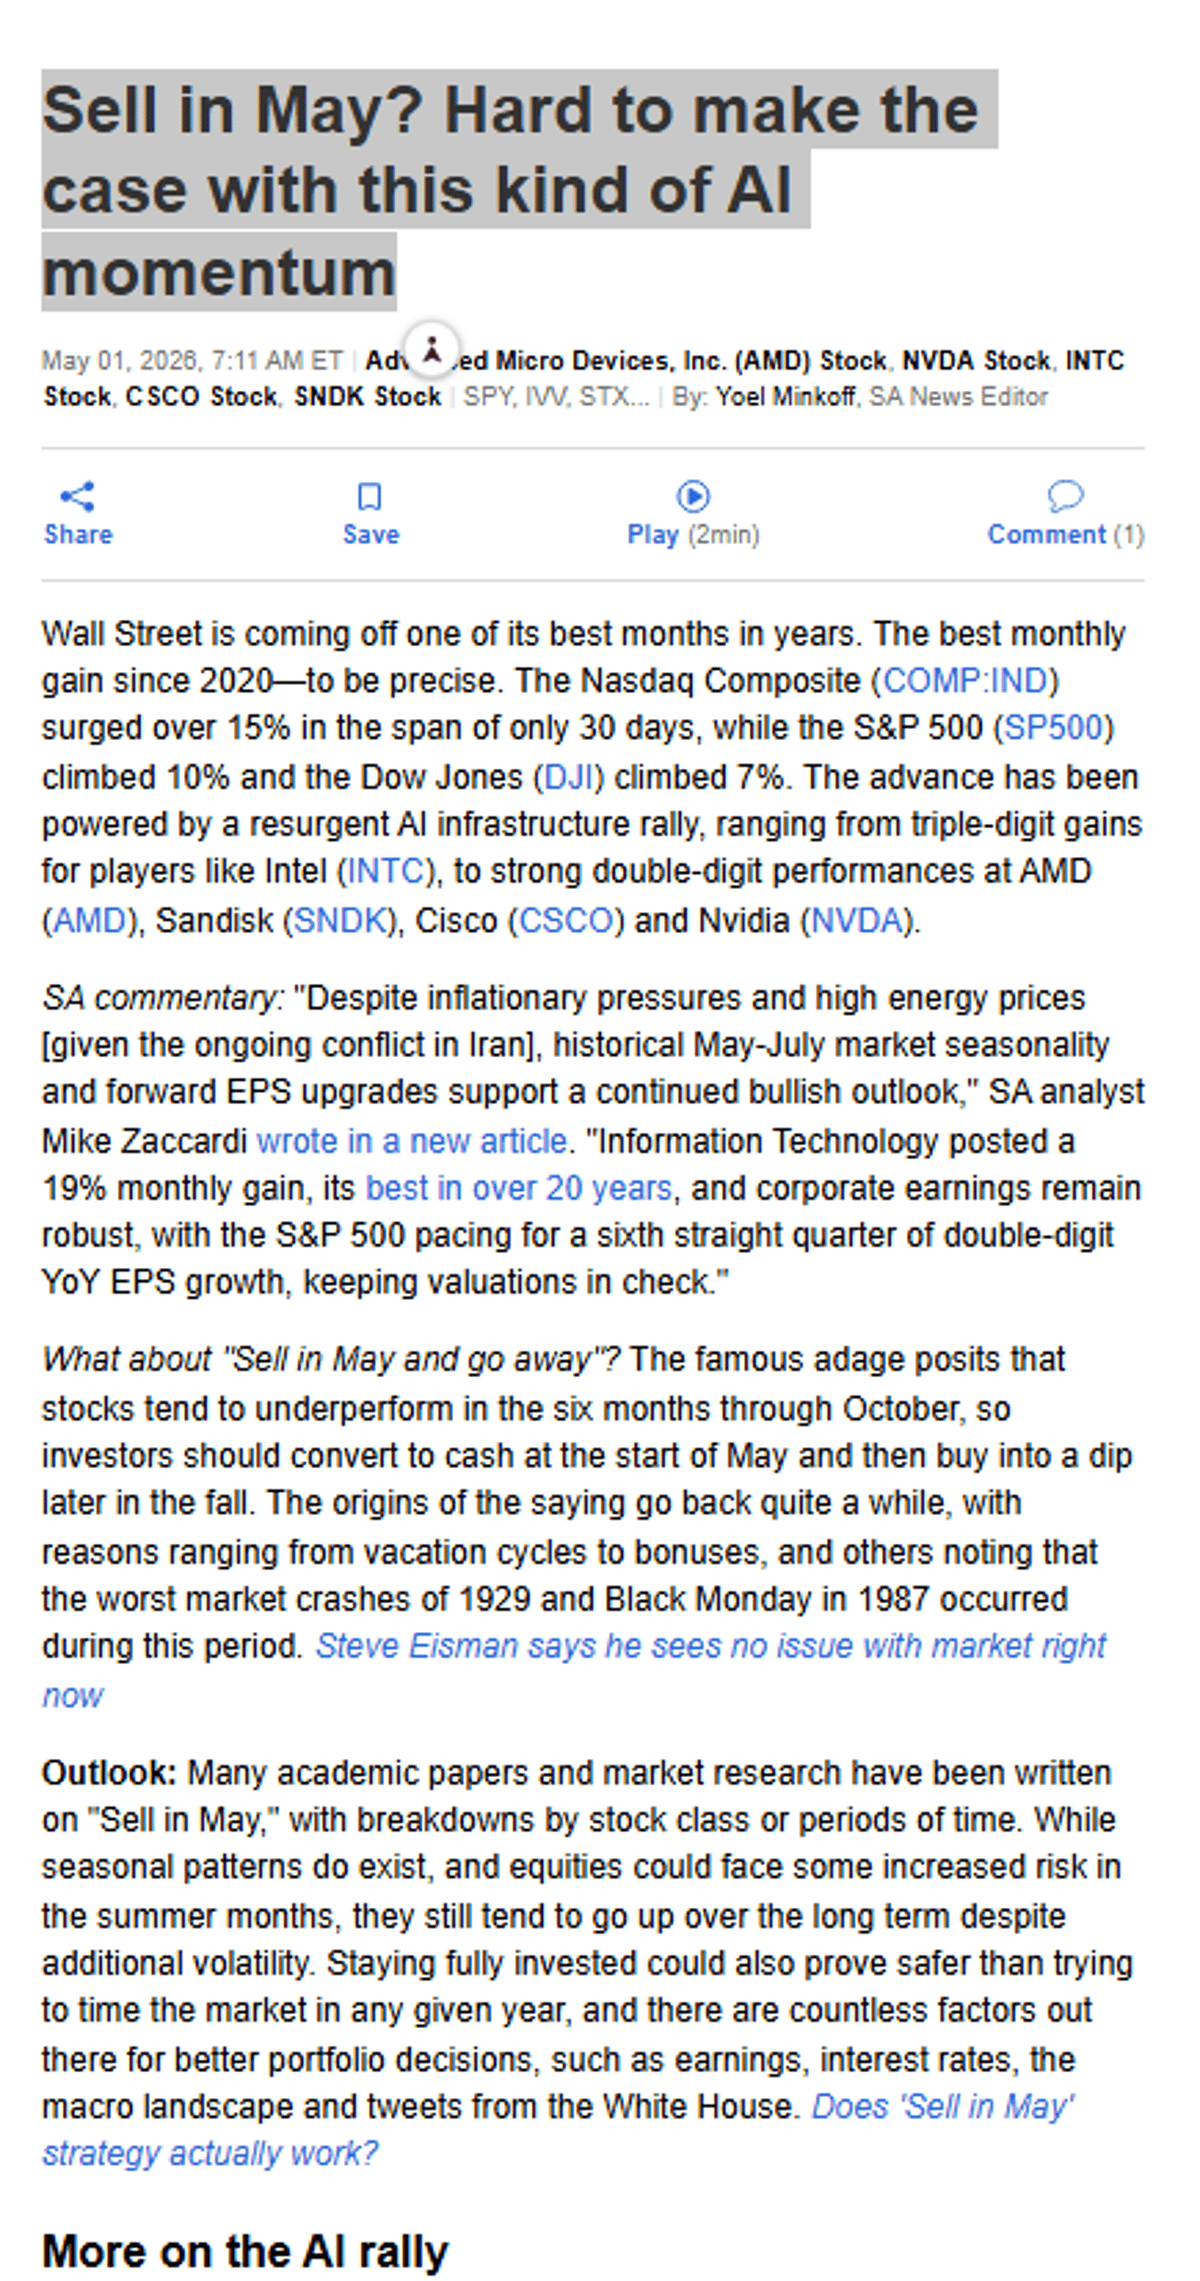
AI Momentum Undermines Traditional “Sell in May” Strategy
Sell in May? Hard to make the case with this kind of AI momentum Look at that, a quote from yours truly @seekingalpha https://t.co/EYmeGHOPIc https://t.co/li4GQPEUvm
AI‑Driven Signal Generates Strong Long and Short Alpha
The alpha has been bountiful this week on both the Long and Short Side of our AI powered Signal Strength Stocks inventory Big moves in big names on that Quantamental List this morning include $AAPL, $TWLO, and $ROKU on the...

Practice Live-Style Trades with TradingView Replay Mode
Try this before your next trading session: TradingView Warm-Up 1. Open TradingView’s replay mode and take some practice trades. 2. Rewind a chart to any point in history and then play it forward, watching price action unfold as if it were happening live. 3....
Breadth Guides Aggression, Yet Selective Wins Still Work
Breadth is still below the 5-day. But yesterday? A lot of swing setups worked. That’s the nuance: Breadth tells you how aggressive to be. It doesn’t mean nothing will work. → When weak: be selective, size down → When strong: press Yesterday was a perfect example. https://t.co/vfYr2yMoIt
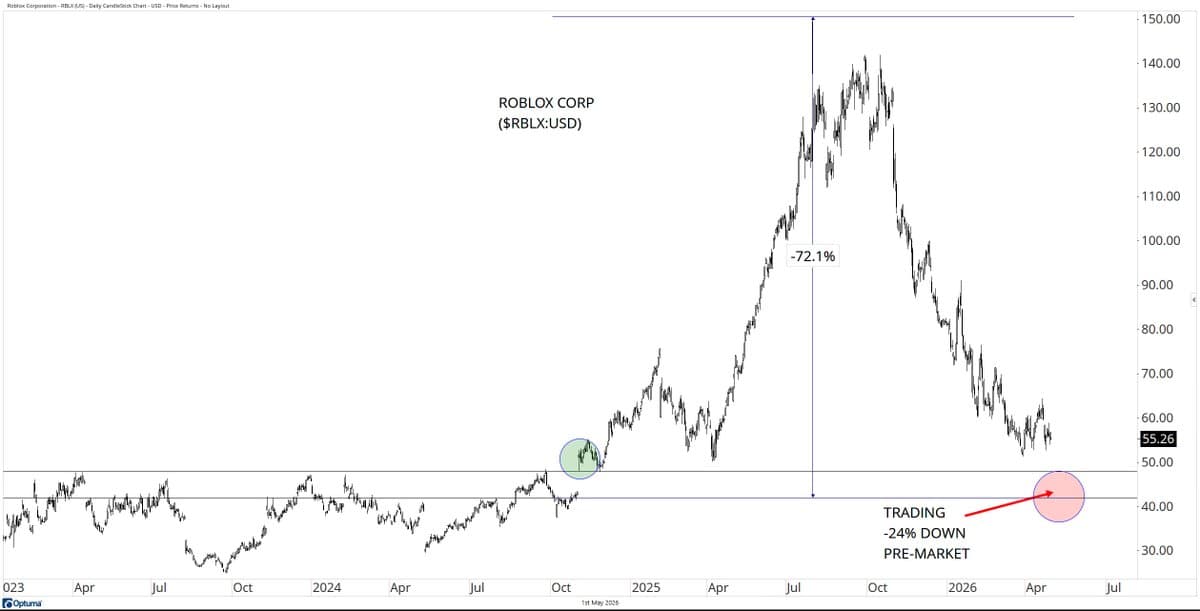
Trendfollowing Shields Investors as Roblox Plummets 72%
Roblox $RBLX down -24% beating on Q1'26 EPS... another reason to be thankful for #trendfollowing so you don't yourself among the losers... the stock is down -72.1% from highs (barring a bounce from pre-market conditions) https://t.co/1qhz4AvBNd

Build Your Edge Using Your Risk‑Reward Ratio
Understand your average risk-to-reward ratio and then build your trading system parameters around it to create a defined edge.

Short on Rejection, Not Panic: Wait for Retest
Don’t jump in when price is already dumping. Wait for price to break a key support level. Then wait for it to come back retest that level and fail. Enter short on rejection, not on panic. Trading tip of the...
Tech Leads S&P to Record Amid Broad Sector Weakness
Five of eleven sectors are red on the year. The S&P just printed its tenth record of 2026 anyway. Intel +24% in a session. Tech now leads on every lookback for the first time this cycle. The whole rally is one sector deep. https://t.co/GoP96luvwI

Price Dip Driven by Trader Positioning, Not Fundamentals
An ~$8 drop with no fundamental catalyst is almost certainly positioning and profit-taking @ALikhodedov The world didn't change overnight The price fell because traders hit "sell" The expiry may not be the only reason but the timing suggests that's a major factor. #OilMarkets...
GEX Heat Map Guided 54% SPY Call Trade
Case study: +54% trade on $SPY today. Pre-trade plan: • $710 support, $715 resistance (GEX) • $715 was the MVC (on the GEX heat map) • Trigger: $712 break, Put/Call cross had no divergence. What happened: • Puts crossed Calls. No divergence. • Price broke $712....
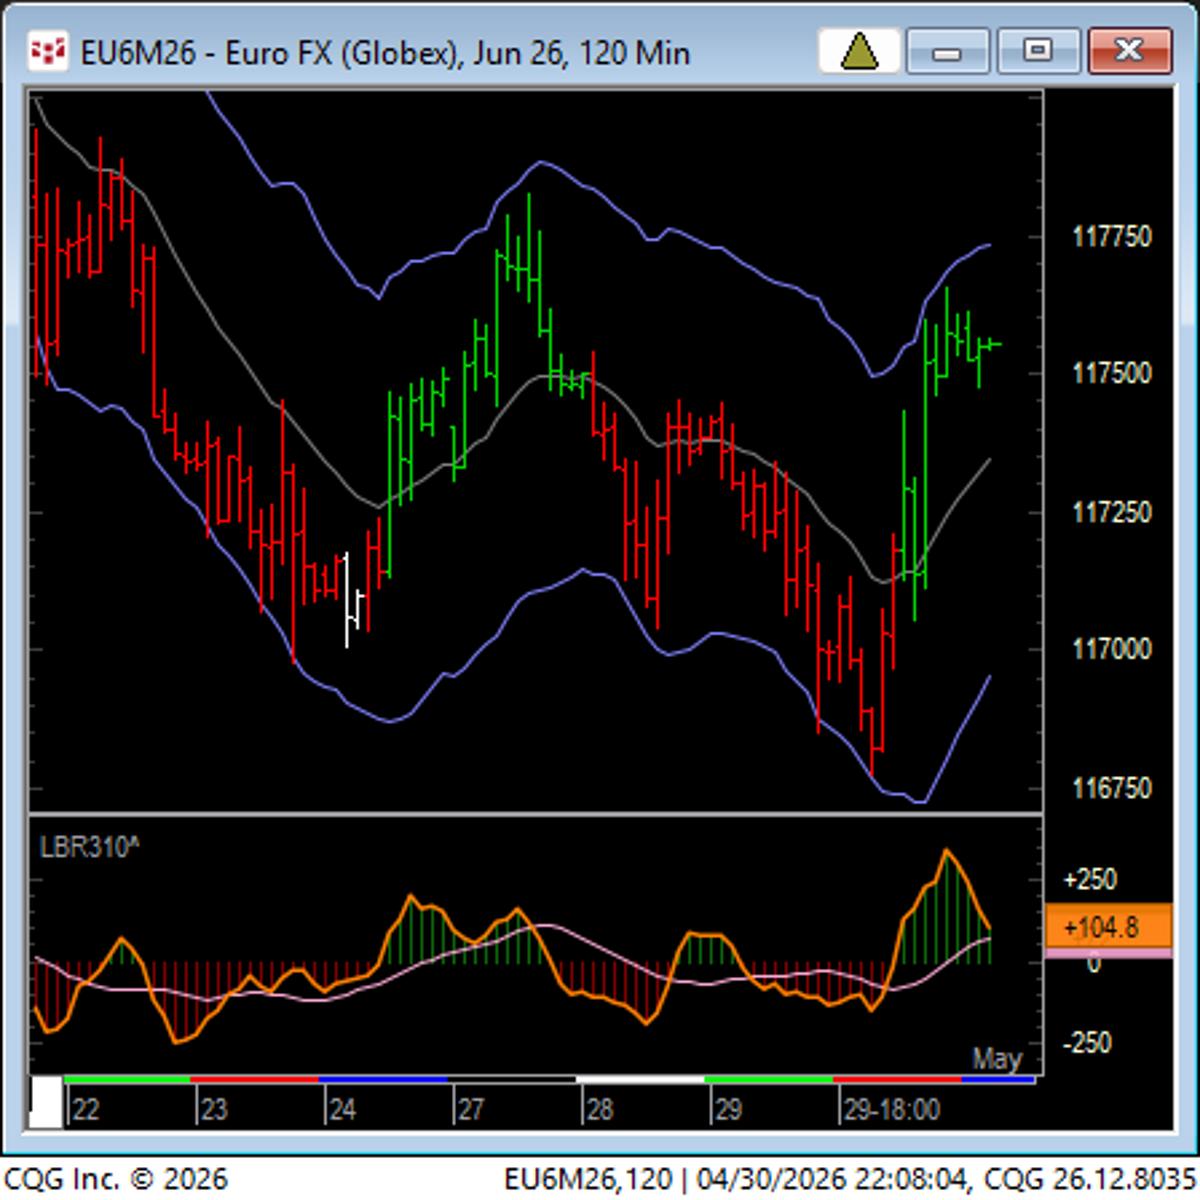
EC Must Form Higher Low To
EC needs to flag on intraday (120) to form higher low in order to bust out upside of down-trending channel. OD up day on dailies a bit to digest. https://t.co/qriJgbms8O
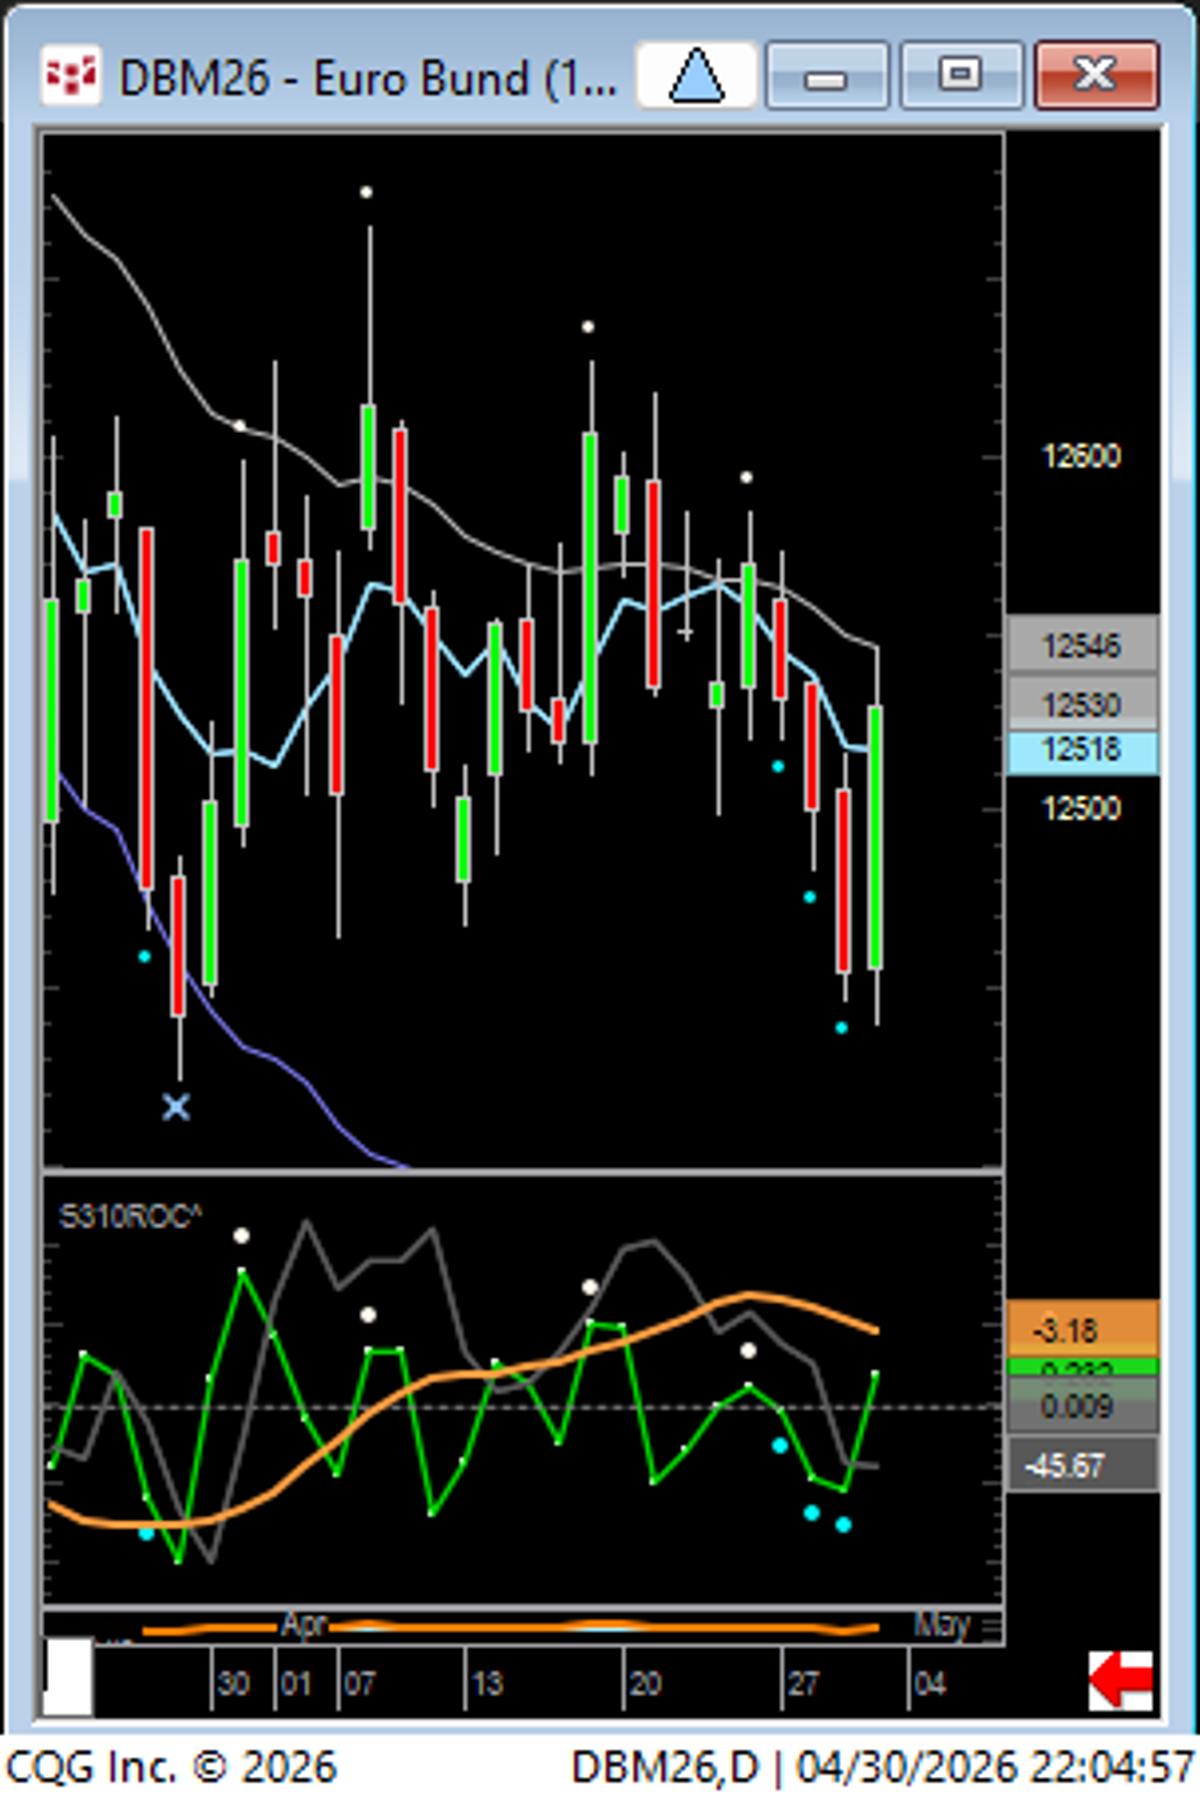
Bunds Turn Overbought as ROC Flips up in Range
Bunds = OD up...quite a response for first flip up on ROC in trading range... https://t.co/fRfsIeT9Hd
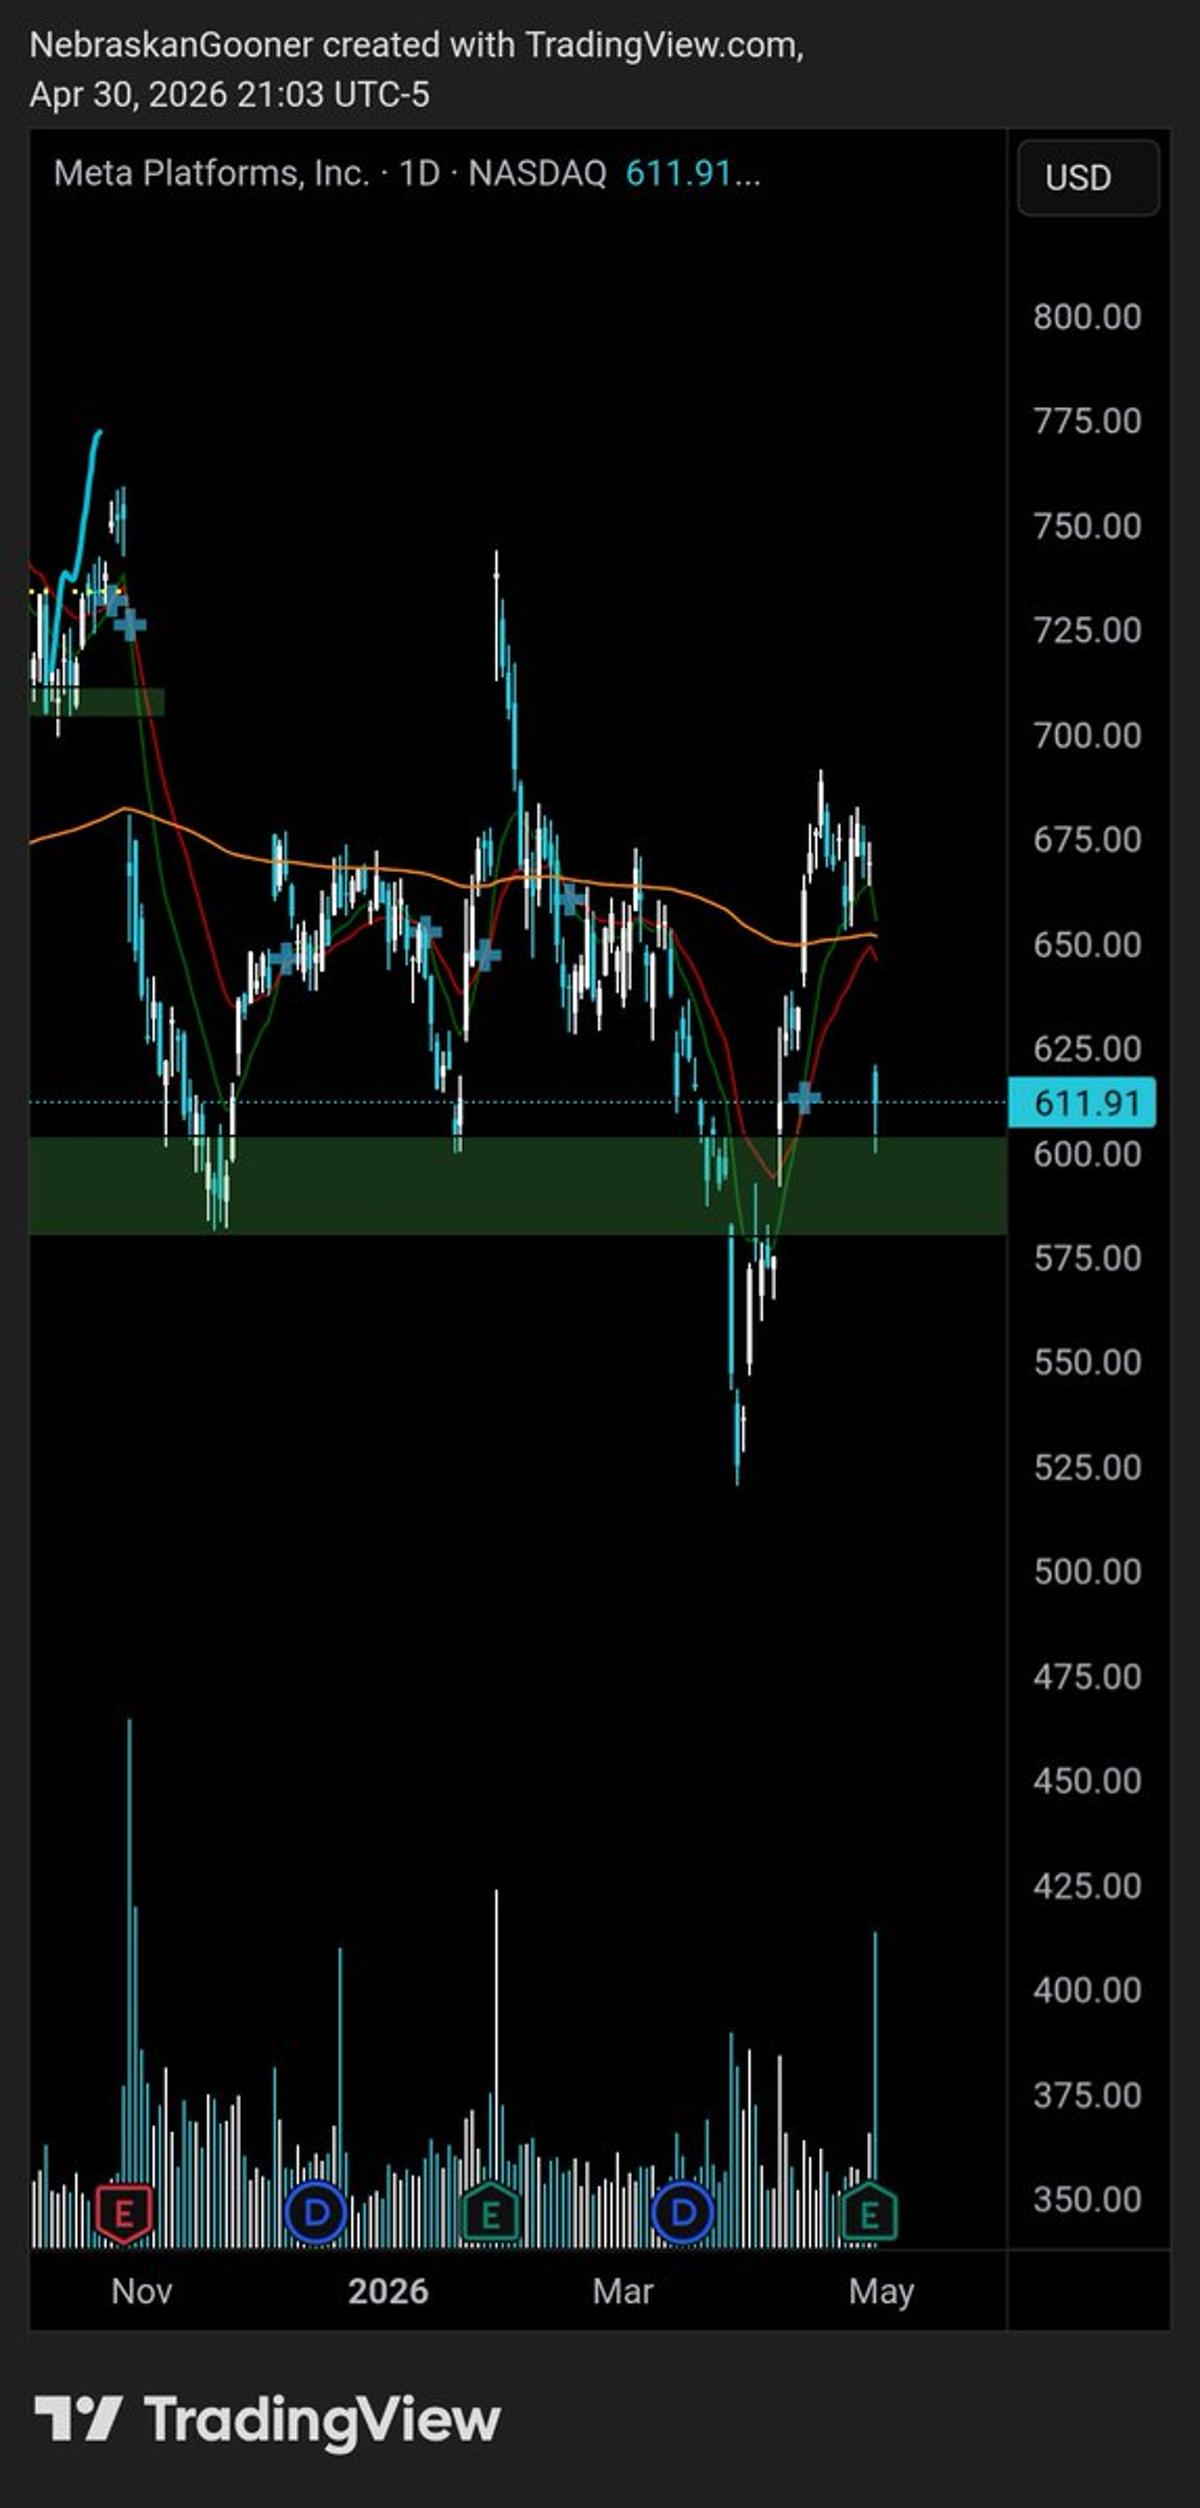
Meta Returns to Support: Buy Signal or Dead End?
$META back to my leg support level from a while back. Time to buy or is this thing cooked? https://t.co/NiSxS9mCXg
Quant Rockets Thrive on Power and Resource Stocks
Oil cooled off, stocks rallied, and Quant Rockets still found its cleanest strength in power and resource names. Better backdrop, yes. Easy tape, not exactly. $POWL $UAMY $TTMI More on our trading from the day below 👇

Kick Off the New Month with a Quick Workout
Exercise time. I will be in and out tomorrow. Mostly out. Friday and a new month starts. See it first.

SPX Upside Bet Hits 7209 Target
As posted pre-market MONDAY: “I’ve got SPX 7191 tagging as upside bet” We tagged 7209 today/EOM close. https://t.co/k9g9uy0uak

Short Equity Puts Halve in Value, Risk Further Loss
My max short equity puts which expire in June and September which I paid 4% of AUM are now worth 2% of AUM. This position alone is down 2% of AUM. Whatcha gonna do. 2% further loss...
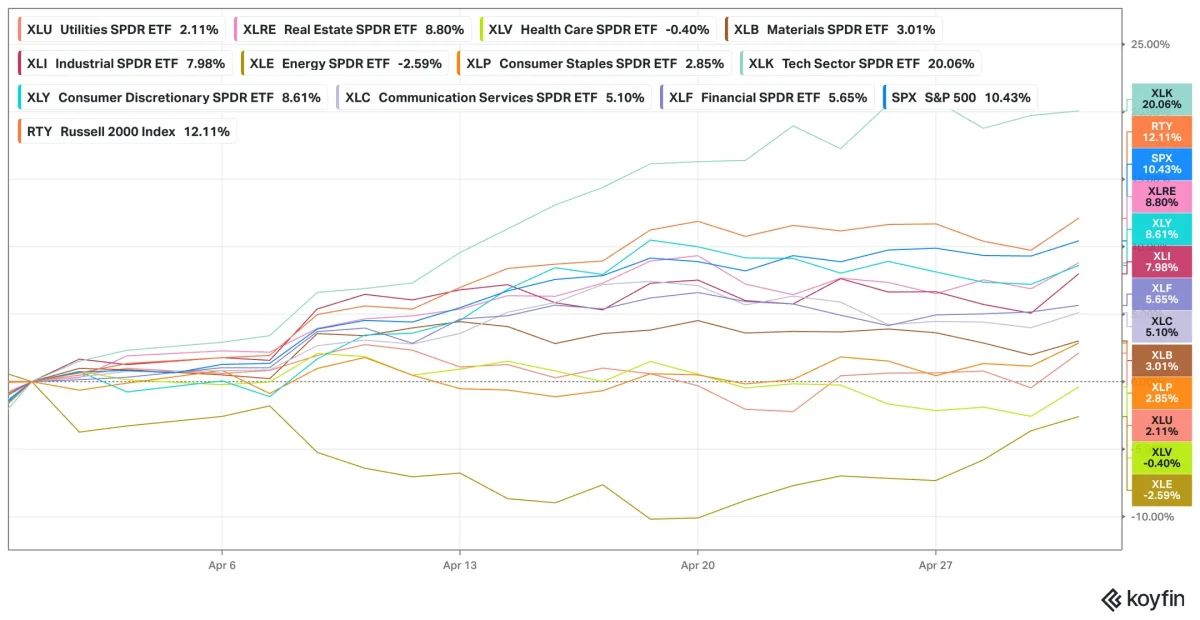
Tech ETF XLK Posts 20% April Gain, Rare Since 2002
Tech stocks finish the month of April up 20%. Only other month that's happened for $XLK since its 1998 inception was October 2002.
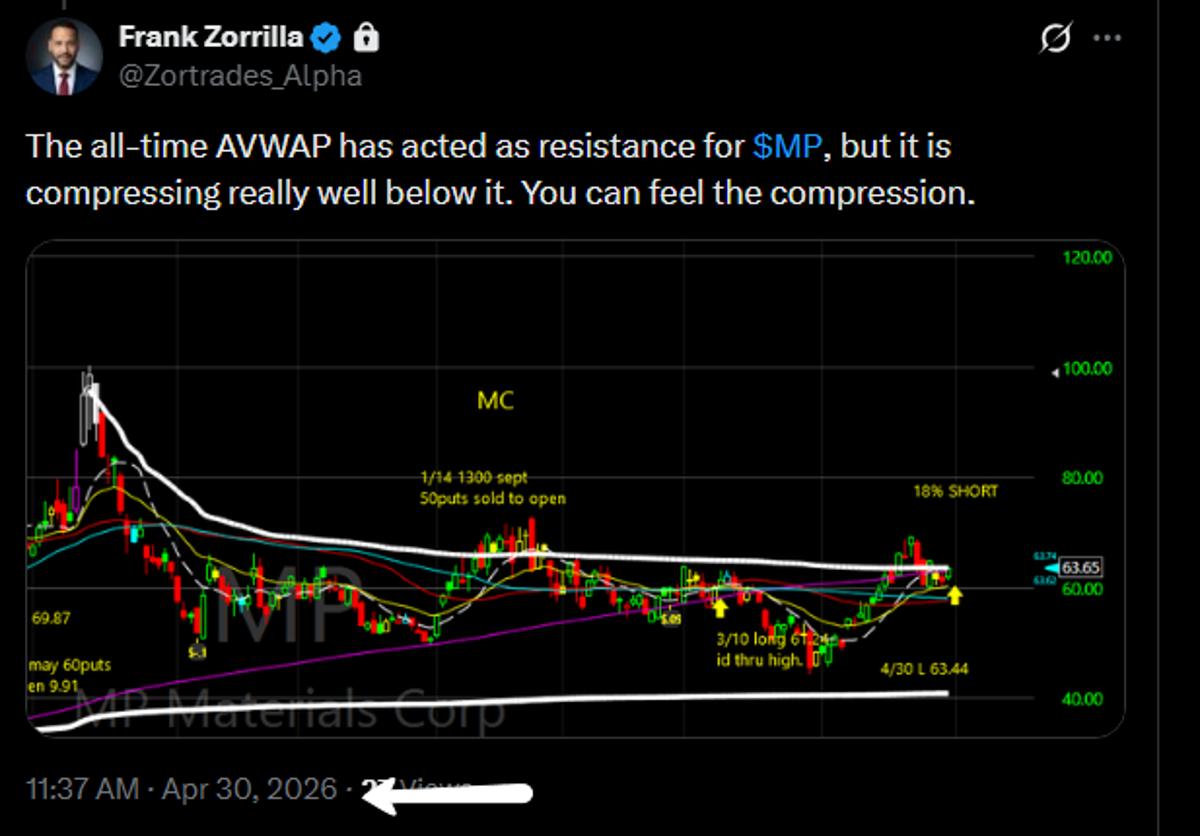
All‑time AVWAP Now Serving as Resistance at $62.95
$MP Shared this earlier with members. All-time AVWAP has been acting as resistance. It was on the list this morning, with a trigger at the previous day's high of 62.95. https://t.co/q5yshYgOis
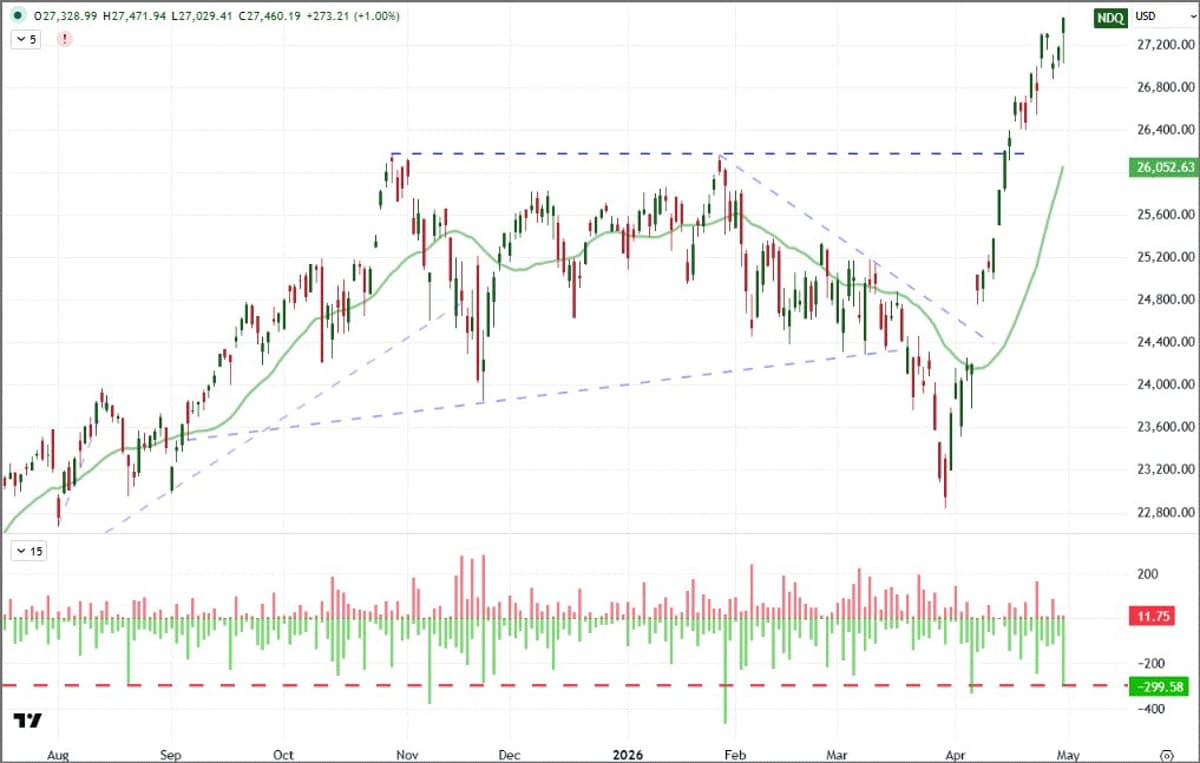
Nasdaq 100's Rare Large Lower Wick Signals Potential Weakness
With its recovery move, Nasdaq 100 has put in a larger 'lower wick'. Quite unusual to see a large (over 1% of spot) wick at a record high. Last time was Jan 25, 2021 and only three instances in the...
Trend Day Surge Leaves 7223.25 Behind, ETFs Lead
Pure trend day UP off Buy Day, 7223.25 PH left in the dust. Will be important level for tomorrow. AIPO FAN IFRA and POWR top performing ETFs. but laggards like XLV...

SPY Surges Past Bull Trap, Breadth Signals Strength
SPY powering into highs, a lot of talk yesterday about "bull trap", ended up being a bear trap, great breadth signals opening hour, 8-MA held firm whole consolidation period
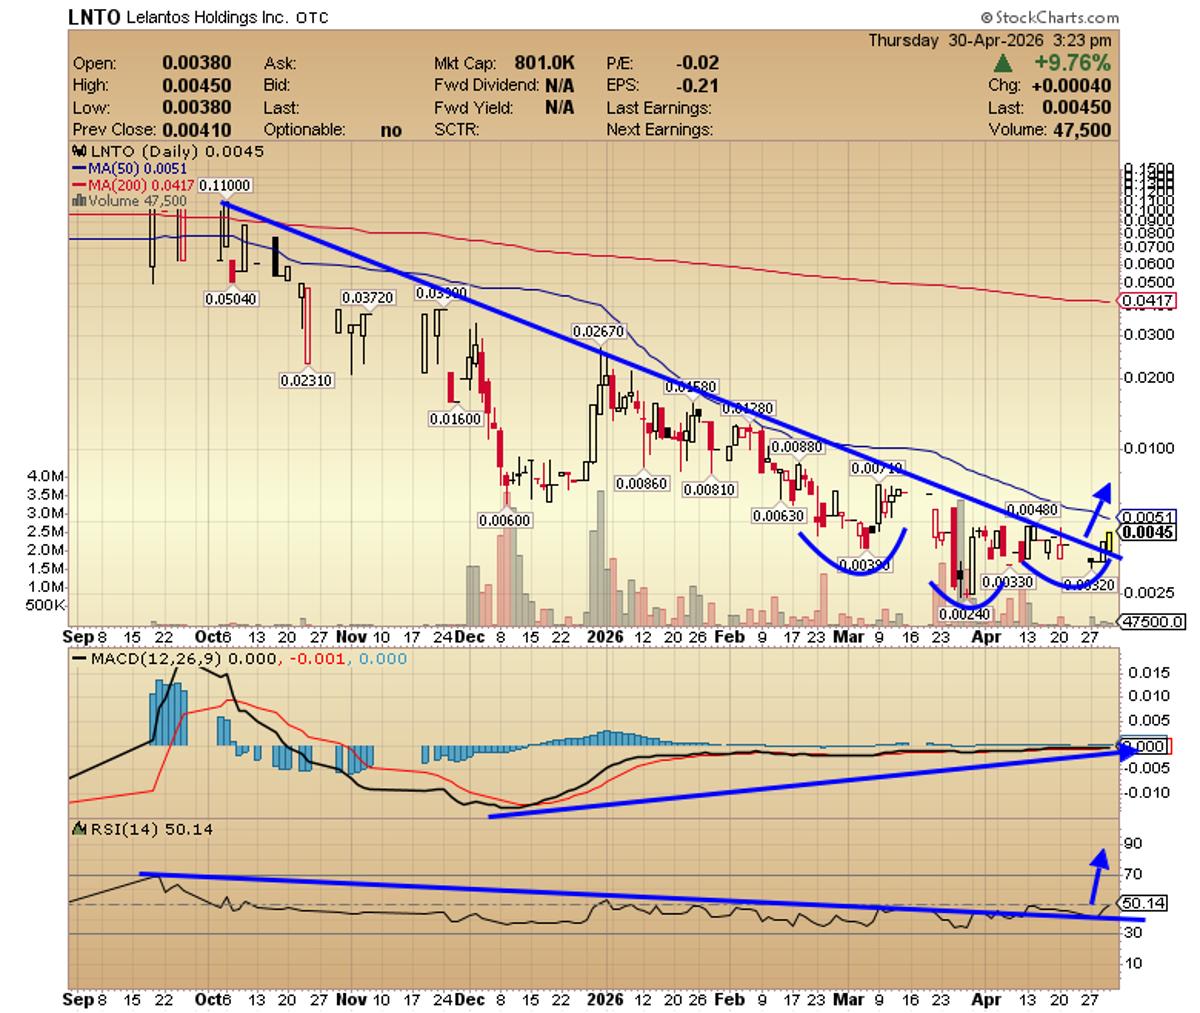
Lelantos $LNTO Price Begins Breaking Downtrend
Lelantos Holdings $LNTO. Microcap spec for gamblers only. No news in a long time. But price starting to break downtrend. https://t.co/4ebyC1djOw

Price Action Springs Higher After Earnings Digest
LOVE this price action. Spring off the lows...consolidations...big earnings news digestion allowing resolutions higher. Got me feeling nicey.
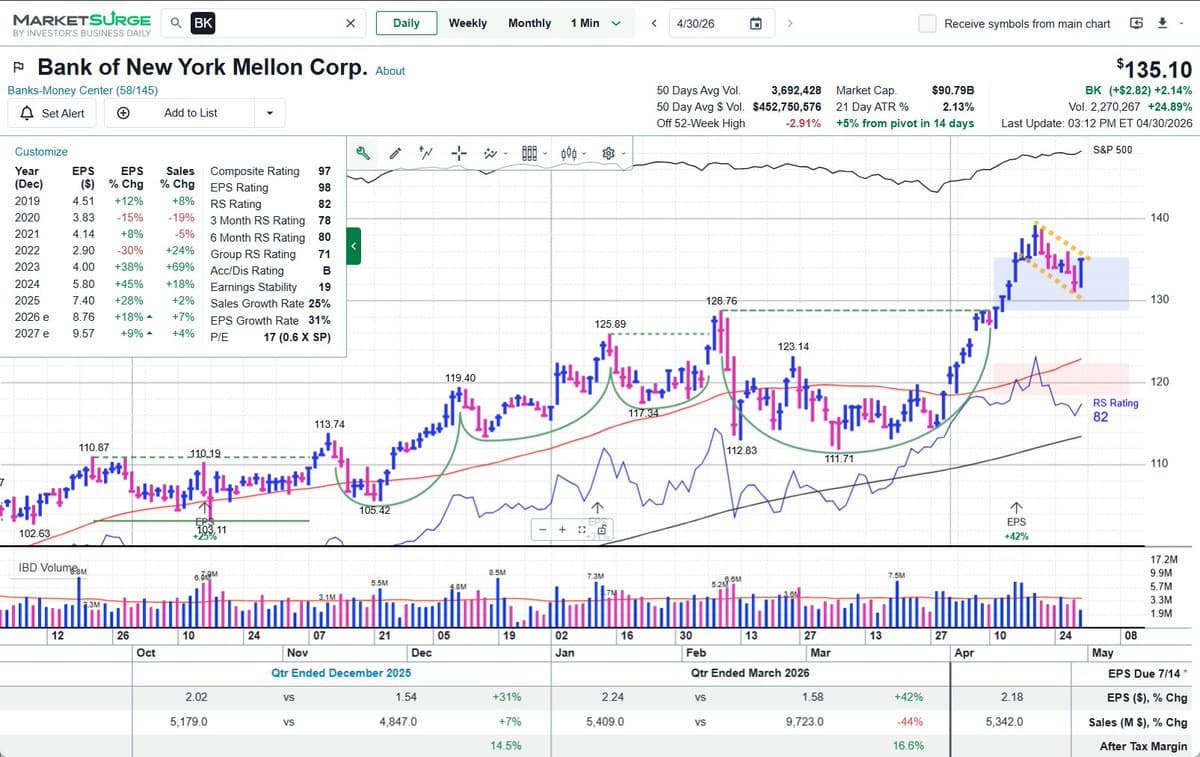
Breakout Trend Pullback Setup Signals BK Strength
Nice breakout, trend, and pullback setup here for leading financial Bank of New York Mekkon Corp, seen here on @IBDinvestors MarketSurge $BK #IBDPartner https://t.co/hmrYlQNOn6

Simple Finviz Scanning Method Stands the Test.
I use @finviz_com as my primary scanning platform... then I use this simple method for scanning: https://t.co/VUcH772iYX Often times, the simplest process works best and survives the test of time
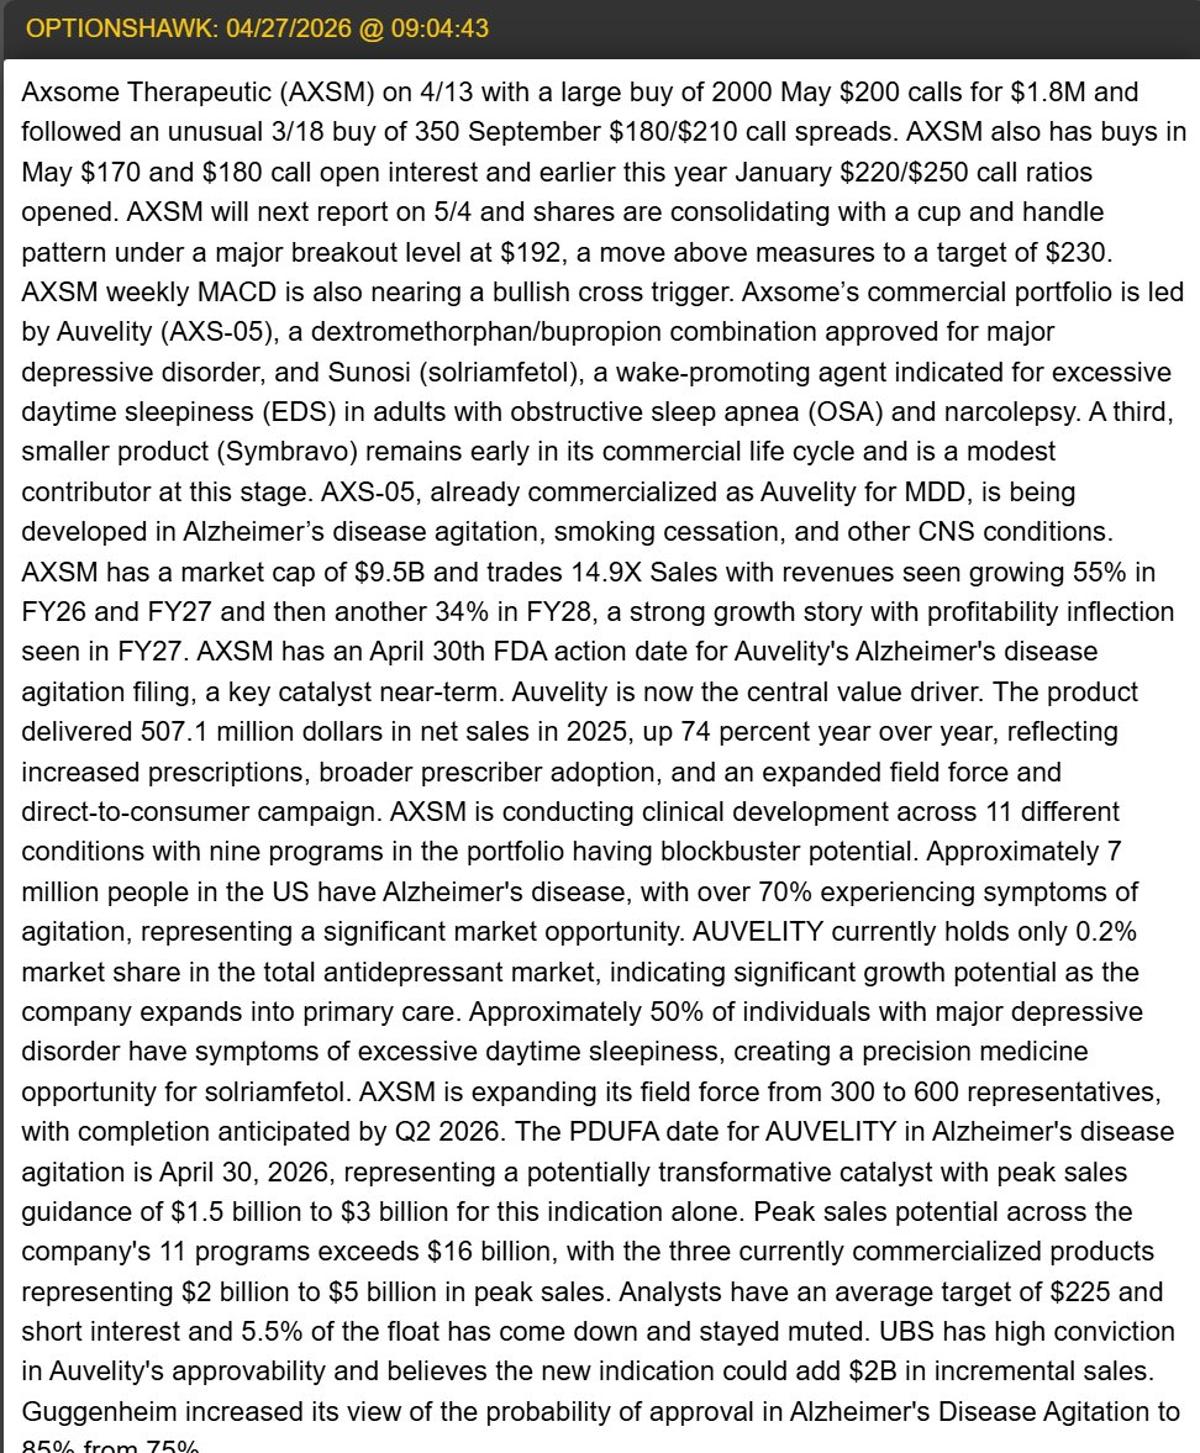
AXSM Jumps 10.5% on Approval and Analyst Boost
$AXSM up over 10.5% on approval, calls hit nicely from recent write-up on this catalyst play https://t.co/H2E75g3iRB
Dollar Short Resists Gap, Signaling Potential Inflation Surge
Dollar short maintained resistance at gap area....first day down with big impulse - me thinks start of something huuuuge (ha joke, there), but seriously, weekly structure still supports swing to new lows. START of major inflationary...
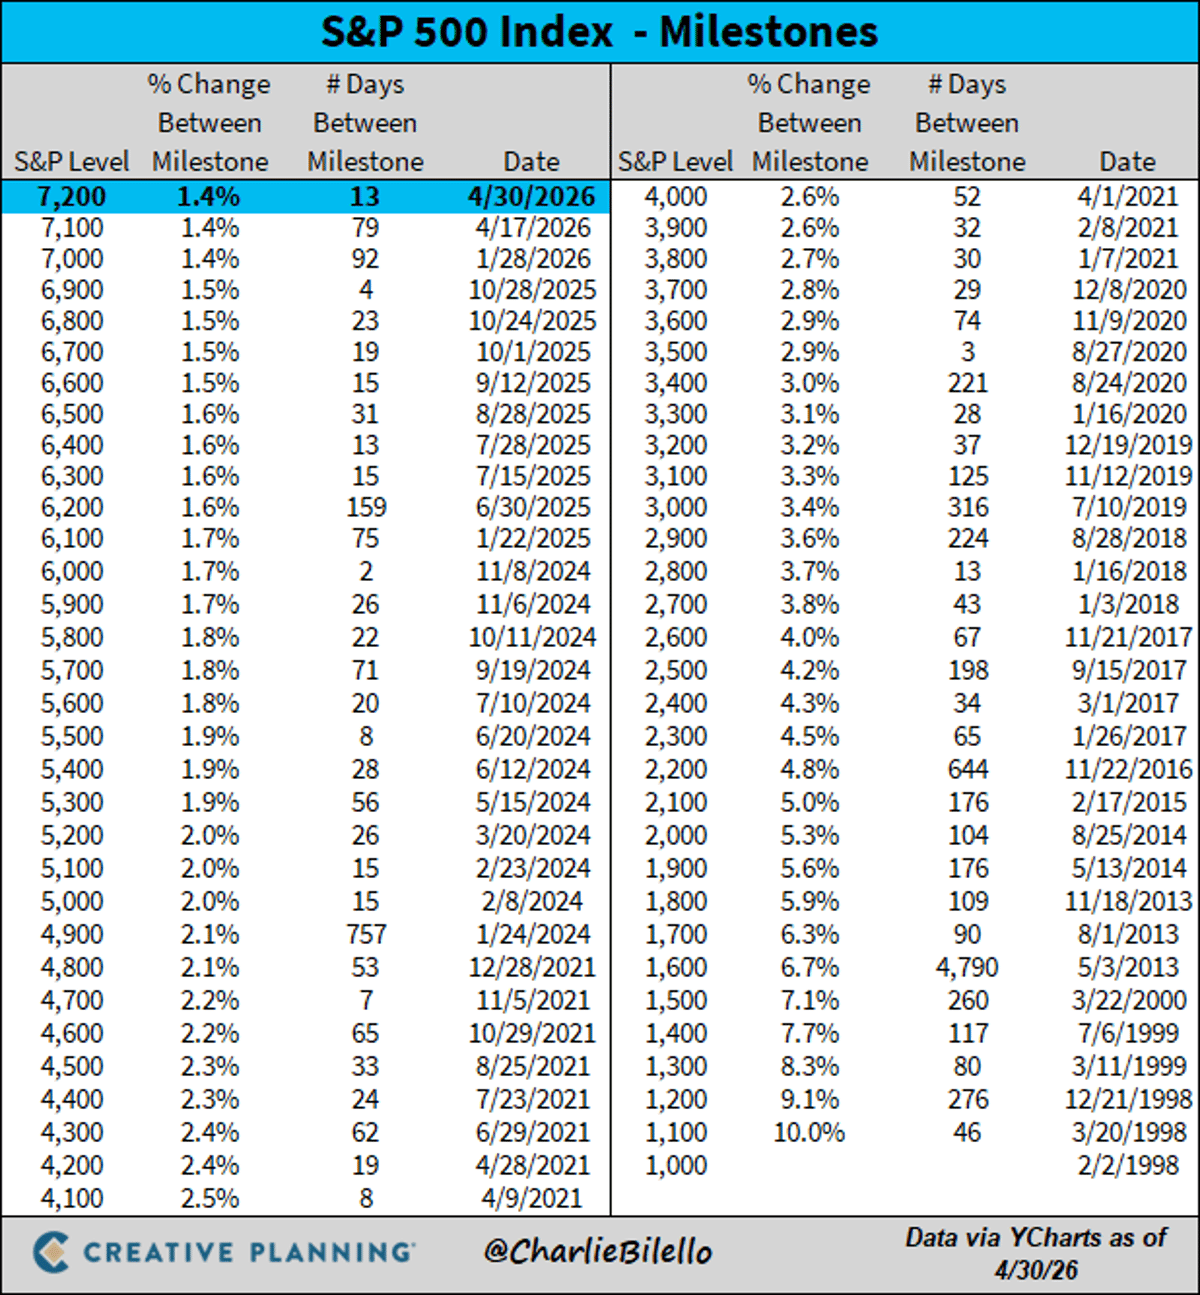
S&P 500 Surpasses 7,200, Doubling Decade‑Long Gains
The S&P 500 just crossed above 7,200 for the first time. A year ago it was at 5,600. 5 years ago it was at 4,200. 10 years ago it was at 2,100. $SPX https://t.co/b24VEKNTKj
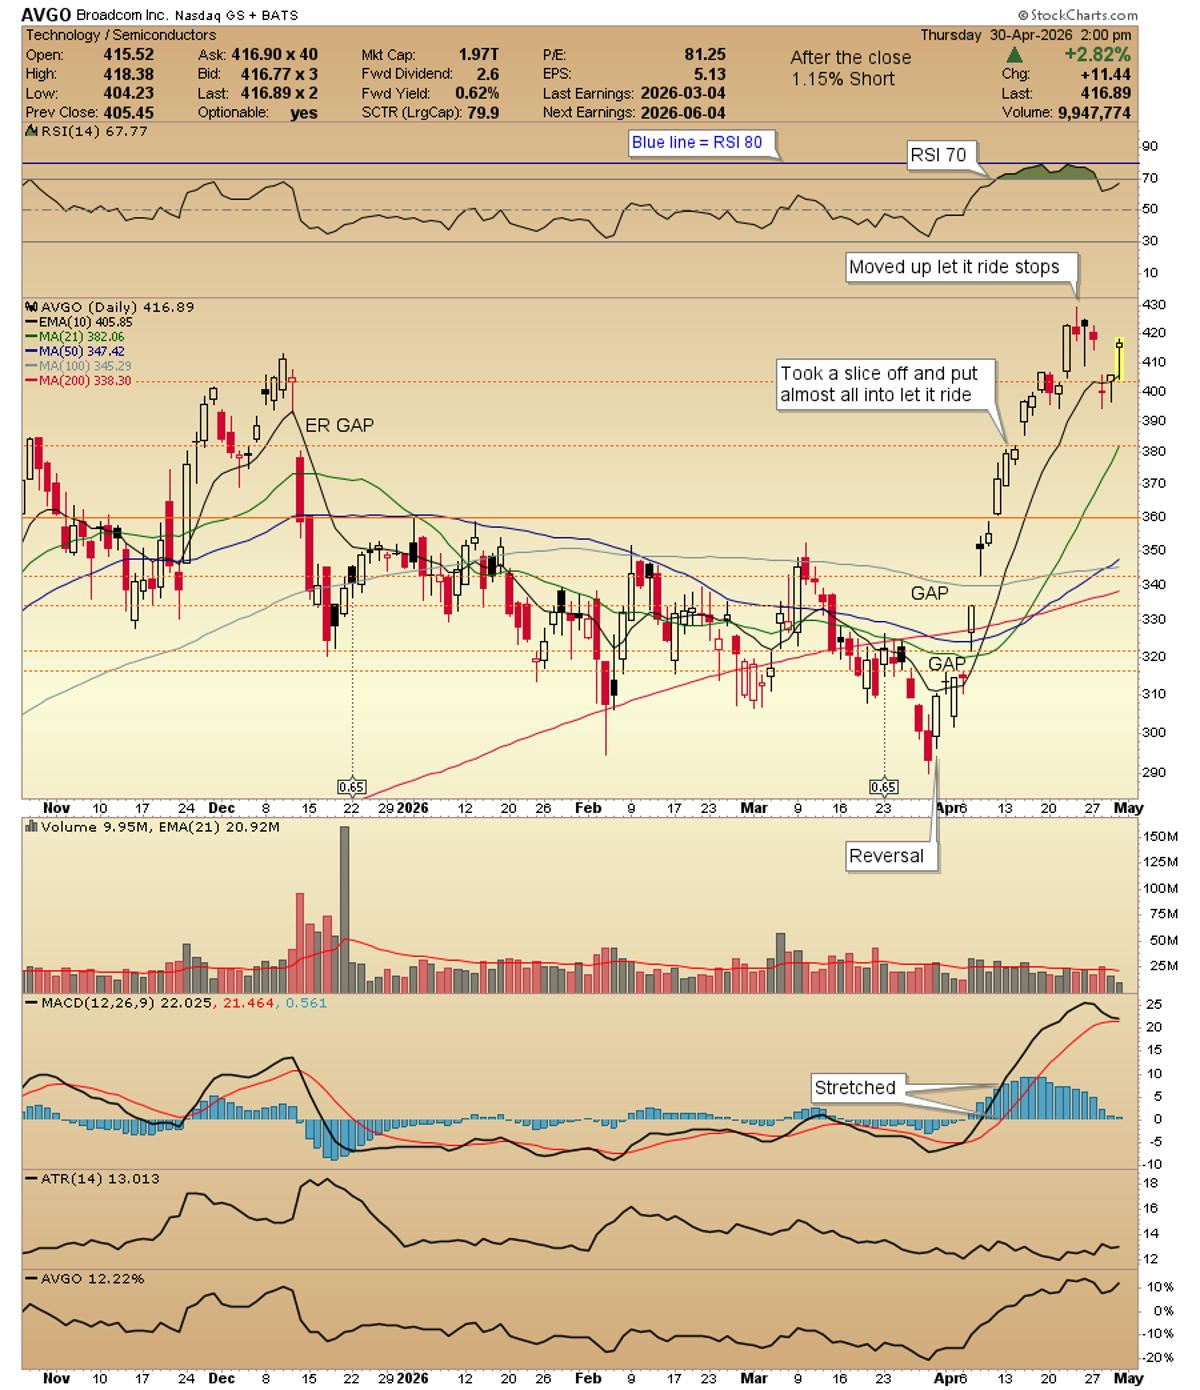
AVGO Gaps Down, No Stop Adjustments Today
$AVGO filled the Monday gap down today. Updated chart. No change to me stops today. https://t.co/sg8KGTsLmL
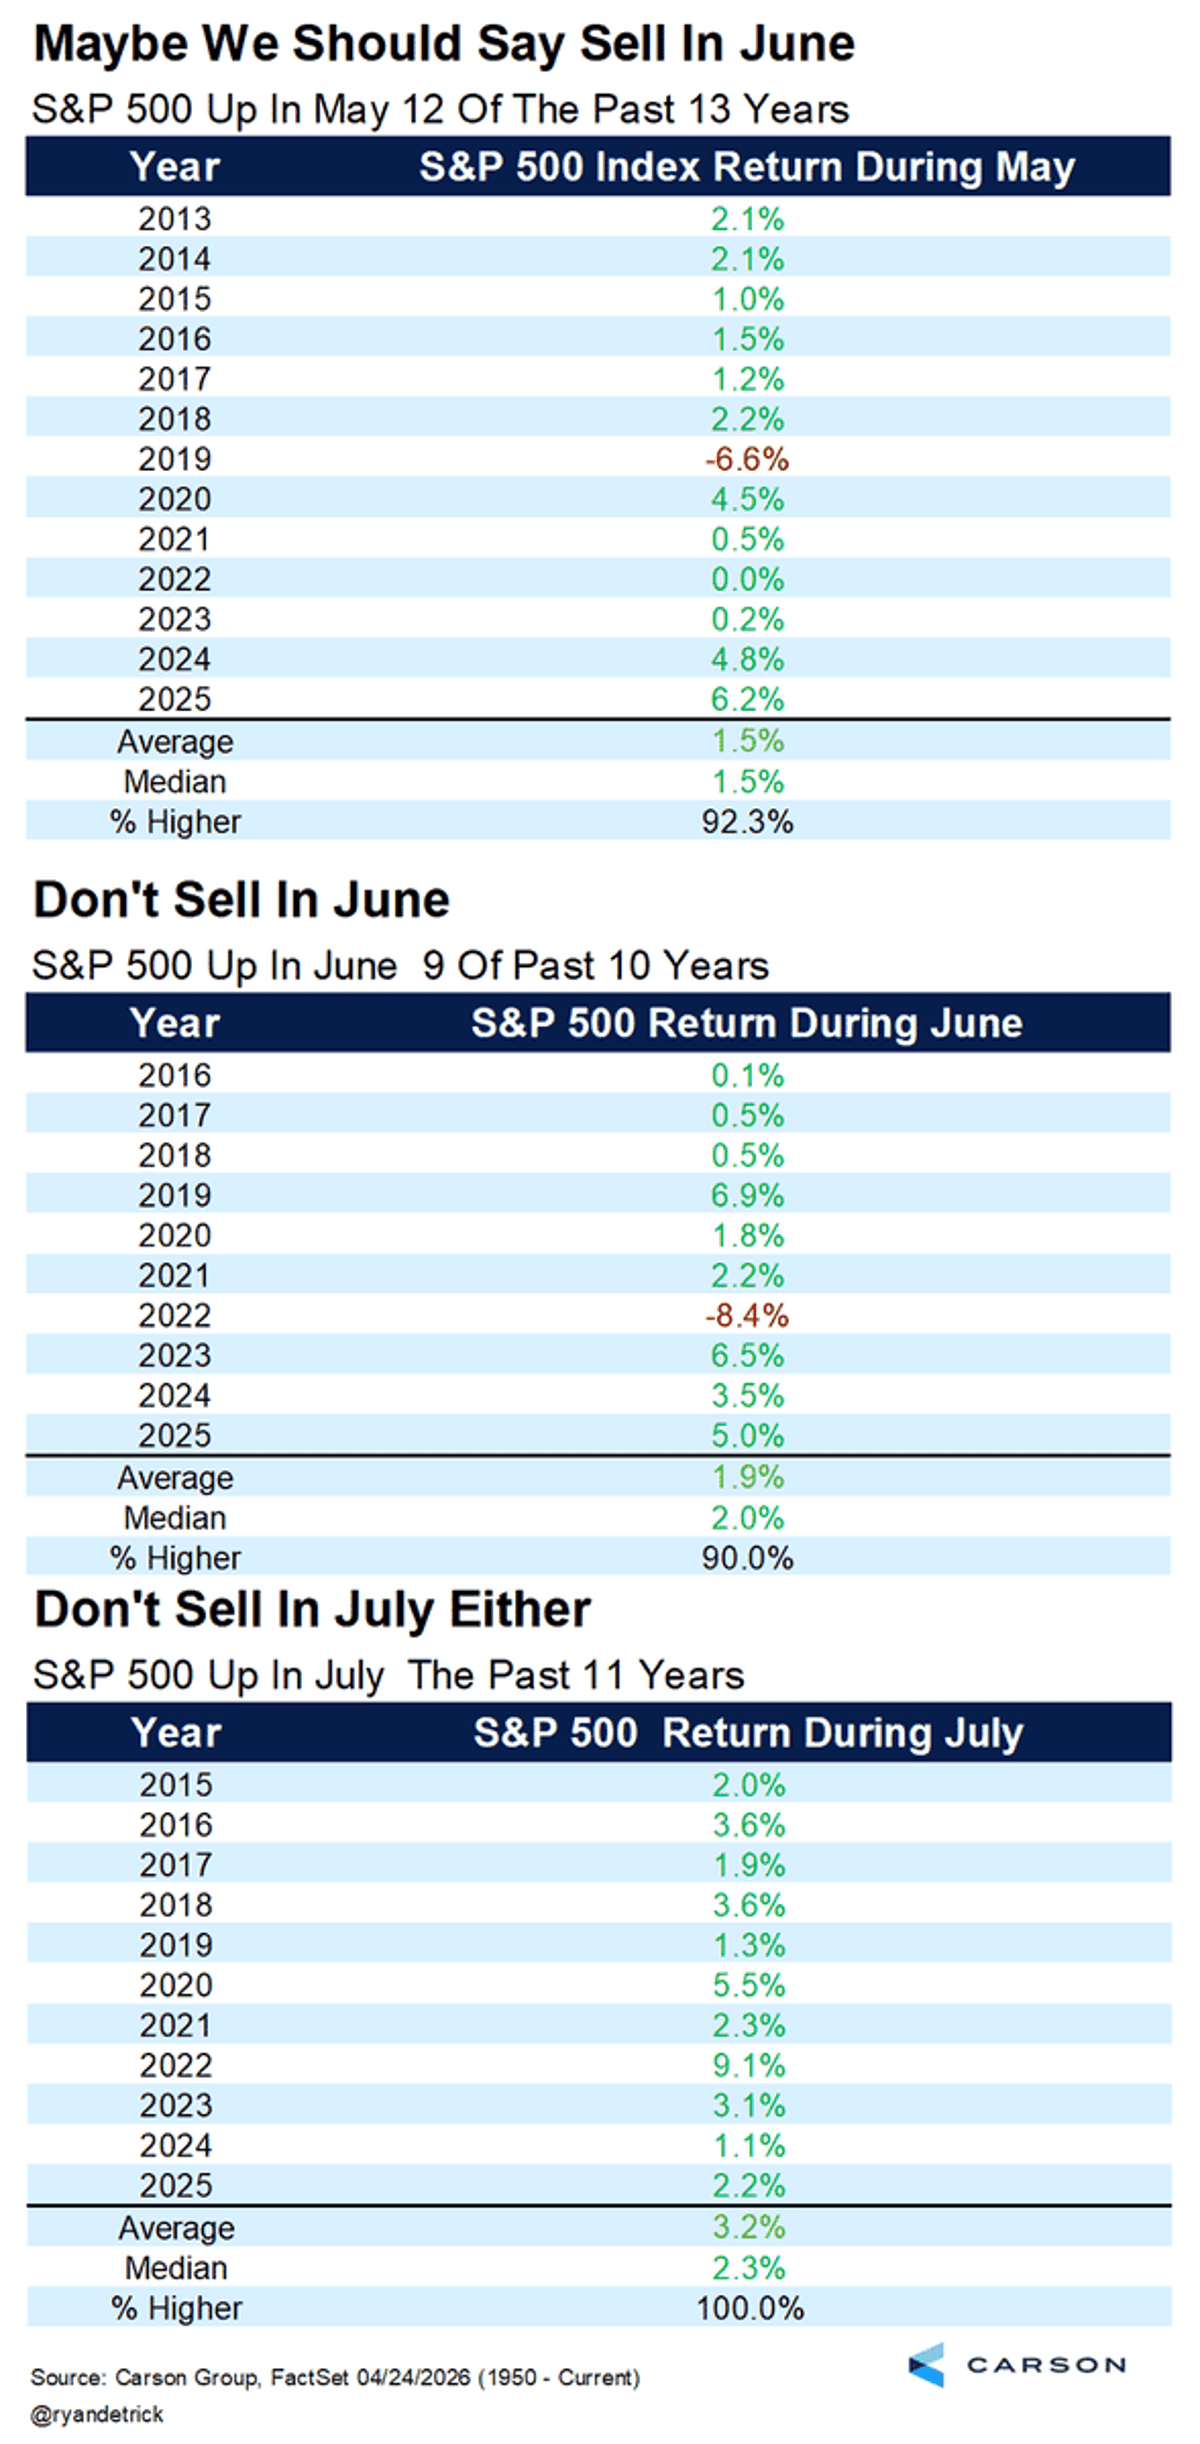
S&P 500 Historically Rallies in May, June, July
Love reading @dailychartbook each day, but even more when I realize I'm in there ;) 28. SPX seasonality. "The S&P 500 has been up 12 of the past 13 Mays. The S&P 500 has been up 9...
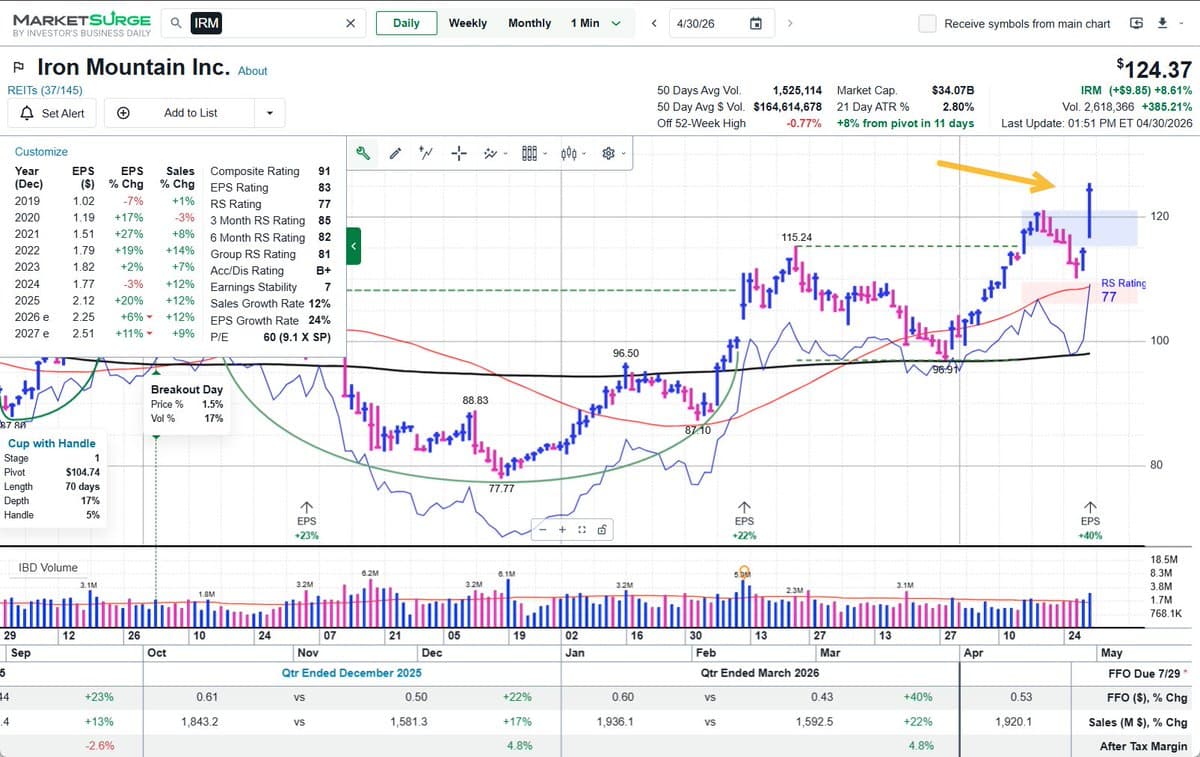
Boring REIT Iron Mountain Jumps 8% to Fresh Highs
It's a boring REIT, but it's a boring REIT that is up 8% on the day and 50% YTD. Iron Mountain spotted on @IBDinvestors MarketSurge breakout lists pushing to fresh highs today (no position) $IRM #IBDPartner https://t.co/dSquzwX6PJ
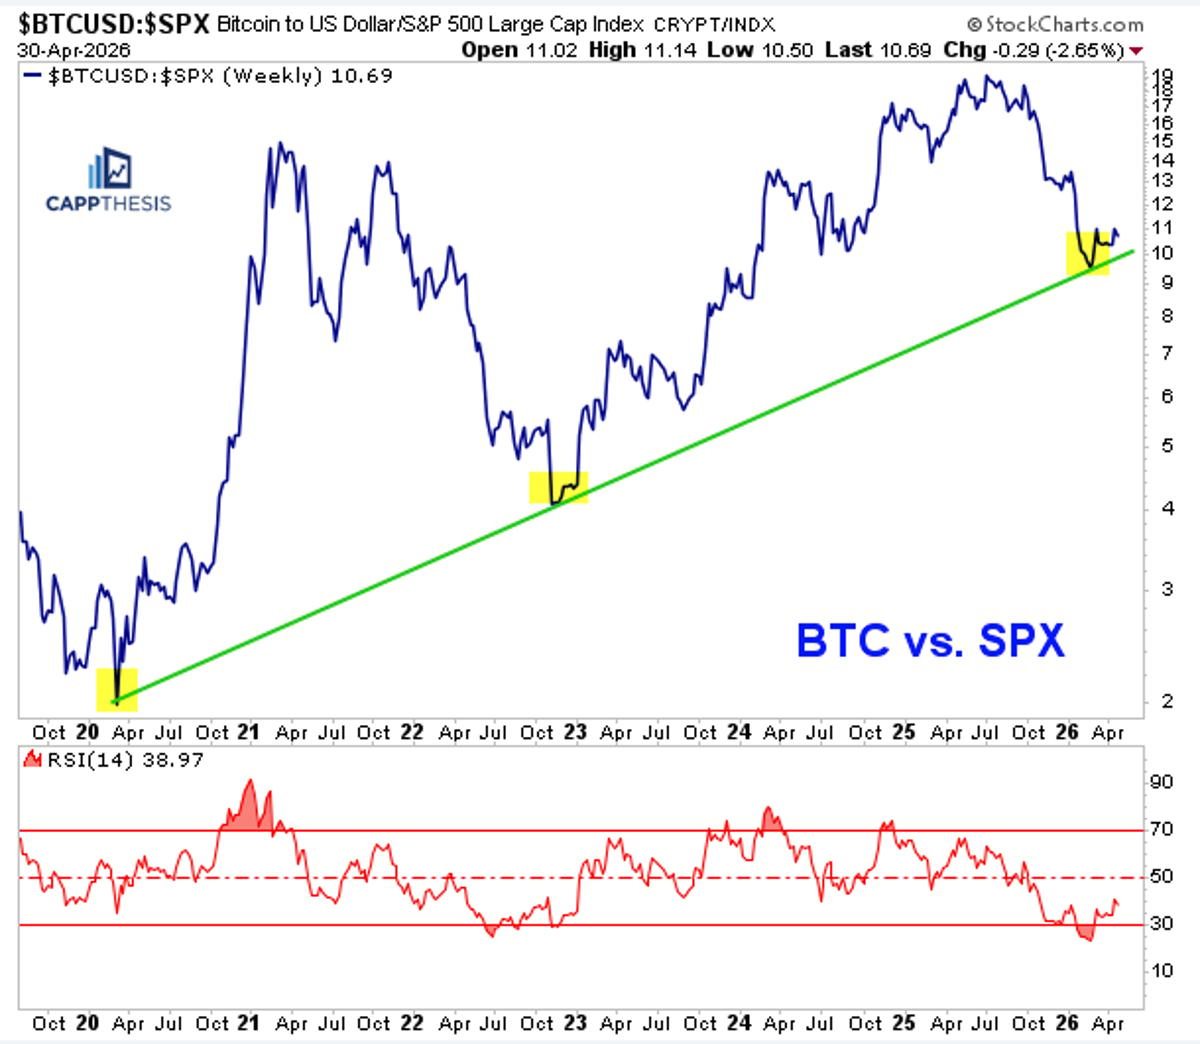
Bitcoin Vs. S&P 500 Near Critical Support Level
Bitcoin relative to the S&P 500 is down near potential support. Very interesting one from @FrankCappelleri in his note this AM. https://t.co/Qas4p5Pchb

AAPL Implied Move Undercuts Historical Average
$AAPL implied move shows 3.01% from one source, 3.1% from another and a final source showing 3.85%. The info can shift slightly into the close. Stats from the past show it ranges from 3.5-5% thus...
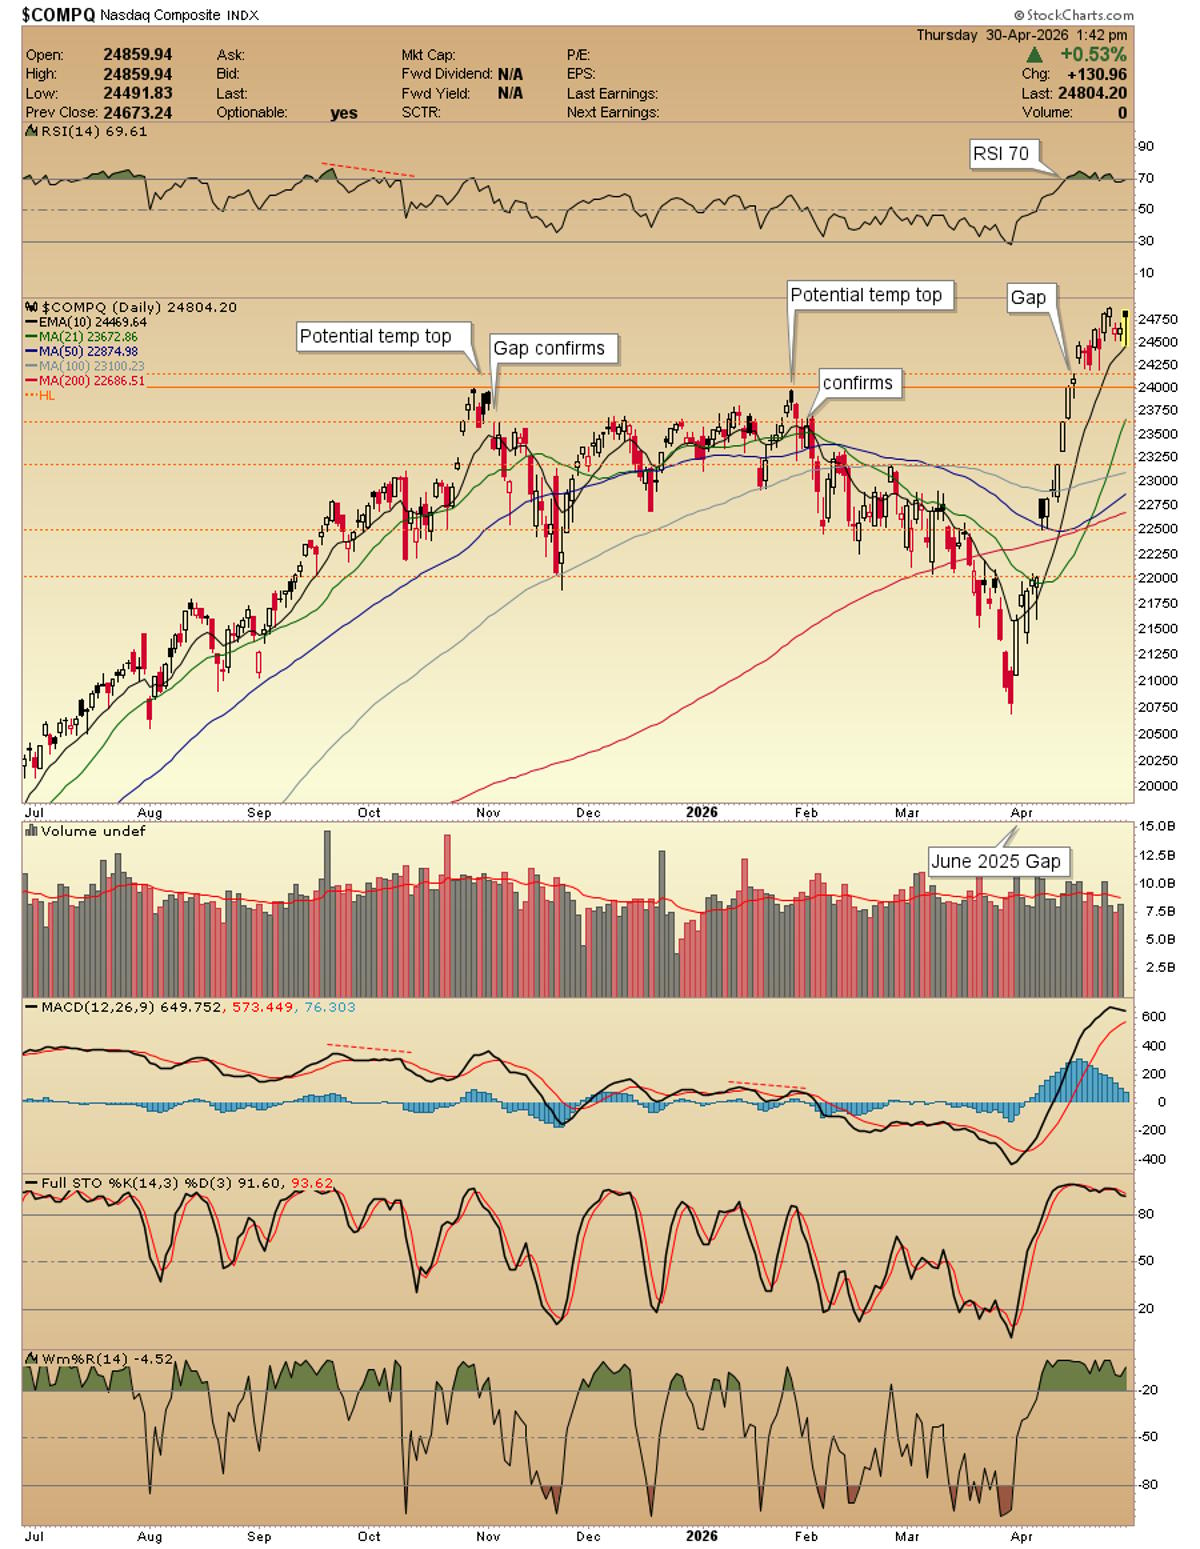
COMPQ Overbought; Awaiting Pullback Before New Entries
$COMPQ daily still stretched/overbought/extended. Pullback basing or sideways action needed. When? No one knows. It is this chart that has me being very selective with new positions and moving stops hire if appropriate. https://t.co/eq078DEtS1