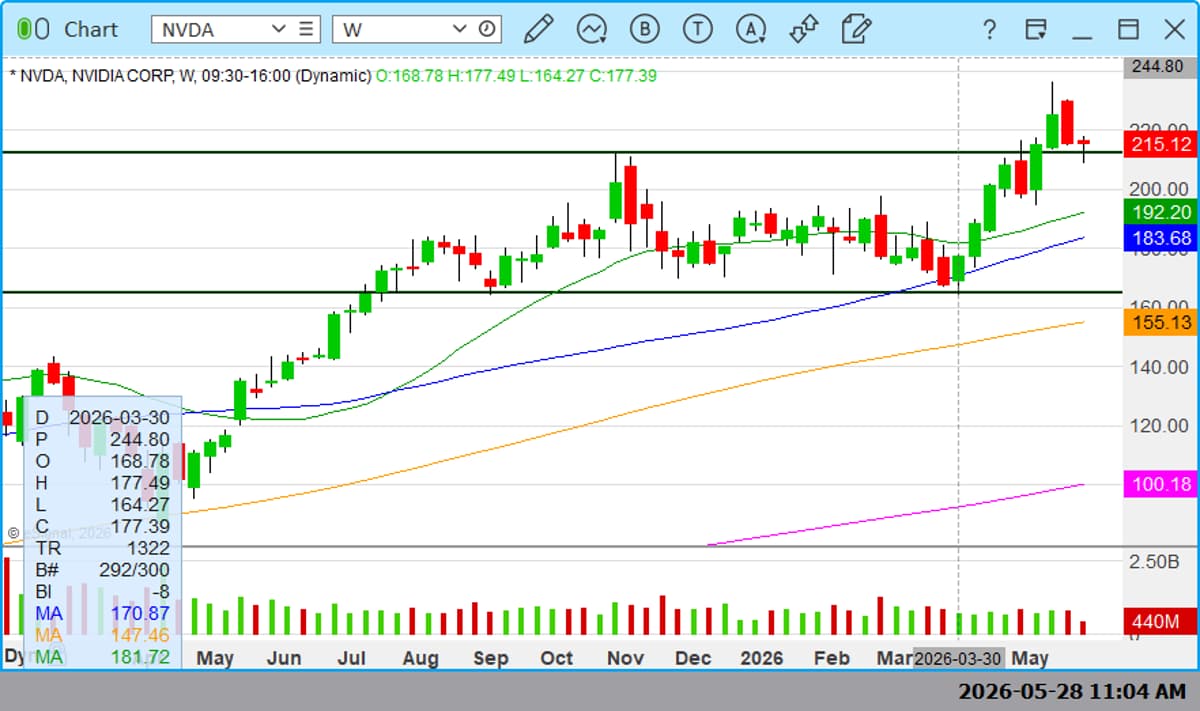
NVDA Targets Support Retest, Watch Candle Close Tomorrow
This has potential as $NVDA trying to pass the retest on support -- see how candle closes tomorrow but if you want it stop is 210 zone https://t.co/QIjL7FtYK2
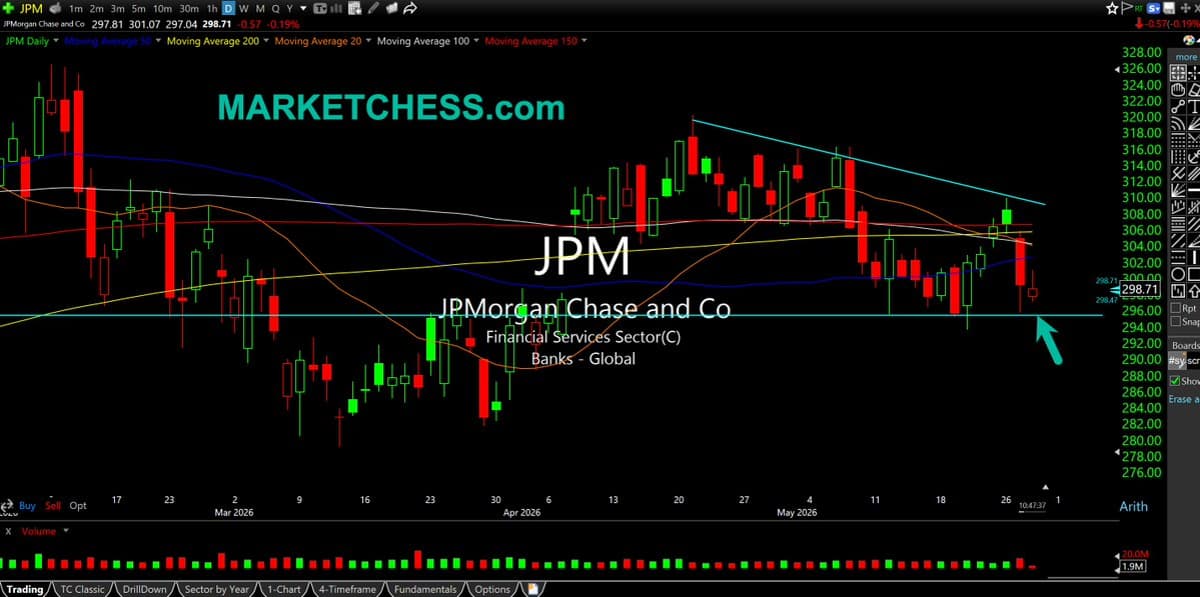
Big Banks Falter: Chase Rejects 200‑Day Trend
$JPM Daily. Big banks quietly weak again, with tons of distractions elsewhere. Chase continues to be suspiciously weak too, rejected at 200-day moving average. High profile CEO. Leading sector down? https://t.co/3kymXO5VLY

MRVL Put Spread Set to Bust
$MRVL "Trade Idea 1: Buy the May 29 Expiry 200/190-185 1×2 Put Spread for a 15 cent credit." looks to expire a bust
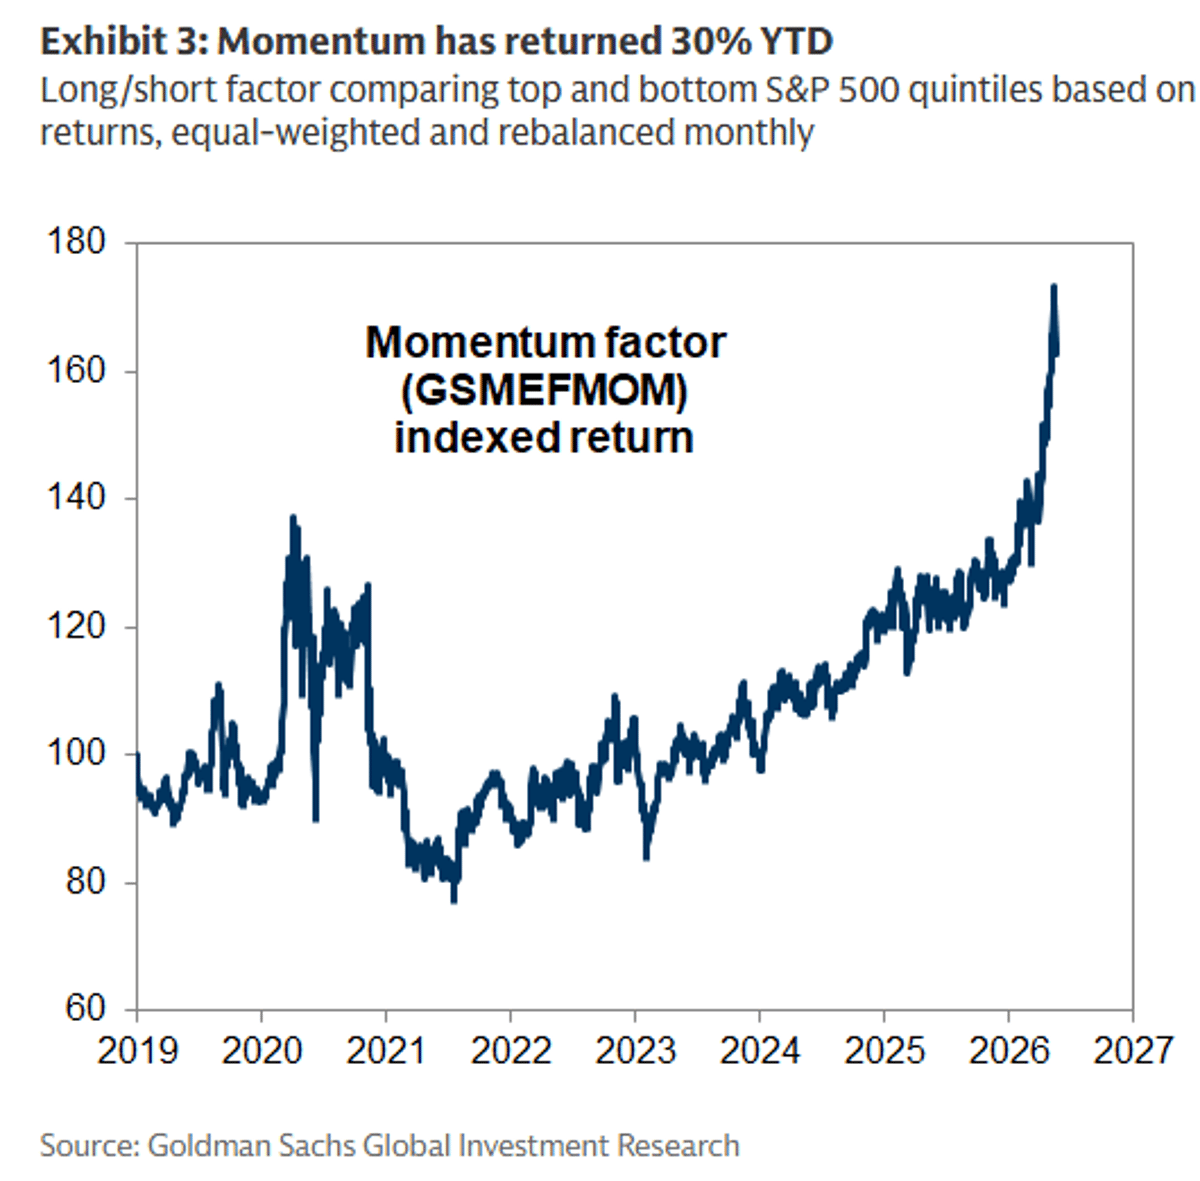
Momentum Factor Delivers Record-Strong Returns Recently
GS: Our equal-weight, long/short Momentum factor has generated one of its strongest returns on record during the last few months. https://t.co/8HBVQJHeDJ
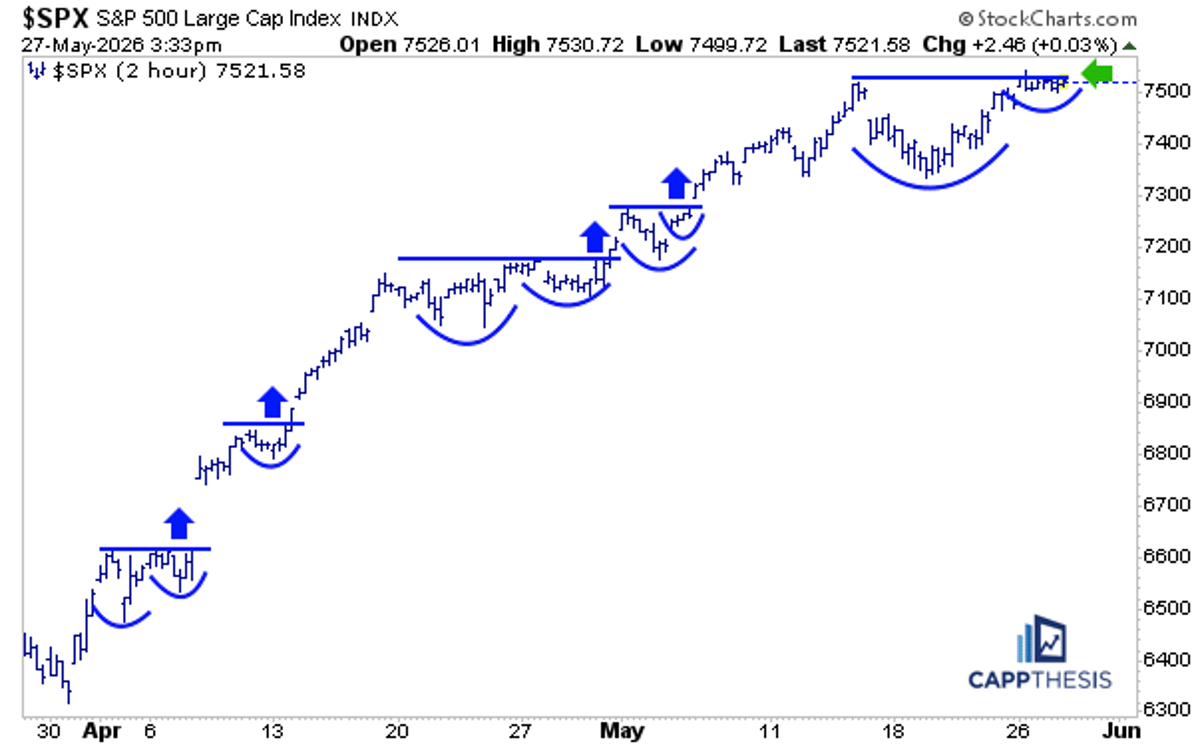
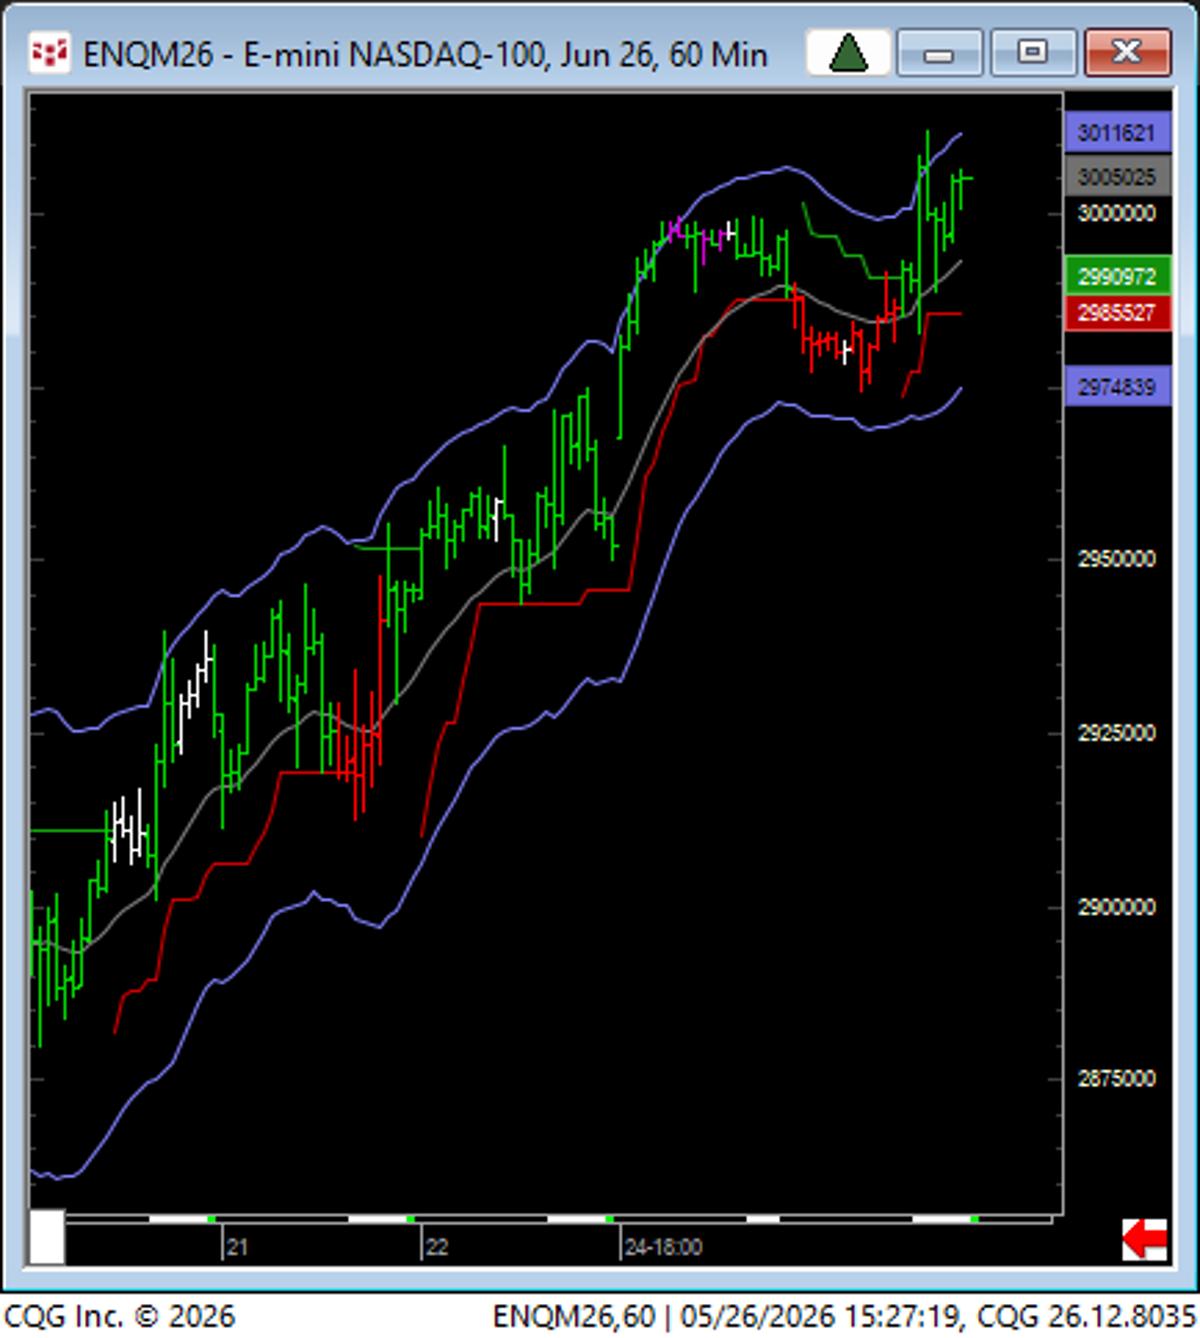
SPX Uptrend Powered by Sequential Bullish Breakouts
$SPX - The move higher may feel like a straight line, but this 2-hour chart shows the uptrend has actually been built through a series of short-term bullish pattern breakouts. Each consolidation has helped fuel the next leg higher… and now...
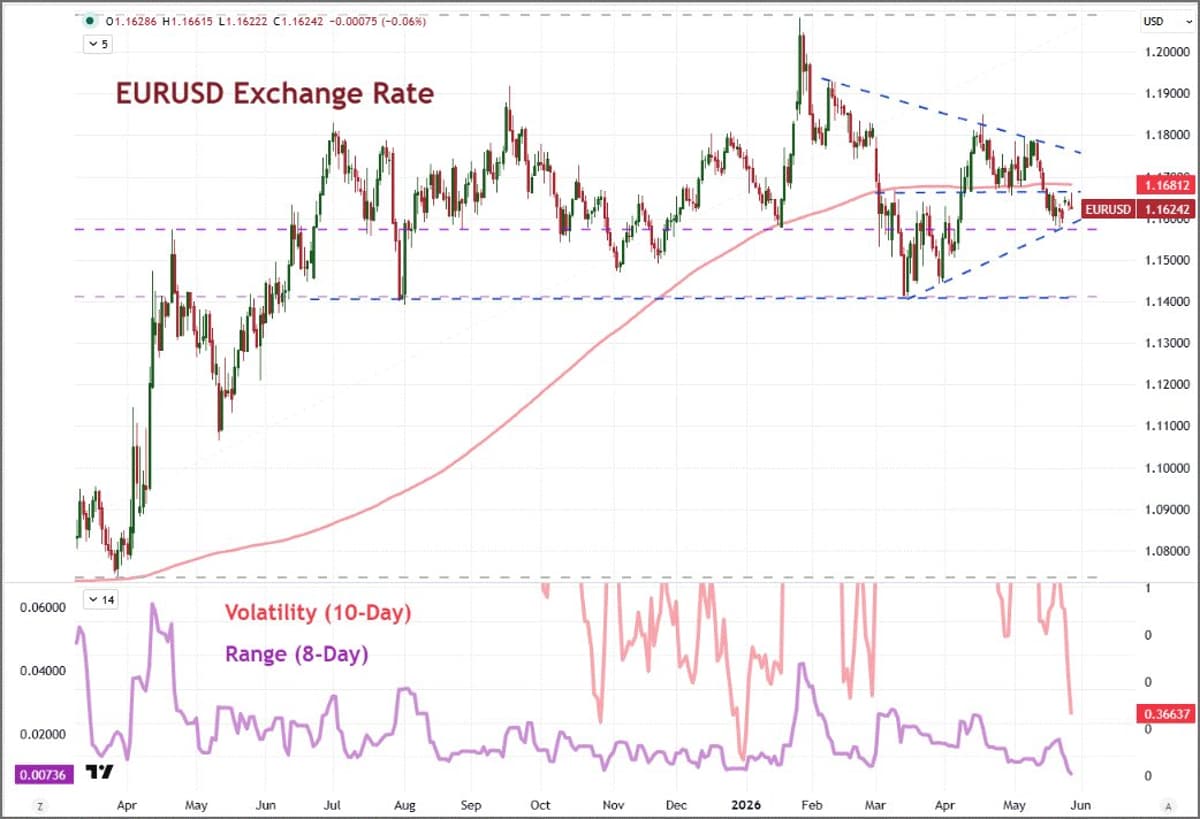
EURUSD Hits 12-Year Low Volatility; PCE May Spark Move
EURUSD is hitting extreme levels of quiet. Its 10-day ATR is the lowest since Jan 2nd (0.37%) and the rolling 8-day range - as percentage of spot - is the lowest in 12 years (0.74%). What can provide a break...
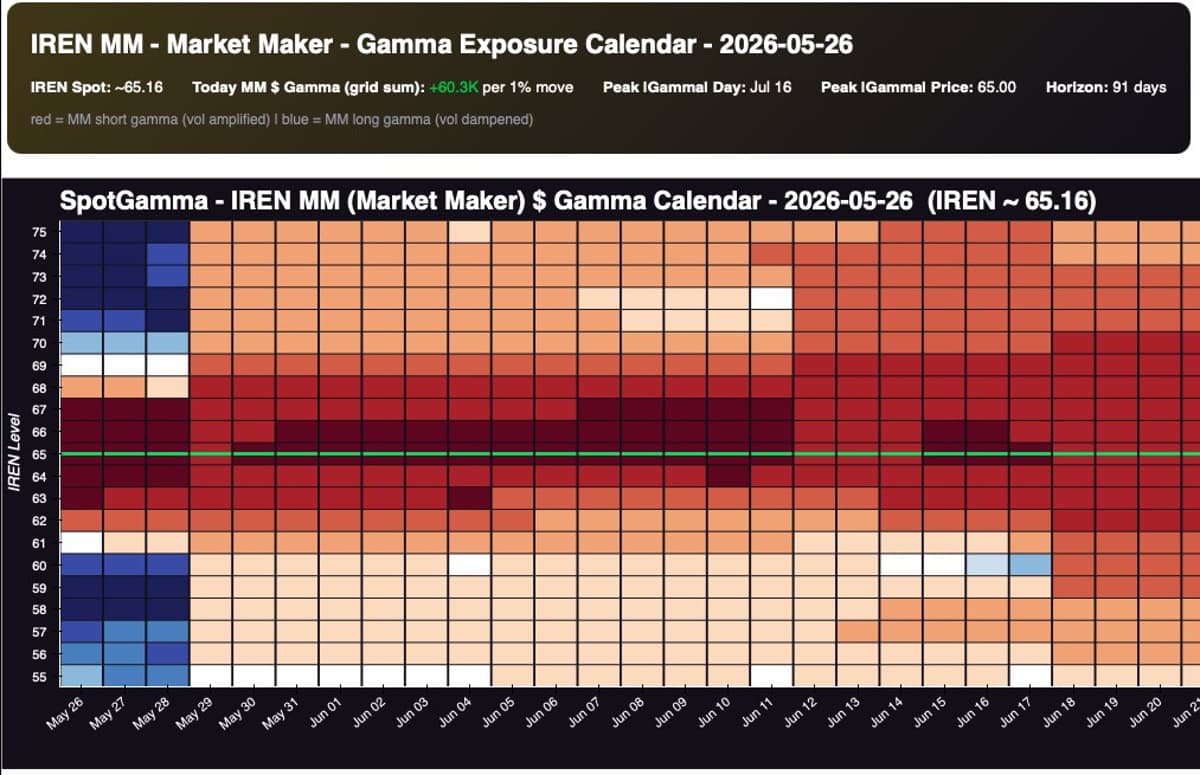
IREN Near Bottom of Negative Gamma Pocket, $60 Support Holds
$IREN halfway through the negative gamma pocket...it has support at $60 thru to Friday night. https://t.co/hUlCDzT6Hq
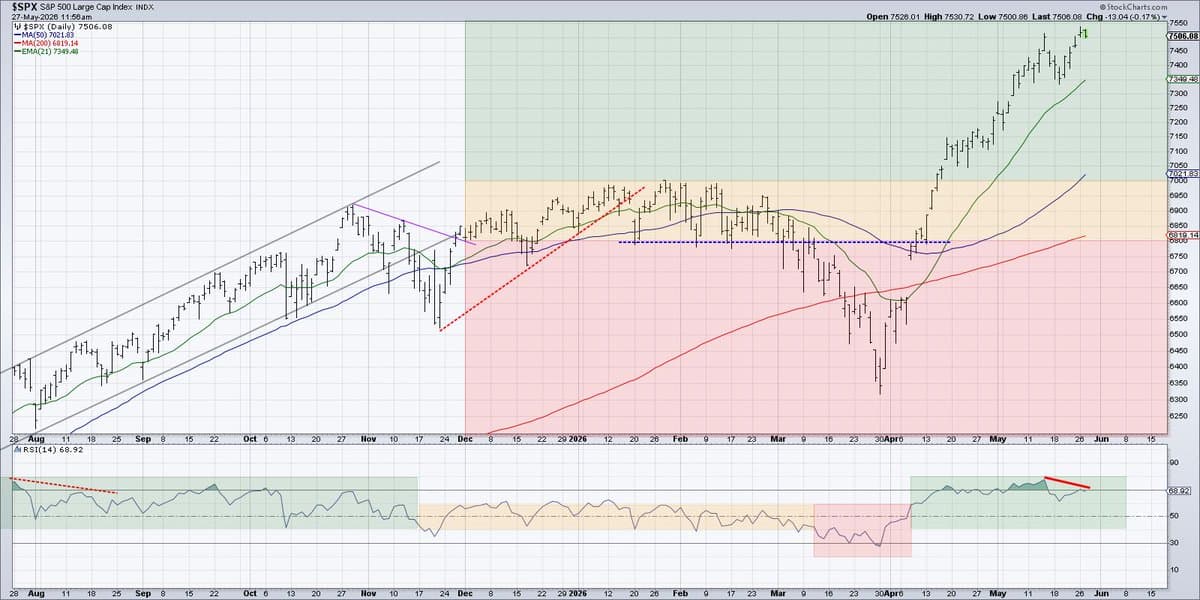
Potential Bearish Momentum Divergence Threatens SPX Rally
Detecting a potential bearish momentum divergence for $SPX... how much of an issue will that be? https://t.co/bOGaKTyfHO
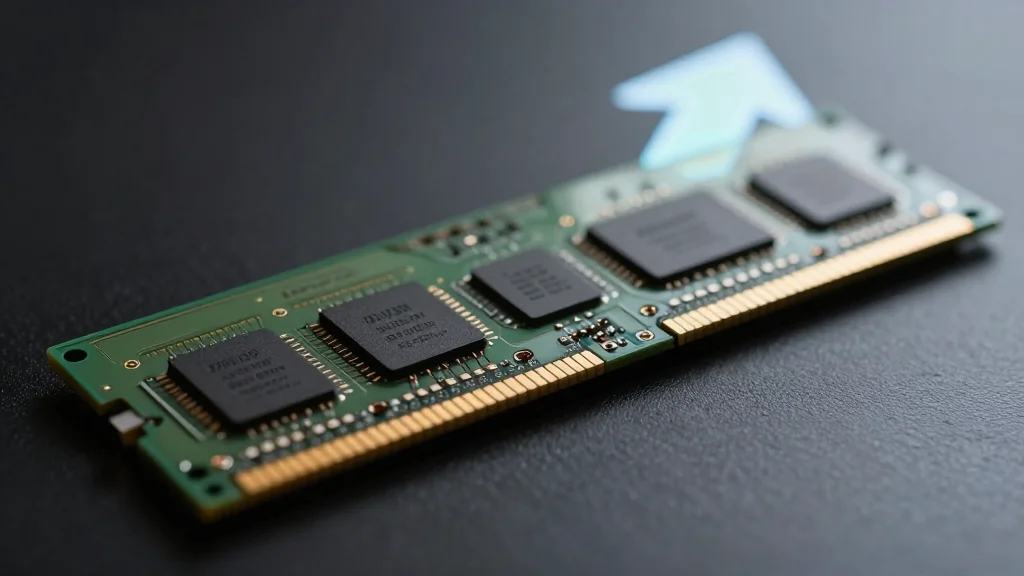
AI Memory Boom Propels Micron Toward $1T Valuation
AI memory supercycle lifts Micron to $1T; LTAs, structural supply deficit and 81% gross margins drive secular re-rating. Risks: insider sales, concentration. Trading insight: overweight MU — buy on <5% pullback. 📈 — Viktor Kopylov, PhD, CFA More insights: t.me/si14Kopylov
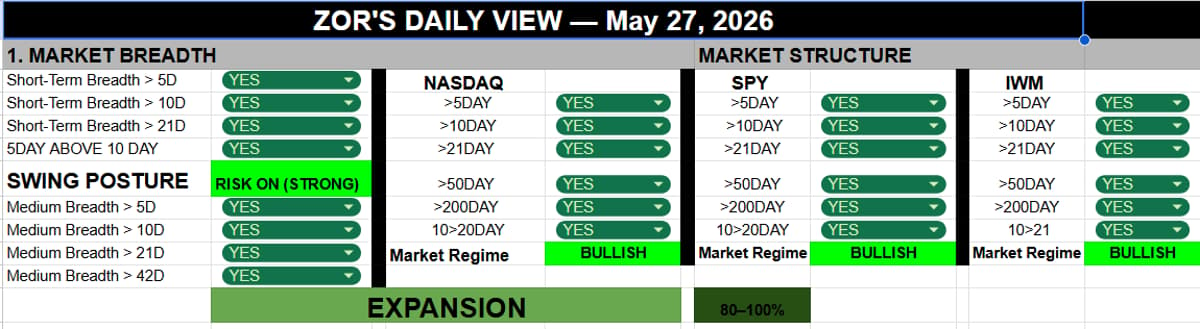
Day 5 Breadth Flip Sparks Four-Day Index Rally
We are on day 5 of the most recent breadth flip. It has been a REALLY good one for swings. The indices are now up for 4 days in a row and gapping higher today on the 5th day. Trim...
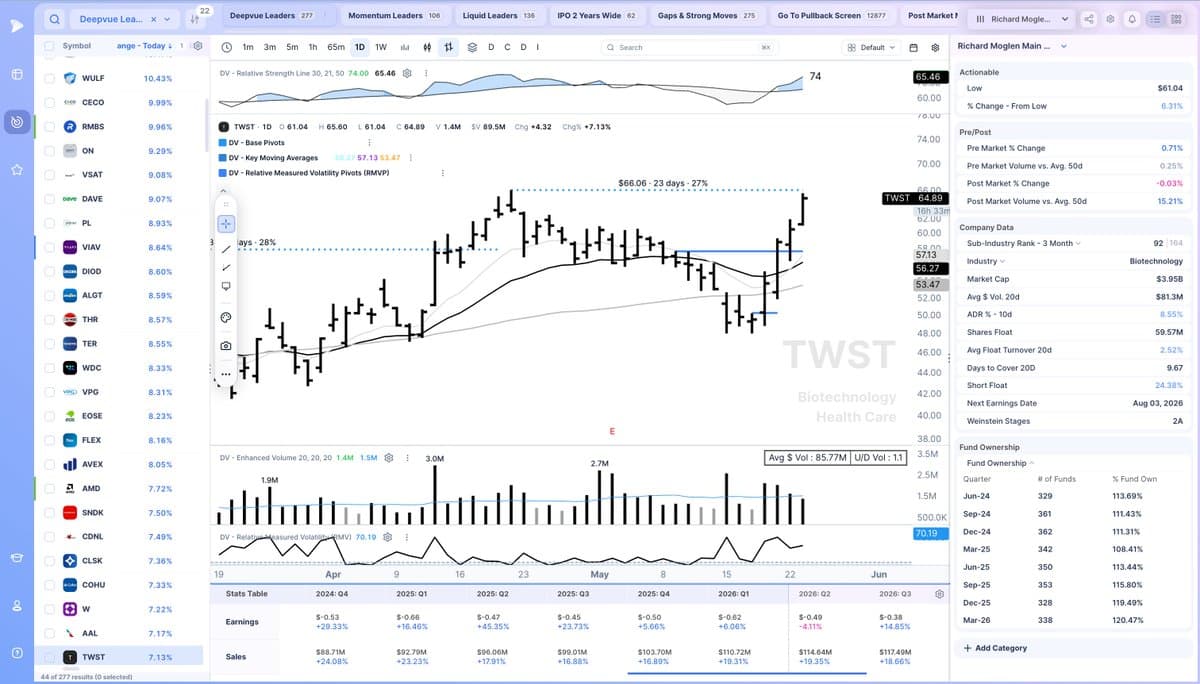
TWST Shows Strength, Pausing Before Base Breakout
$TWST powerful from the bottoming range breakout Ideally rests before the base breakout attempt https://t.co/kQ2aDR7mNj
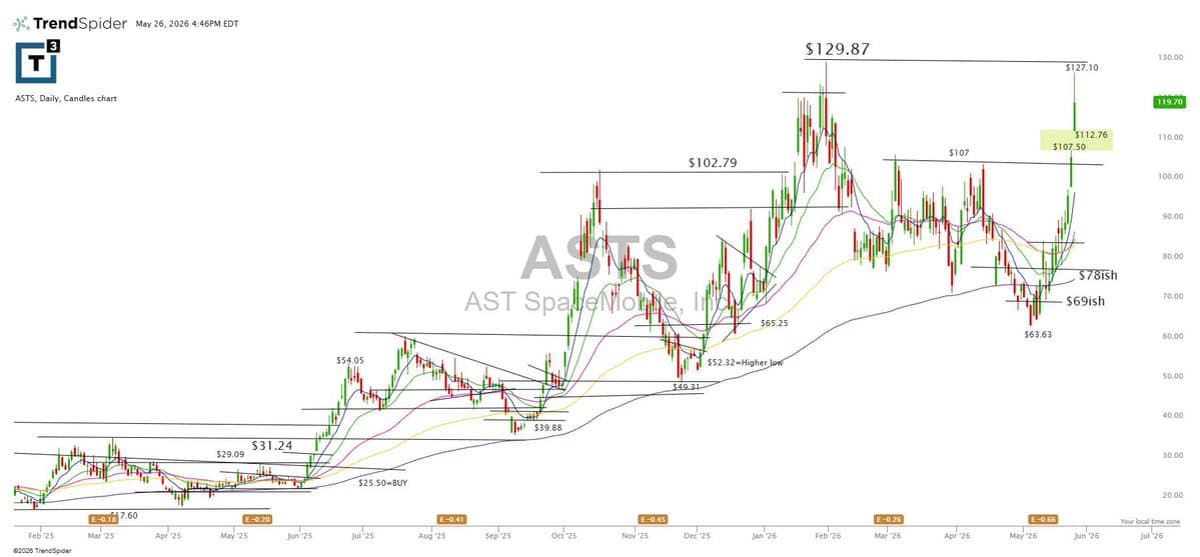
ASTS Pauses Near ATH Pivot, $80 Swing‑buy Target
$asts is allowed to take a pause at first kiss area of ATH Pivot. $80 was the new swing buy. Would love to see it digest a bit now https://t.co/QrGnoBWd9C
RZLO Structure Guides Aggressive vs Conservative
Here you can appreciate the beauty of the RZLO after fact. 1) just have structure ( swing highs and low that form trend), 2) aggressive traders can position and then wait for trail stop to kick in. 3)...
MRLN's Early Squeeze Faded; Trade Now Stop‑loss Free
$MRLN got some squeeze action early in the day and faded. No green to red stops now on my trade.
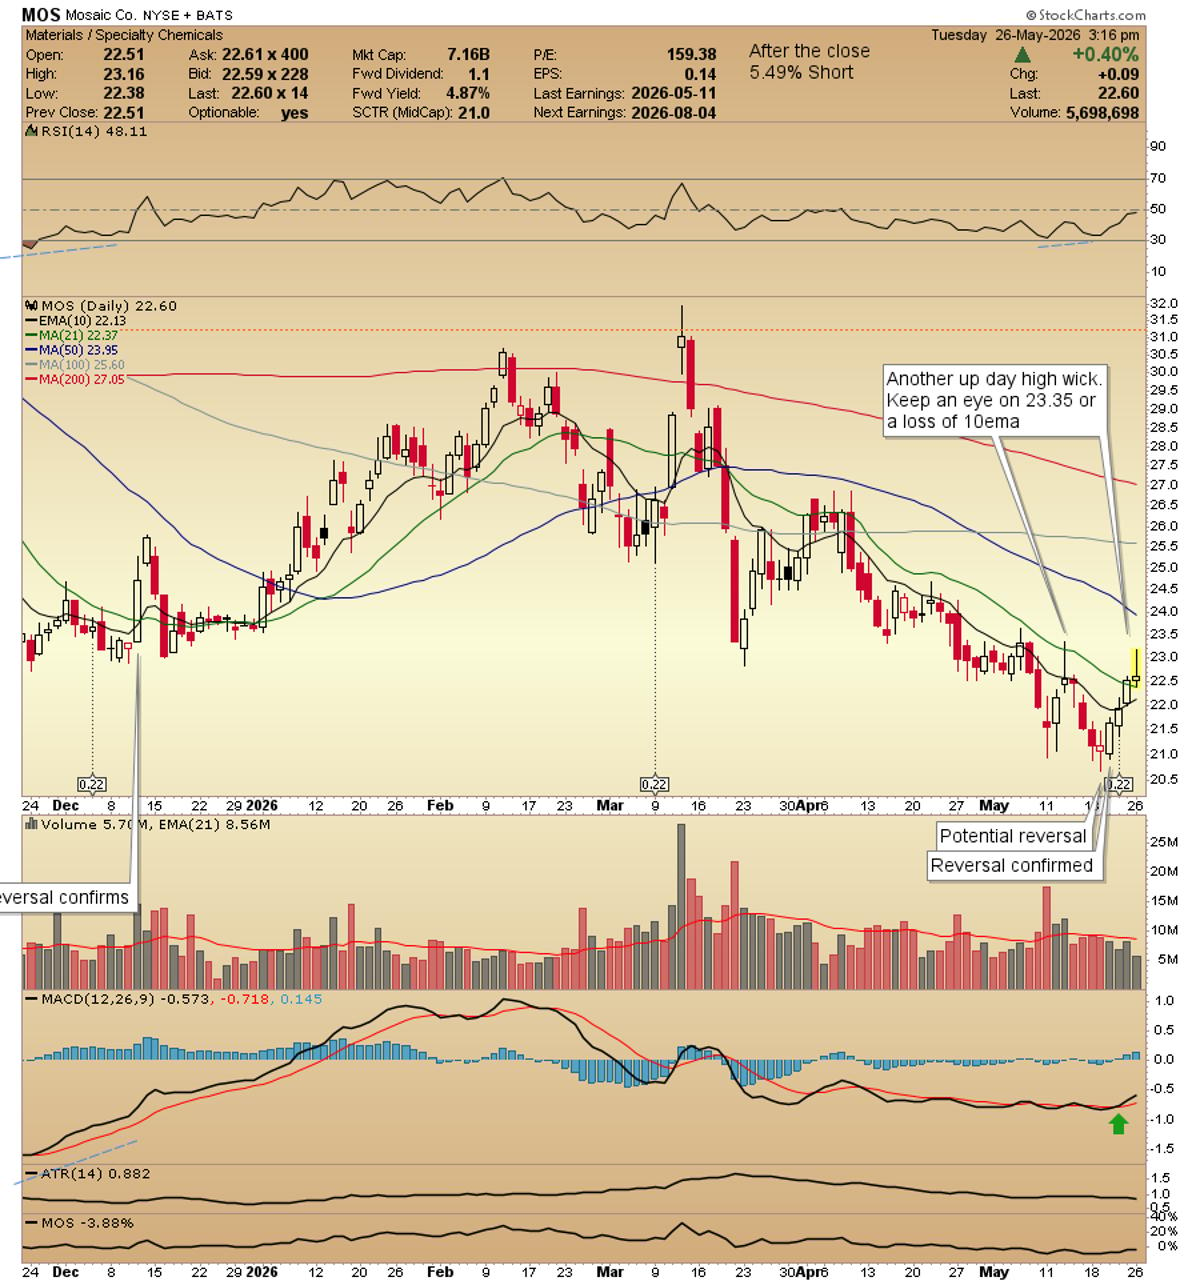
MOS 4 up Days Stall, ATR Below Threshold
$MOS 4 up days and stalling so far today. Slower mover note ATR(14) below. No green to red on all stops now https://t.co/Ow6xDrHGAg
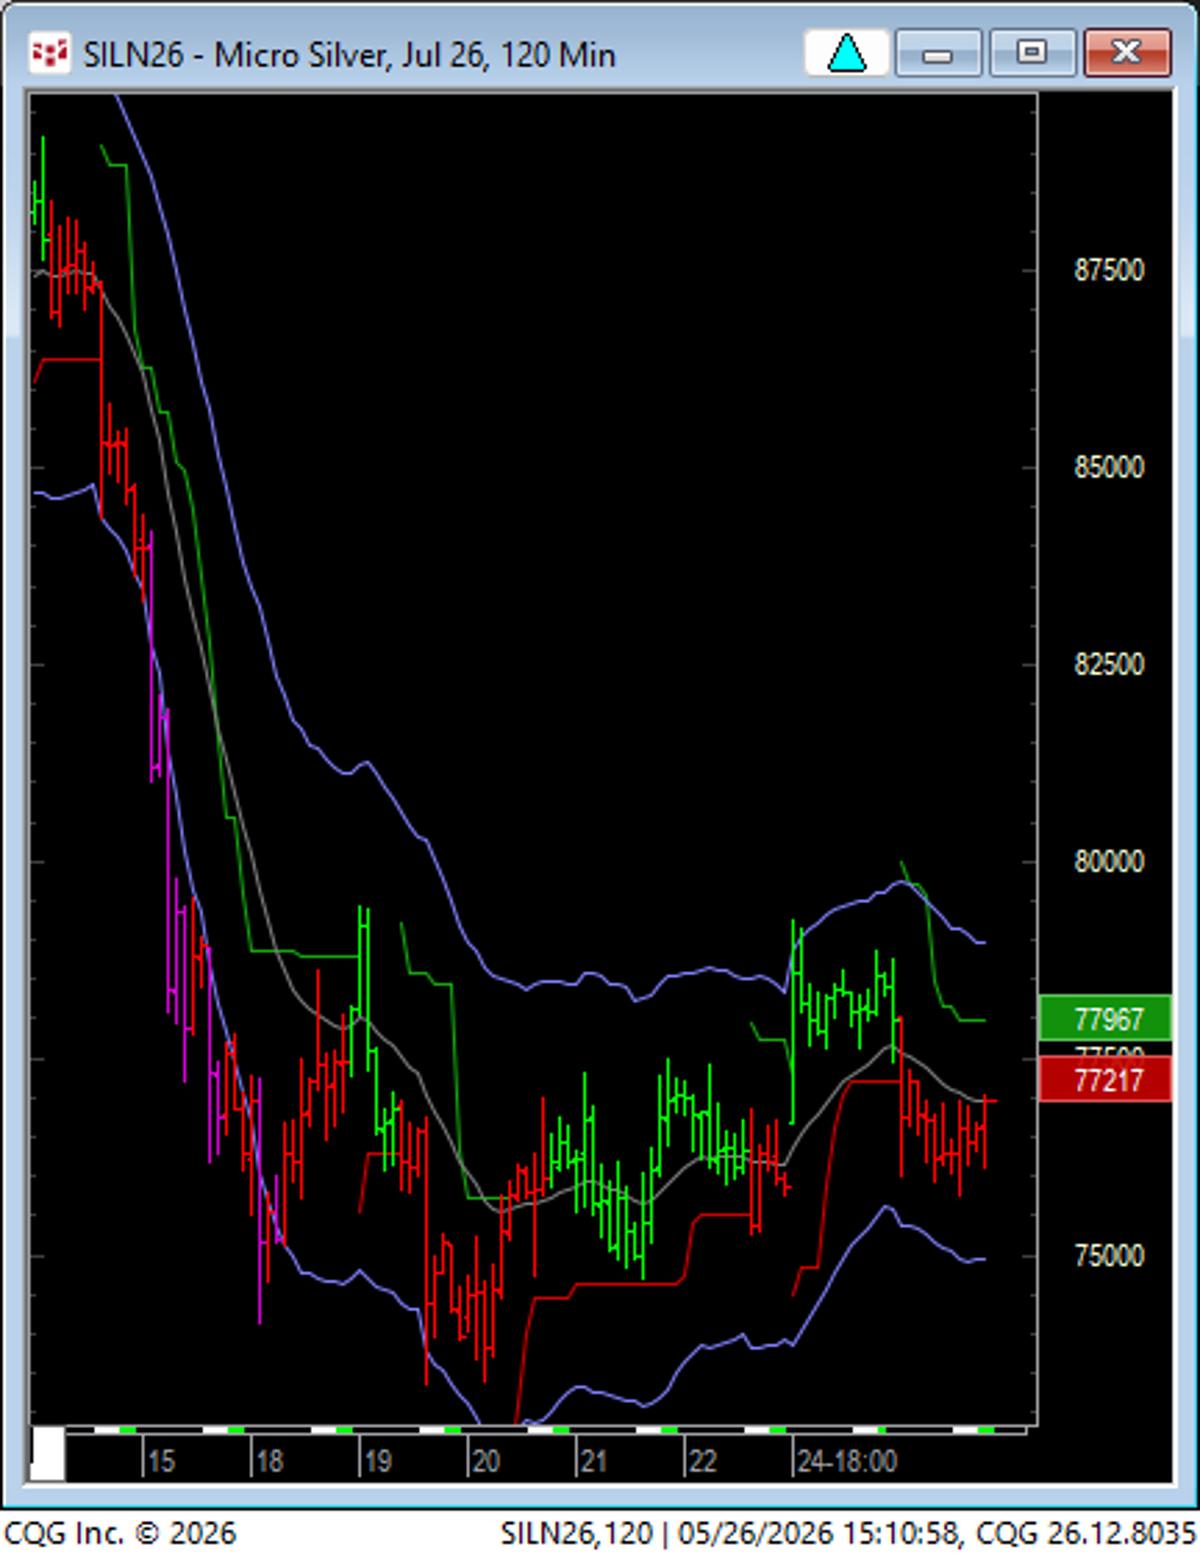
Tighter Volatility Signals Potential Silver Upside Breakout
Vol ATR a bit tighter....SI can have upside BO from short term coil - there is a nice TAIL to eat... https://t.co/OF9DGA1XgP
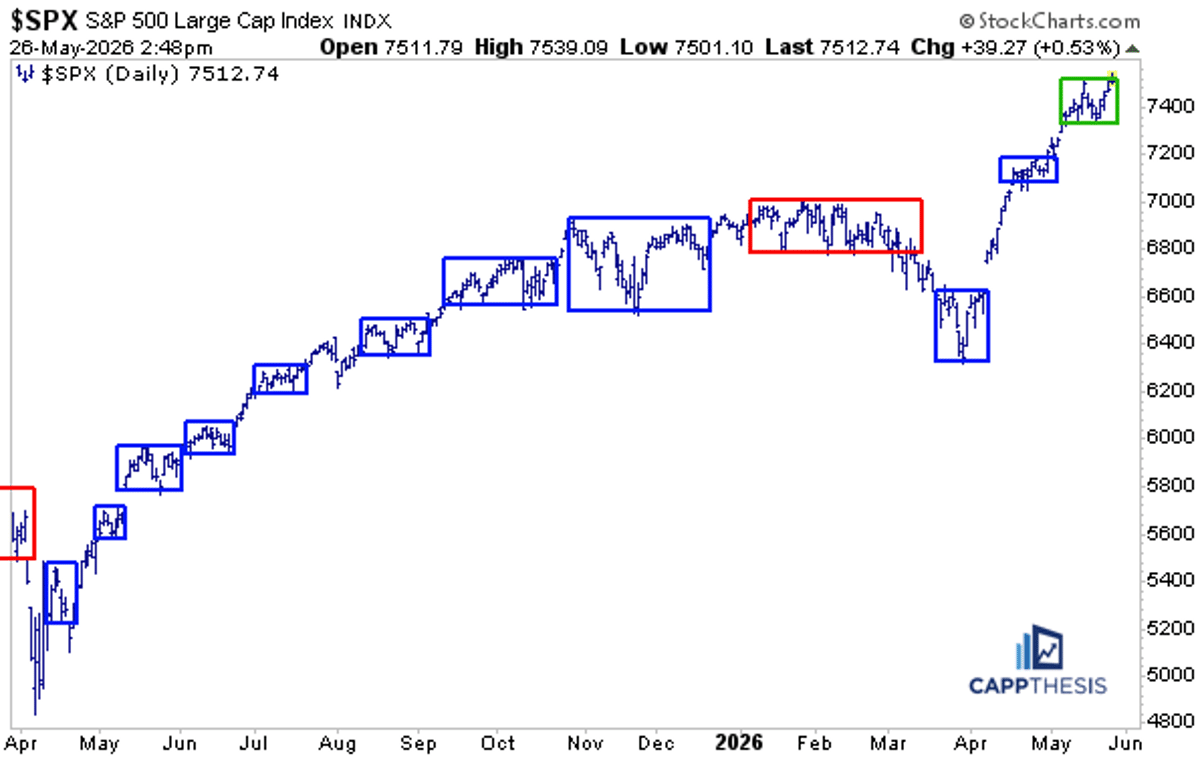
S&P 500 Poised to Break Trading Box, Sustaining Uptrend
$SPX flirting with punching above its latest trading box — a defining trait of the market’s uptrend from April–December ’25. They haven’t been quite as tight this time around, but leveraging these digestive phases will be necessary again for this run...
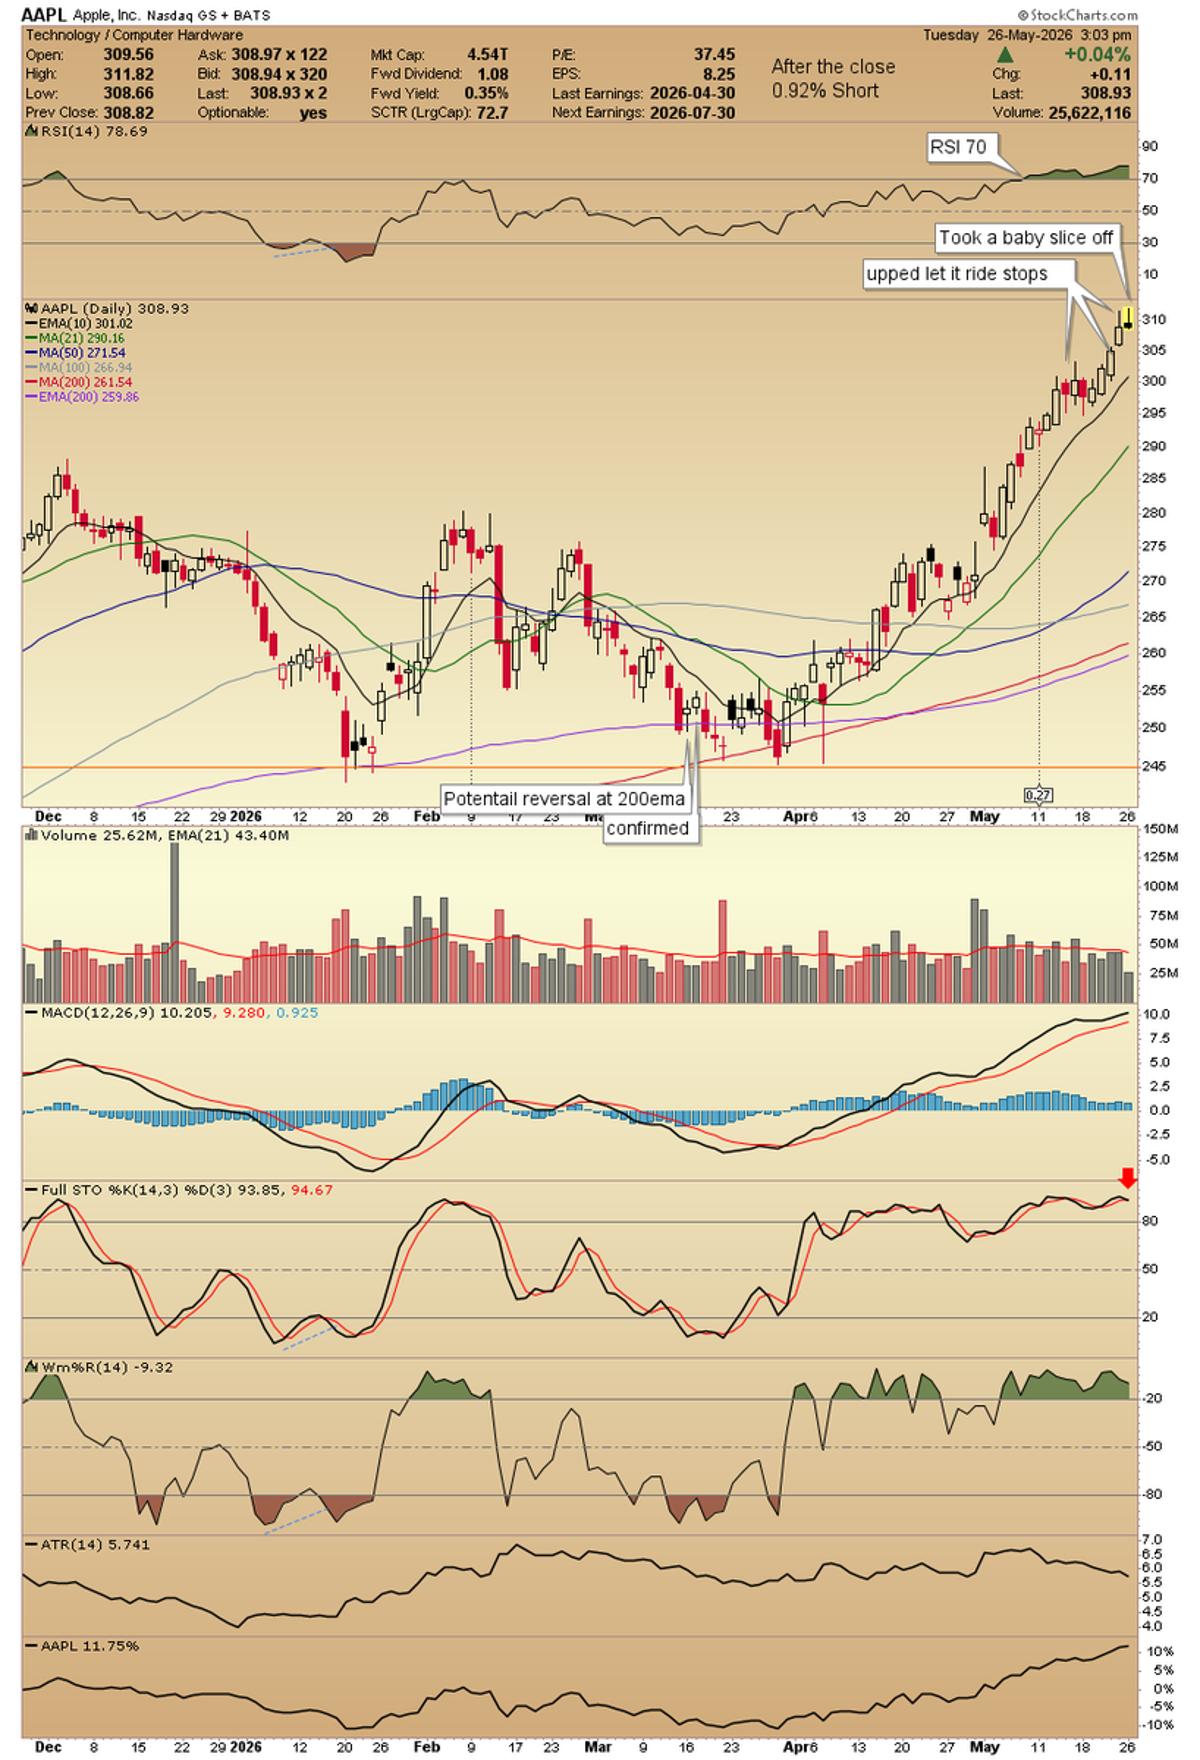
Apple’s Tiny Pullback Yields Profit, Still Holding
$AAPL took a baby slice off from the let it rides and upped all other stops. 2 long wicks at 78+ RSI and a stochastic roll down. I still own plenty of shares. Made excellent profit on...
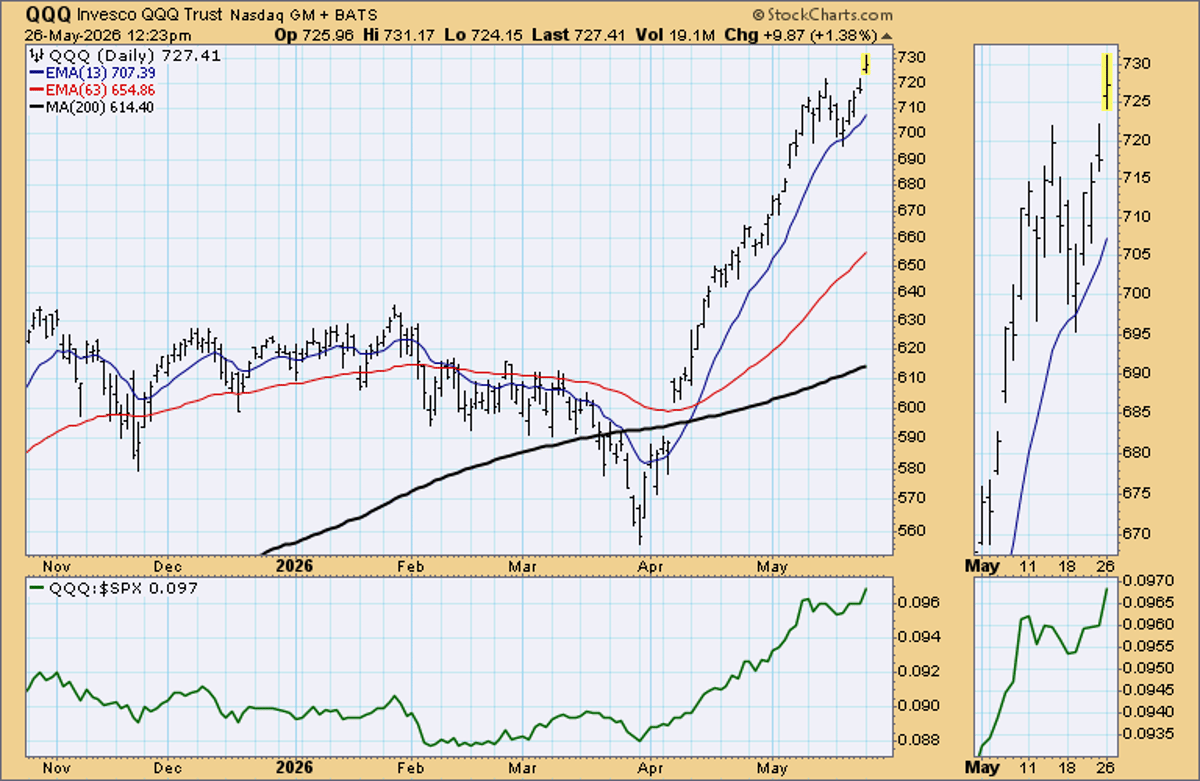
QQQ Gap Fill Timing Signals Trend Strength
$QQQ would have to decline to 722.12 to fill this morning’s gap. (There’s no gap in $SPY.) How quickly it gets filled -- if at all – gives us an idea of how strong the underlying trend is; we already...
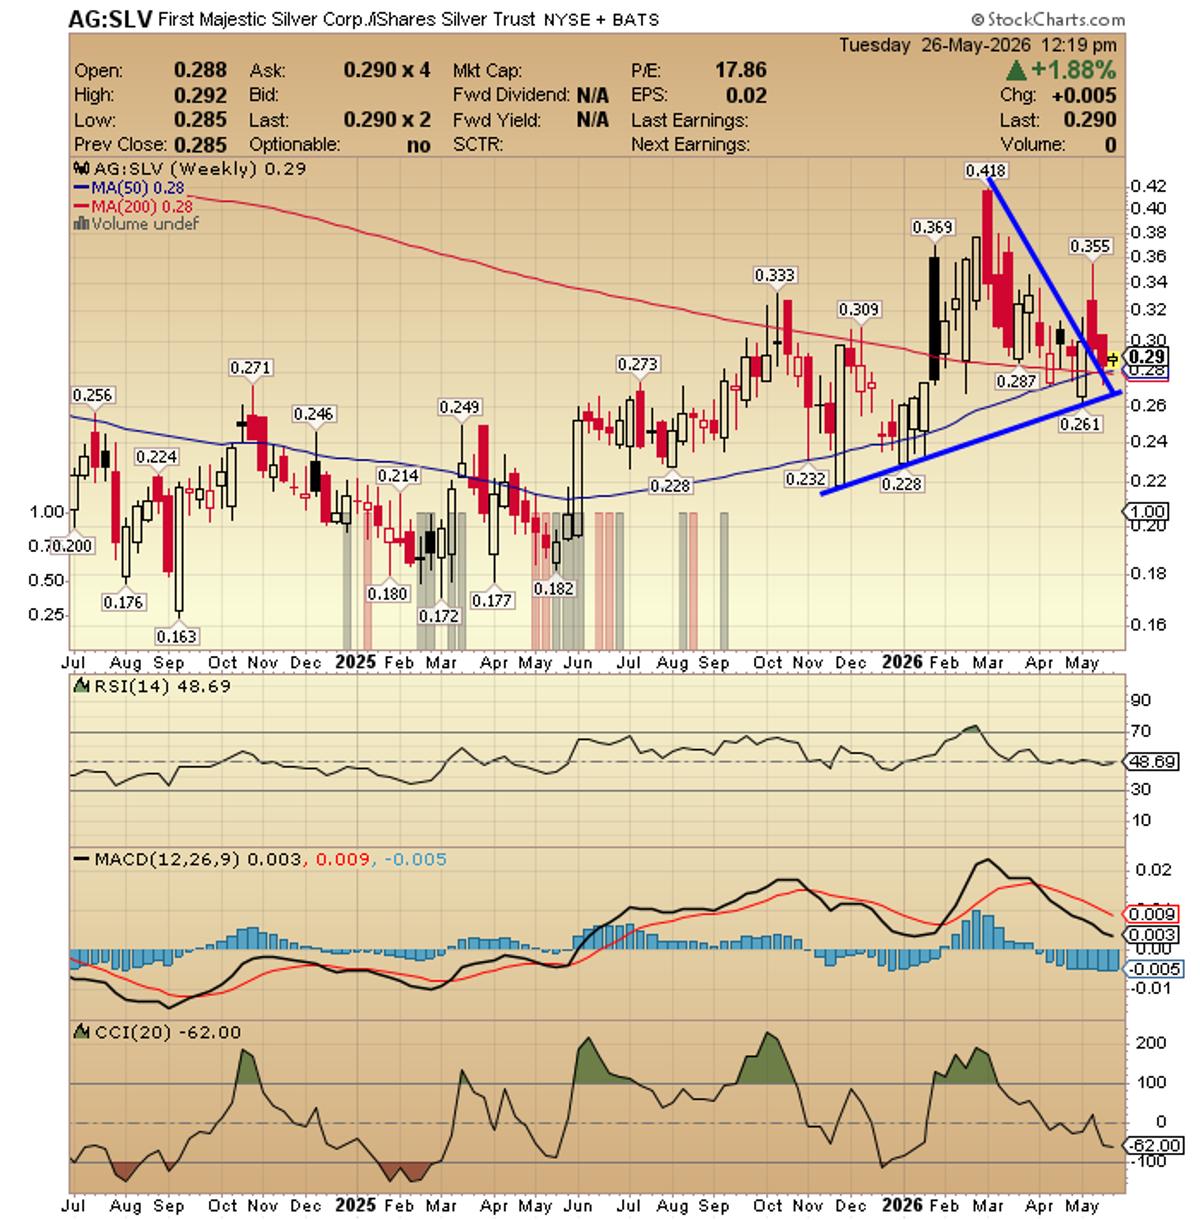
Silver and Miners Poised for June Upswing
First Majestic Silver $AG vs Price of Silver $SLV. A key chart to watch ... as I expect Silver and miners to turn up in June. https://t.co/Sbjworl8Lh
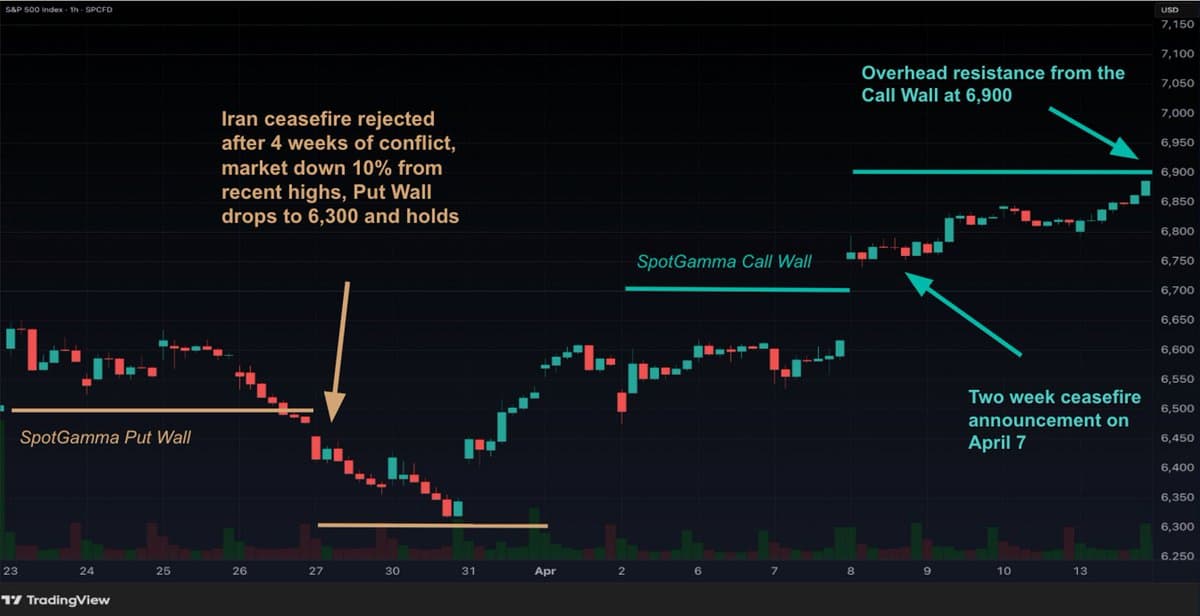
SpotGamma Reveals When News‑Driven Momentum Will End
When major news drives the market, how can you tell where the momentum will stop? SpotGamma's key levels reveal where price is likely to stall or reverse — learn more at Playing Against the House, our free webinar on Wednesday...
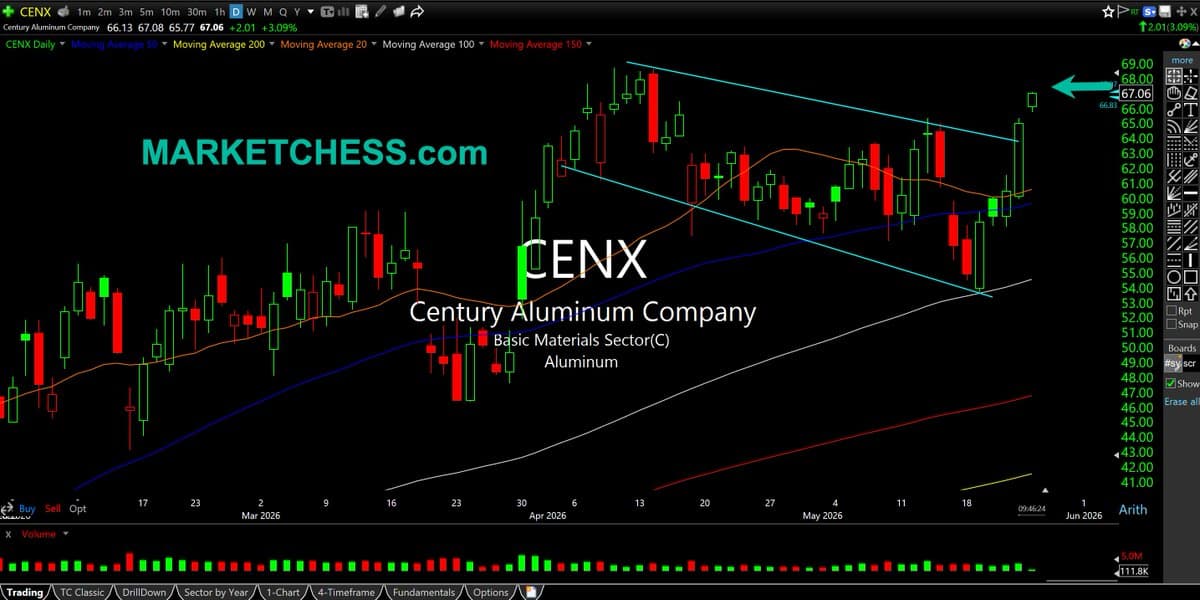
Century Set for Spring Breakout After Consolidation
$CENX Daily. Aluminum plays out of the gate nicely. Two-month consolidation for Century here, threatening fresh breakout in a strong sector this spring. https://t.co/GyLgvy8FHp
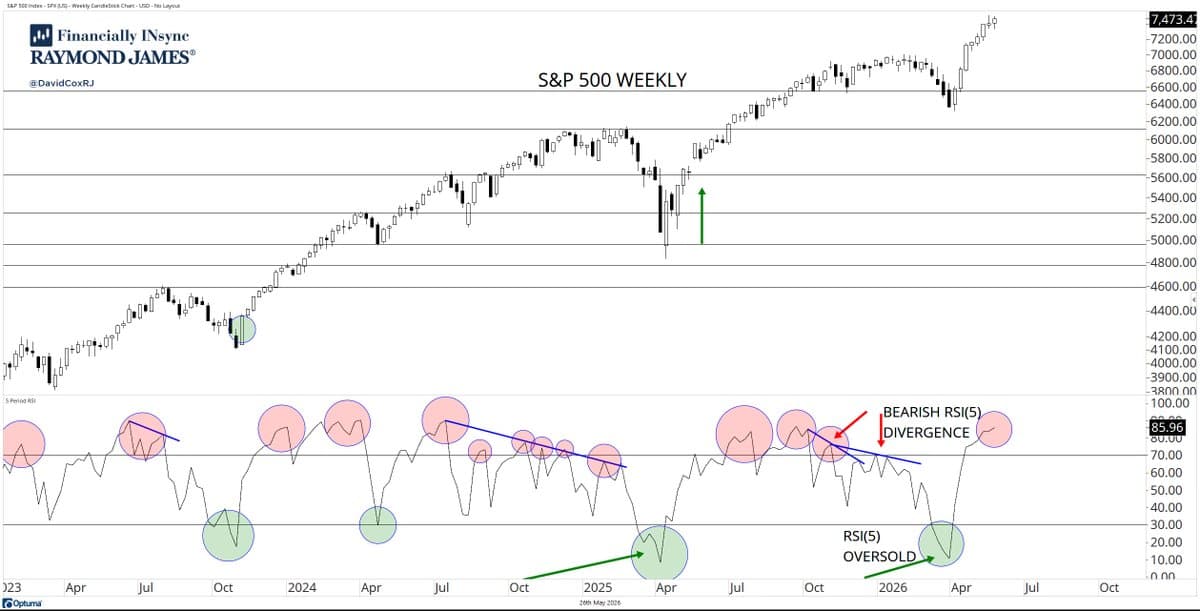
Mid‑2025 Bearish Divergences Shift to Early‑2026 Sell‑off
S&P 500 $SPX weekly... the mid '25 bearish divergences gave way to early '26 selling and the buyers made their stance clear as mud (since)... https://t.co/QmsIYxsTER

Sell Into Strength as Market Extends Beyond Resistance
📺 TIME TO SELL INTO STRENGTH? + $AMZN, $GOOGL & $ASTS CATCH-UP TRADES The market is becoming increasingly extended after a powerful rally off the April lows. It reclaimed the 8/21-day MAs after April 7th and has largely stayed above them...
Space IPO Hype Fuels Rally Amid Oil Dip
Oil gapping down despite US strikes on hopes of a deal. The rally in space stocks continues as the approaching SpaceX IPO gets more and more real. Chips stay ahead of the game as $MRVL reports tomorrow after the bell....
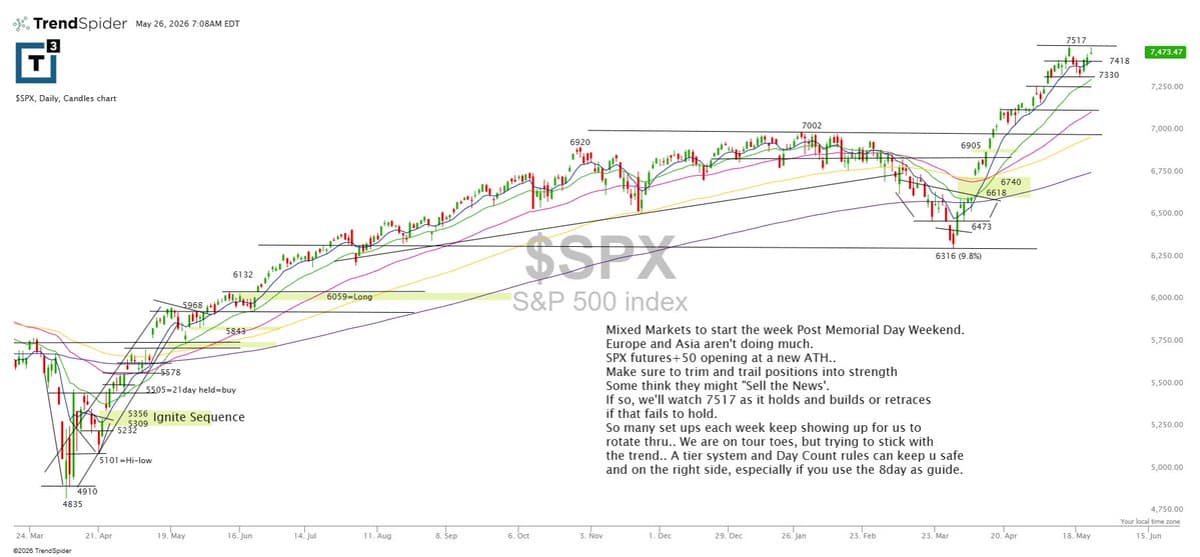
SPX Opens +50, 7517 Key for Uptrend Continuation
$SPX is opening about +50 at a new all-time high. 7517 is the key level to watch-if it holds and builds, the uptrend stays intact. If it fails, a retrace could bring 7418 into play first, with 7330 as the...
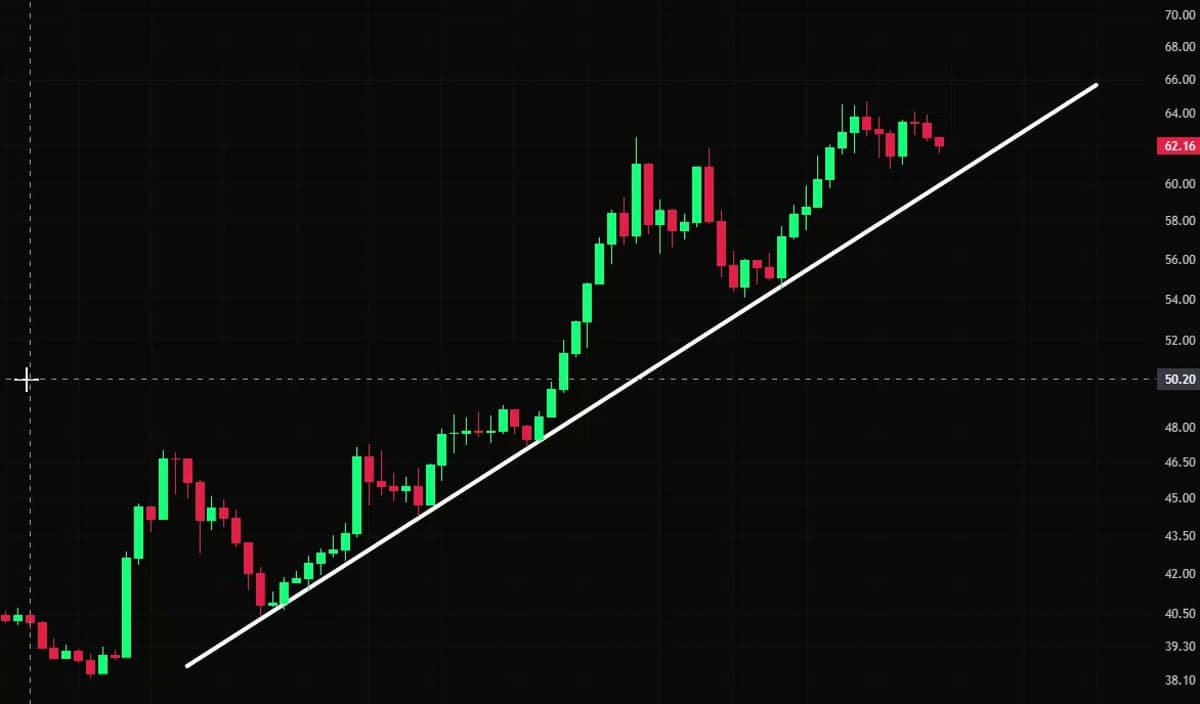
Hype Holds Support; Upside Move Likely If Unbroken
$HYPE IS HOLDING THE ASCENDING TRENDLINE SUPPORT If support holds, we could see a continuation to the upside. If not, a correction may follow. Watching closely https://t.co/J6M6dn5Z9h

Target Low‑Risk Leaders via Pullbacks, Ranges, Shakeouts
Early in a new uptrend, when leaders that have already revealed themselves form a new low risk area, you want to focus on those for entries: ✅ Moving Average Pullbacks ✅ Tight ranges ✅ Shakeouts You want to focus on working yourself into the...
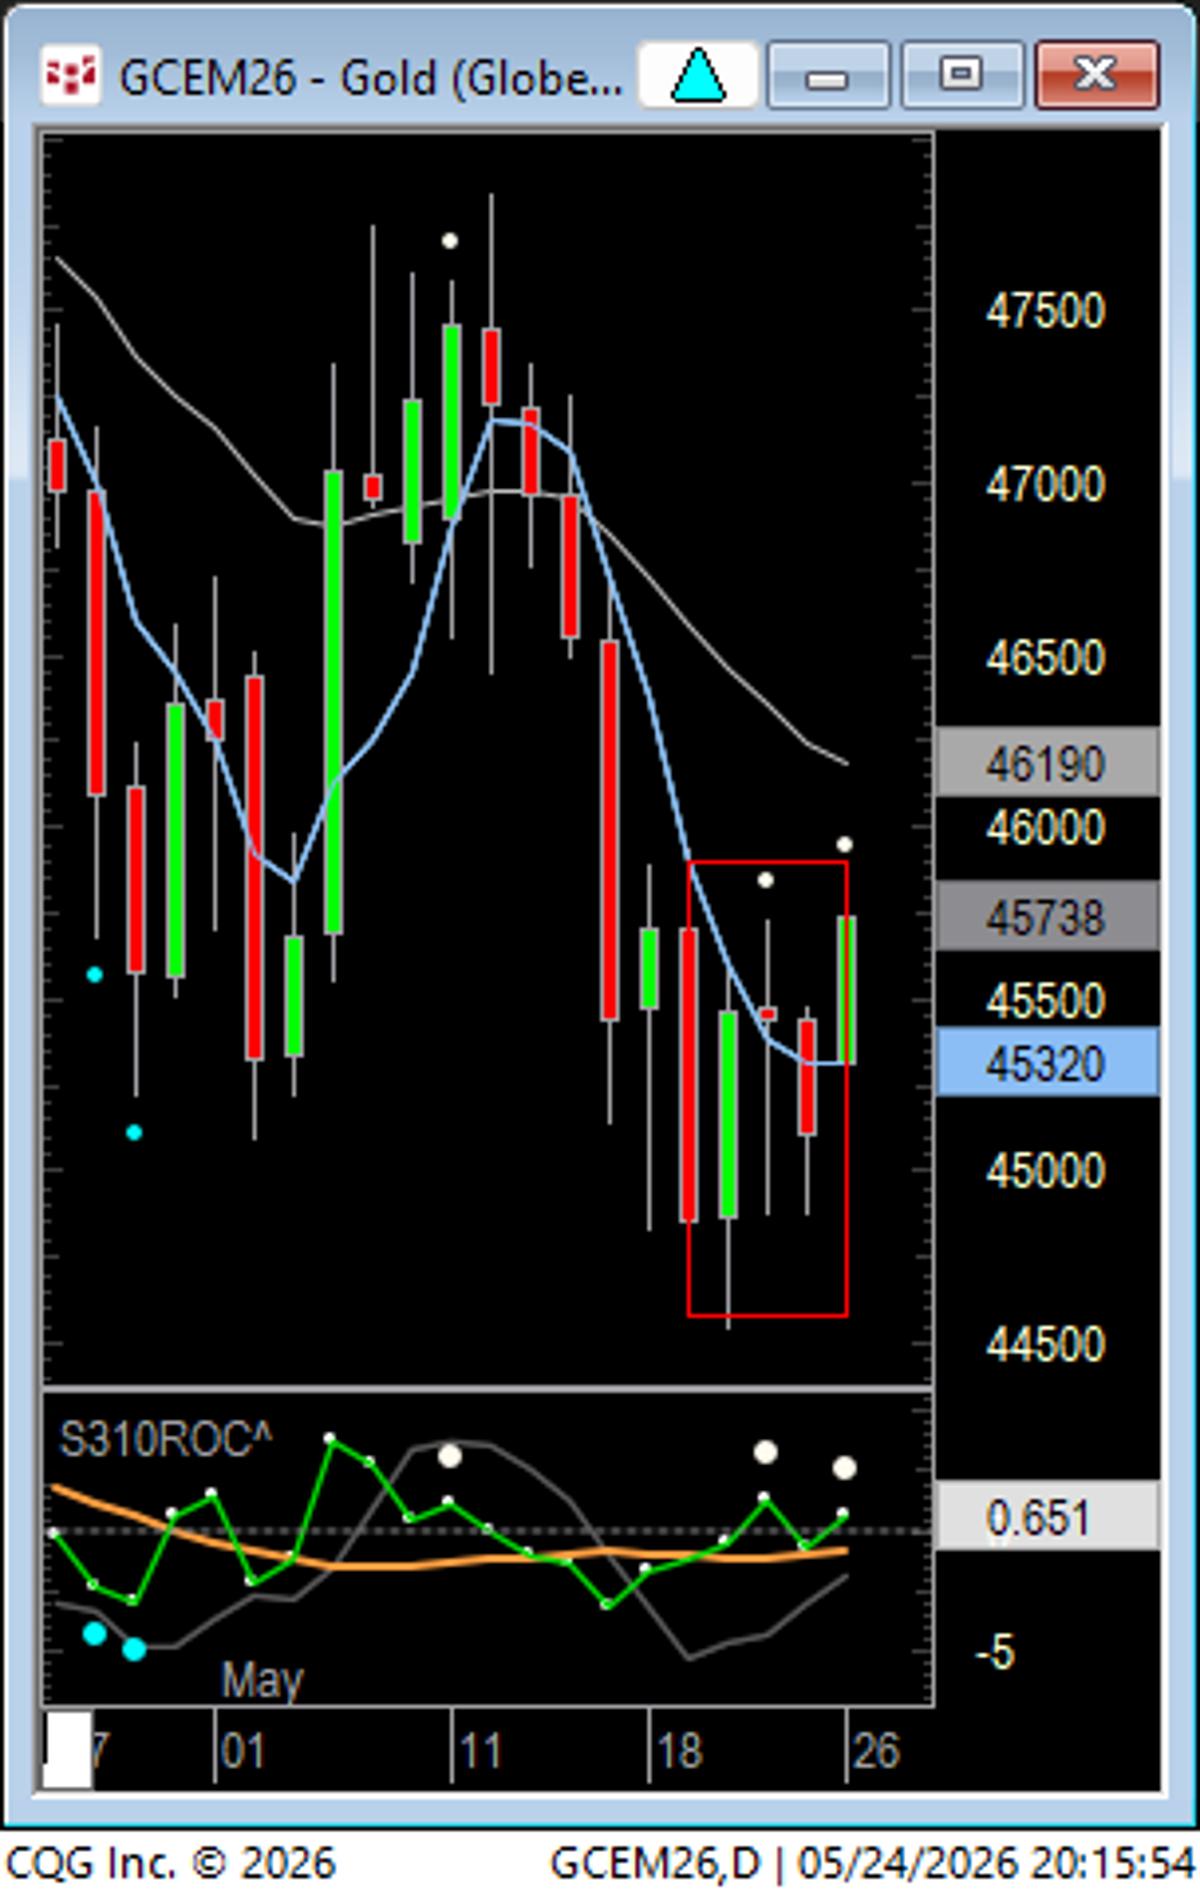
Gold Eyes Breakout Above 4593.7 After Triangle Pattern
Both GC and SI closed on Friday with a three bar triangle breakout formation. Gold needs to get above 4593.7... https://t.co/TOSe7AoI8j
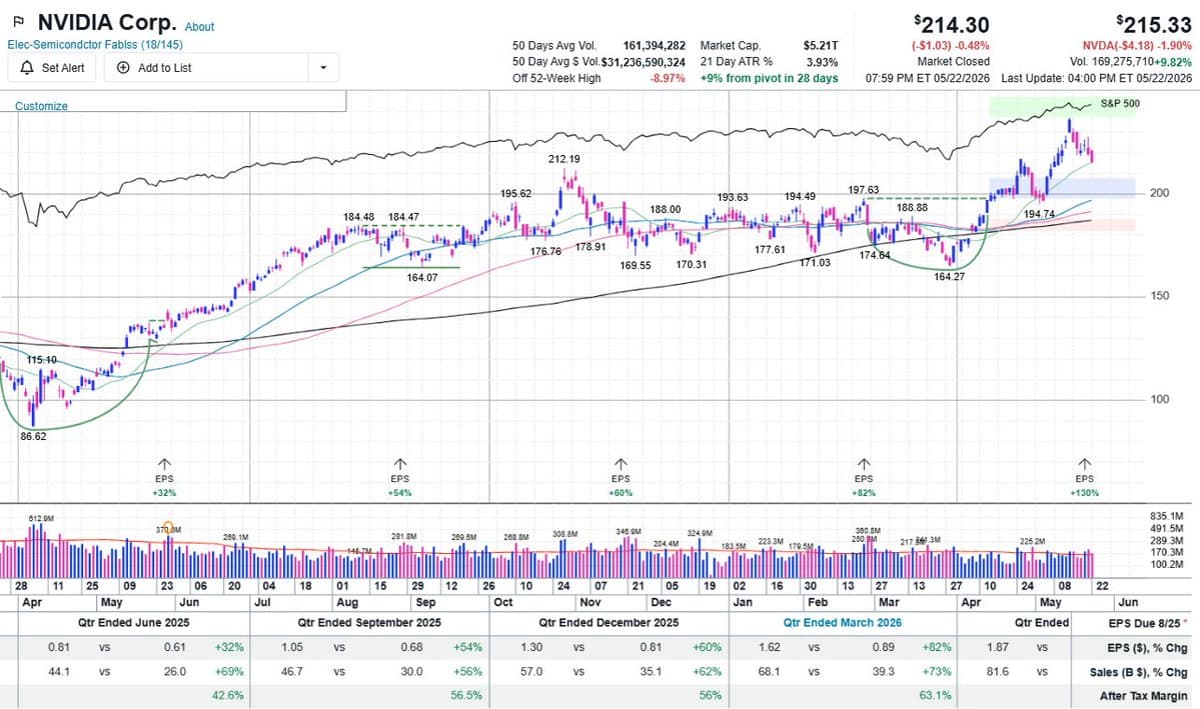
NVDA's 212‑215 Zone: Critical Test for King Status
$NVDA @marketsurge #IBDPartner important area for the king (could be ex-king if it doesn't hold) 212-215 zone which is retest of breakout area and 20sma (former being more important) https://t.co/7VqAtBGQkg
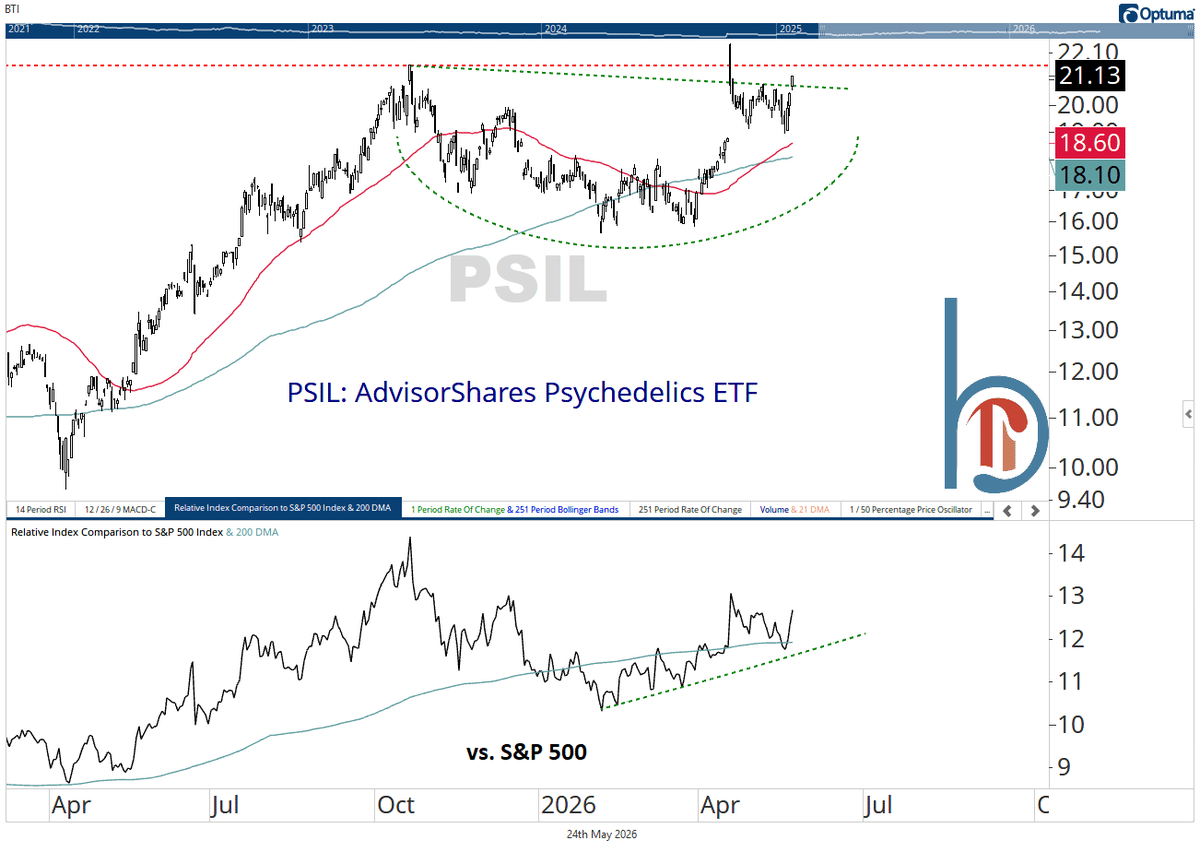
Psychedelic Stocks Poised for Real Breakout After April Flop
After a false breakout in April, psychedelic stocks look back and ready to make the next one stick https://t.co/AGO7IdGdZC
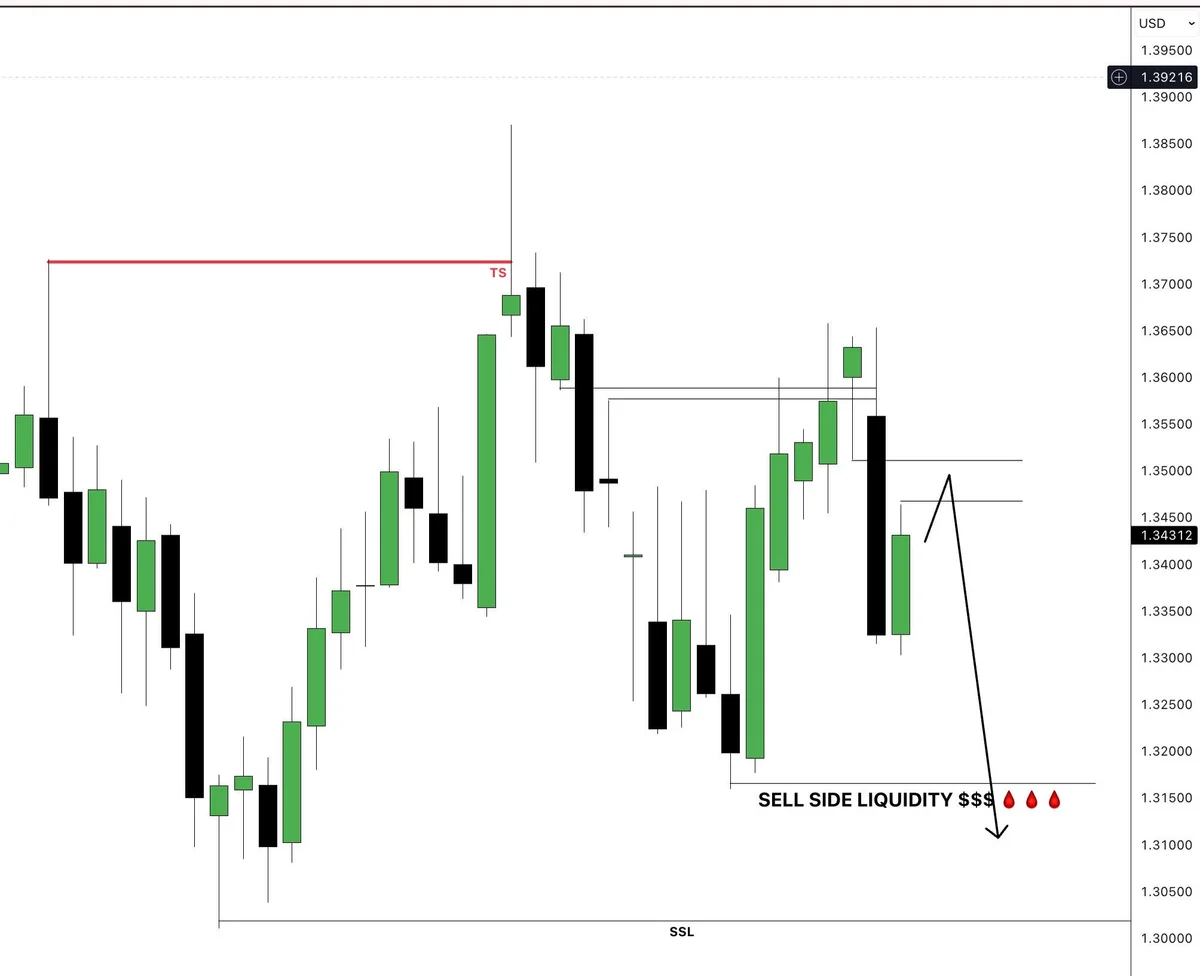
Smart Money Targets Liquidity, Signals Bearish GBP/USD Move
📉 Smart Money is telling a story here… Price pushed into resistance, grabbed liquidity, and started showing bearish intent. Now the market may seek the SELL SIDE LIQUIDITY resting below the lows. 🔥 This is how institutions move the market: ➡️ Create attraction ➡️...
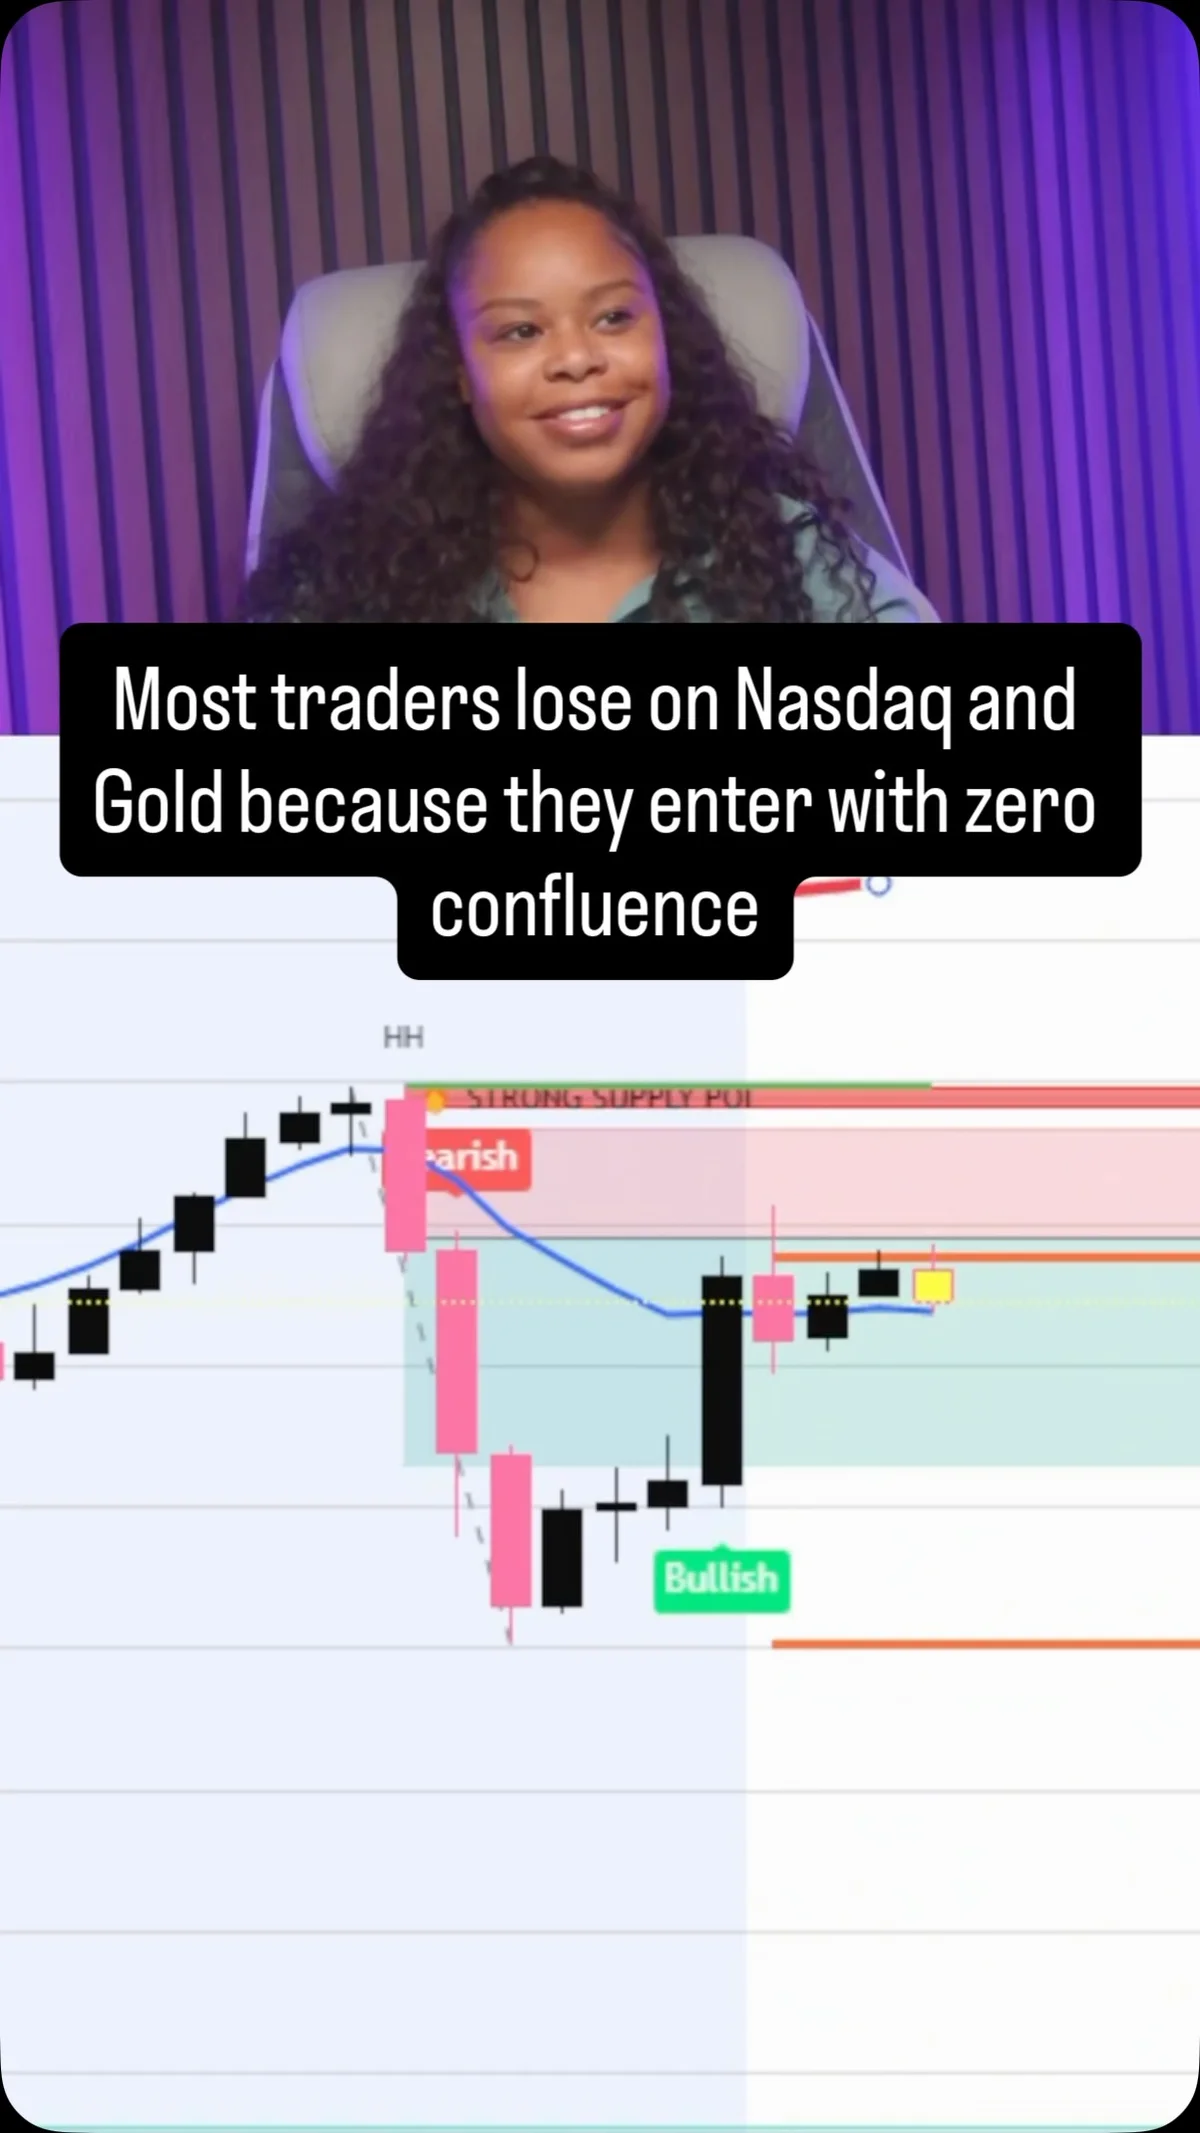
Trade Only With Three Confirmations, Not Forced Entries
Before I take any trade on Nasdaq or Gold, I need at least 3 confirmations. Trend direction. Market structure. Key level reaction. If price is making lower lows and lower highs, I’m not looking for longs. If price is respecting a key...
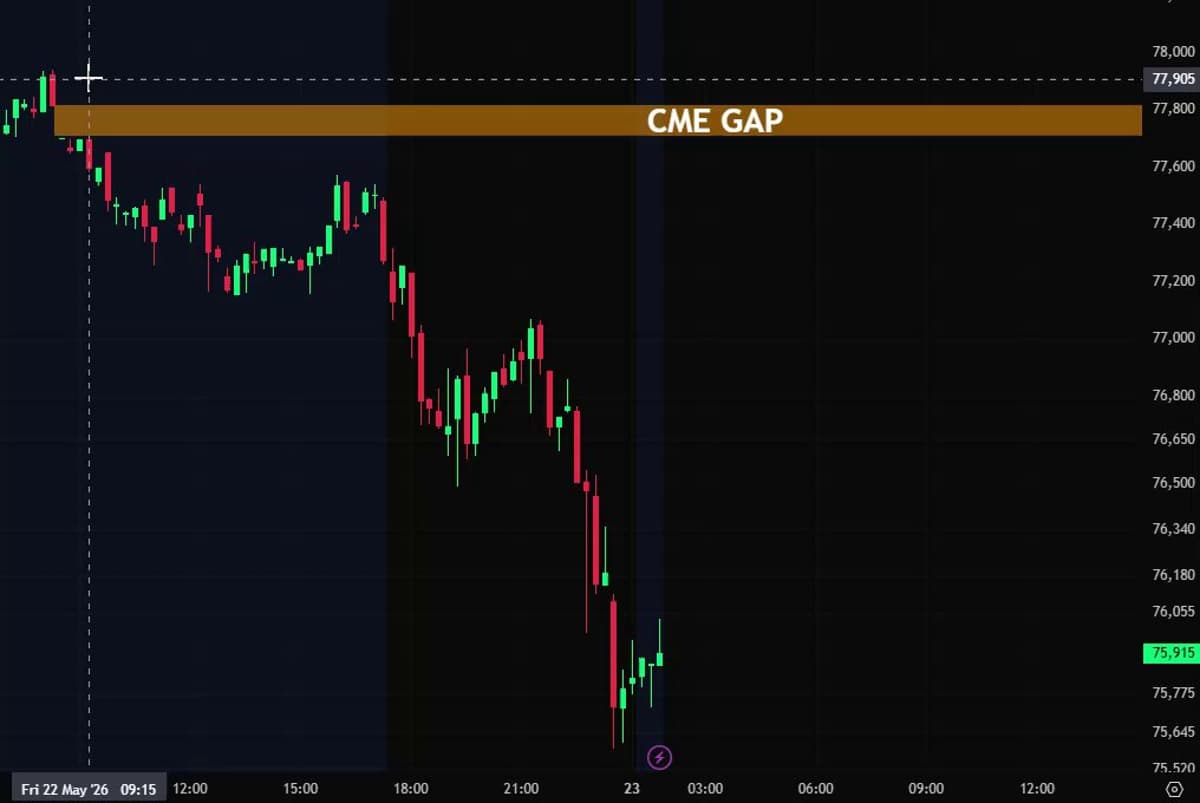
BTC's Hidden CME Gap Signals Upcoming Price Fill
$BTC formed a hidden CME gap during yesterday’s dump and most people didn’t even notice it. There are already 3 unfilled gaps above. The market usually closes them… it’s only a matter of time. 👀 https://t.co/wUz7tv7Rer
Exit Trades Using Reversal Sticks and Partial Profits
I need to see reversal sticks and temp top confirmations to get me to close a position. Taking partial profits and moving stops for now.

Scalping Hot Options with Price Action in High IV Markets
My FAFO trading account is doing wild things this week lol, combining hot option flows + price-action to scalp high IV / speculative names in captured by the markets' hottest themes Not things you sit and hold, but man it can...
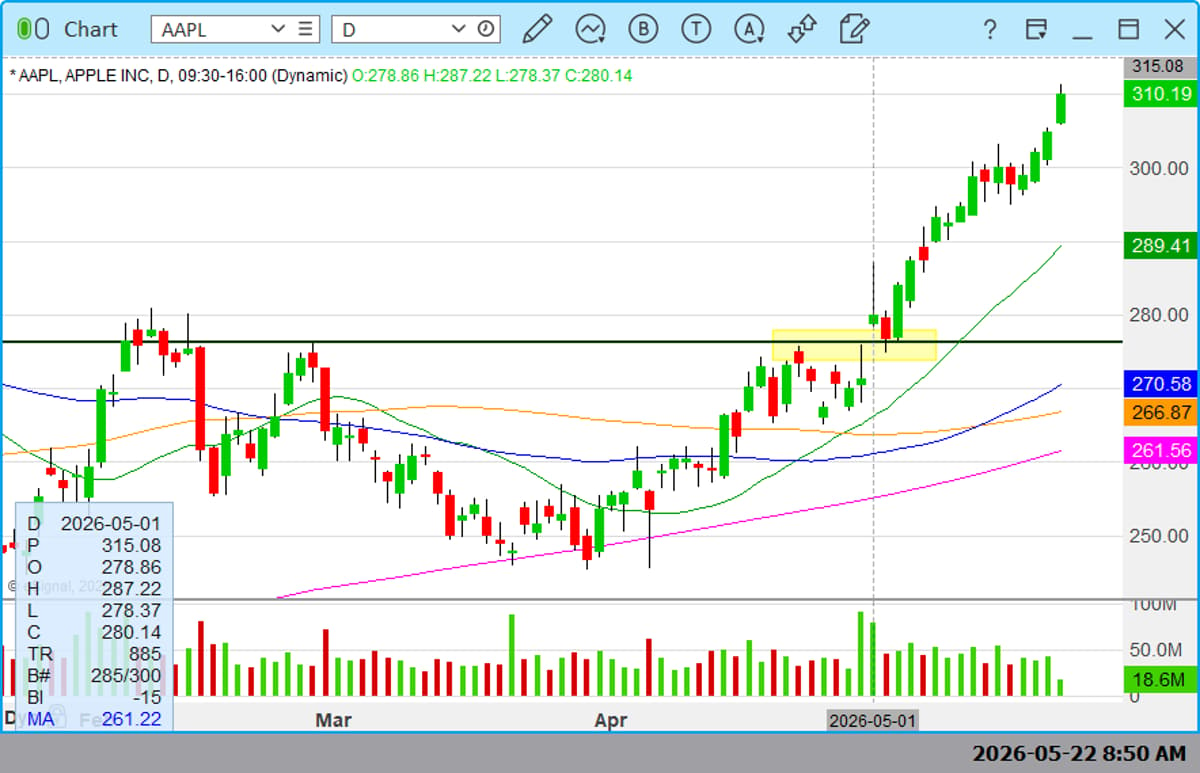
Apple’s Surge Underscores Cyclical Market Resilience
$AAPL incredible run from gap fill and support. We are being so spoiled in this tape which brings to mind “Hard times create strong men. Strong men create good times. Good times create weak men. And, weak men...

Intuitive LUNR Flag Breakout Spurs $55 Call Surge
Intuitive (LUNR) 1500 max strike January $55 calls buying $8.50 offers with Space names on fire, fresh tight flag breakout today, wrote this one up 5-15
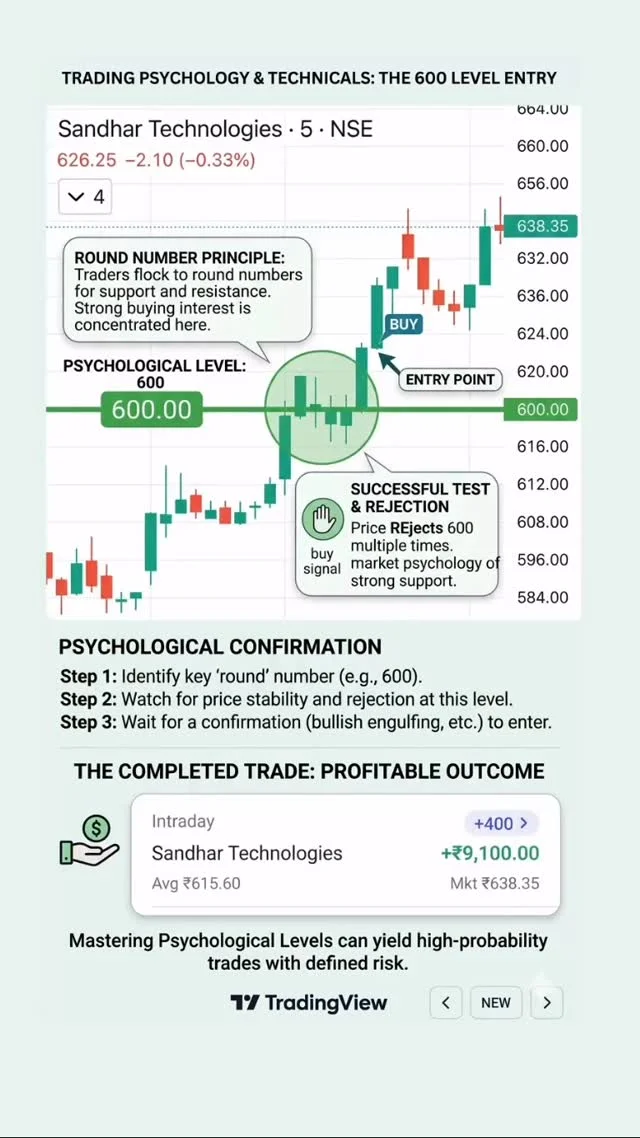
Psychological Impact of the 600.00 Level in Intraday Trading
technical analysis for intraday trading: Understanding the psychological significance of the 600.00. This analysis is for educational purposes only and does not constitute financial advice. All trading involves risk, and past performance is not indicative of future results. Please conduct your...
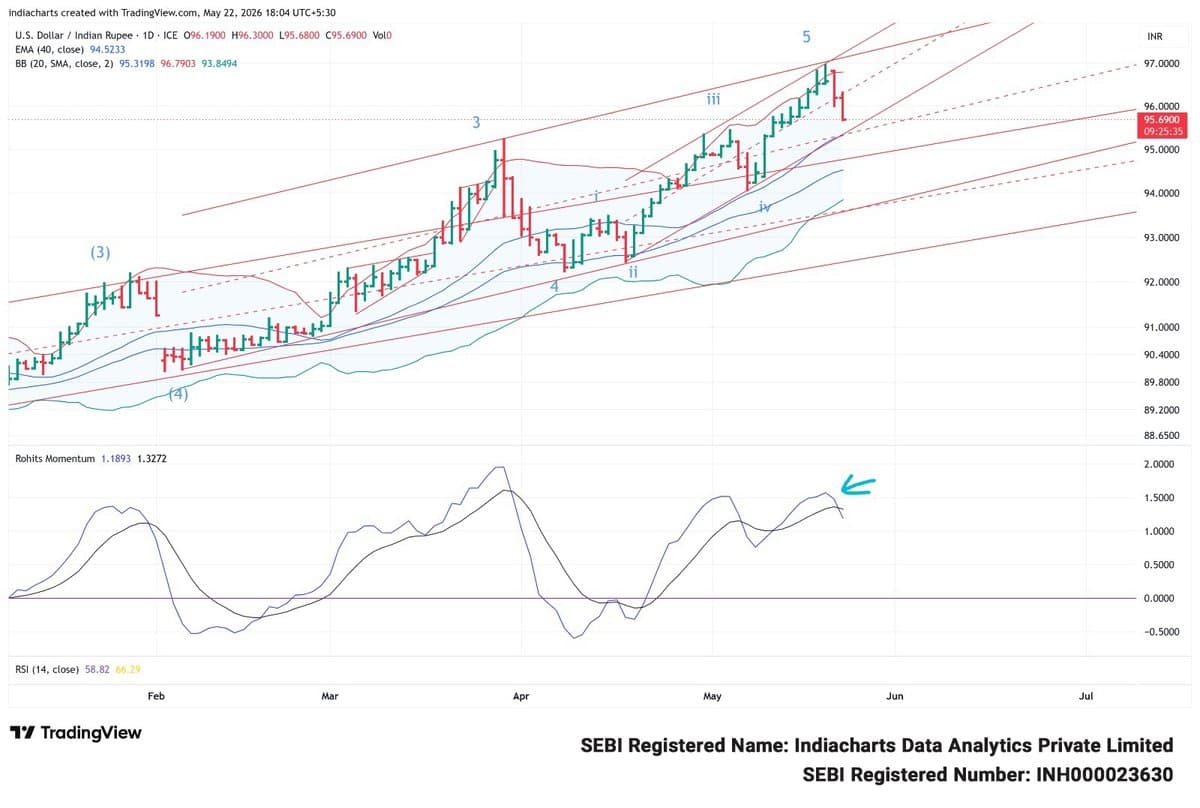
USDINR Peaks at 97, RMI Signals Move Toward 94
USDINR continues to go lower, meaning a stronger rupee - and now our proprietary RMI indicator is confirming a sell signal after prices were rejected from the top end of multiple channels near 97. Inference - USDINR has topped out at...

AI Rally Soars, Algorithm Signals Imminent Market Top
AI stocks on fire, many have risen 100-200% off the March low. The rally is getting extended and an algorithm we follow is flashing ~90% probability of a market top. Reading can rise to 95%+ so our plan is to...

Awaiting Gold H4 Break, Bullish Swing 4700‑4800
📊🔥 GOLD H4 FORECAST 🔥📊 Currently, we are waiting for a proper Break of Structure (BOS) on H4 ⏳ Once the bearish market structure shifts into bullish momentum 📈✅ Then we will start looking for our swing setup entries 🚀 🎯 Expected swing targets:...

Speculative Momentum Nearing Exhaustion, Echoing Past Blowoffs
This chart is showing a classic late-cycle / speculative momentum setup becoming increasingly unstable. Similar markets in: * late 1999 / early 2000 momentum exhaustion * late 2021 speculative growth blowoff * mini-versions in 2018 and 2020
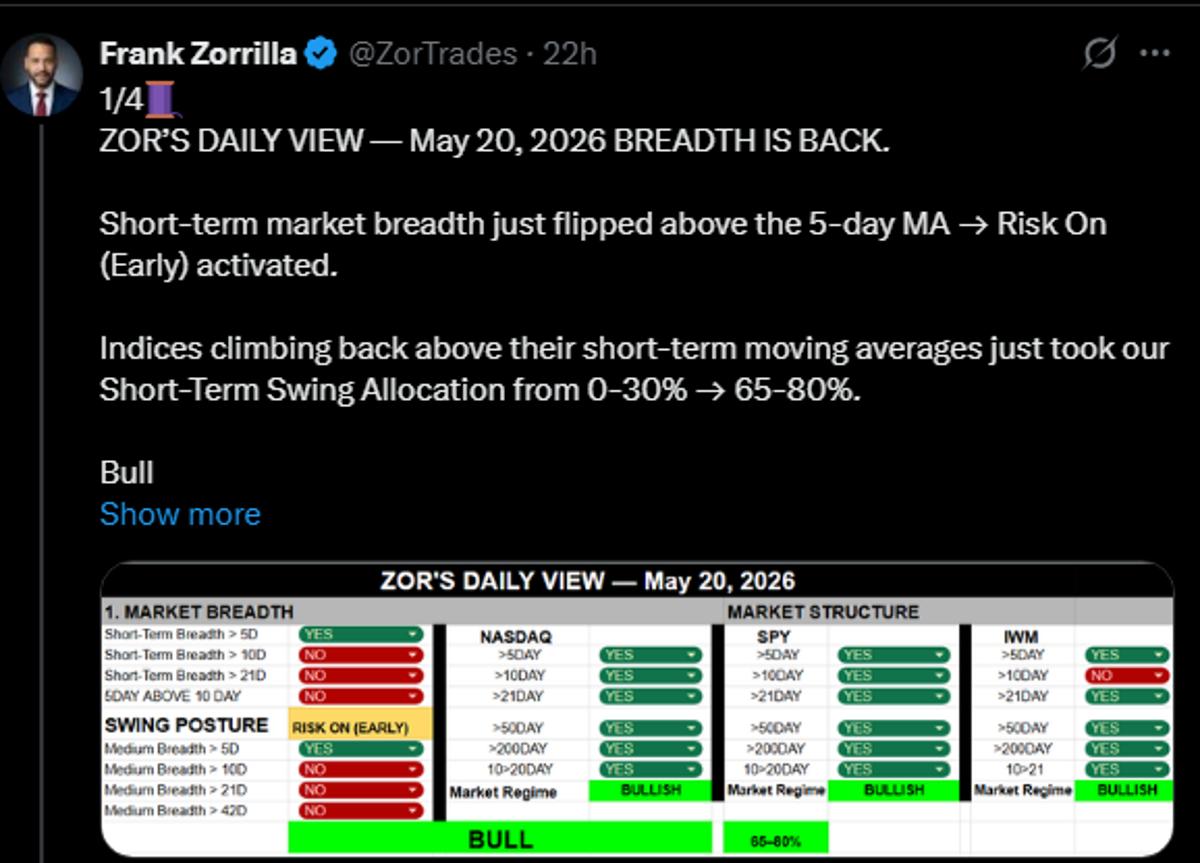
Breadth Flip Triggers Immediate Follow‑through, Expanding Setups
Yesterday we got the breadth flip. Today we got the follow-through. That’s the sequence you want to see. Short-term breadth reclaimed the 5-day MA → Risk On (Early) activated. Then today: The setups expanded immediately. $QBTS $INOD $RXT $APLD $EOSE $GLW $ATOM $CRWV $LASR https://t.co/7DUMcCYmoW
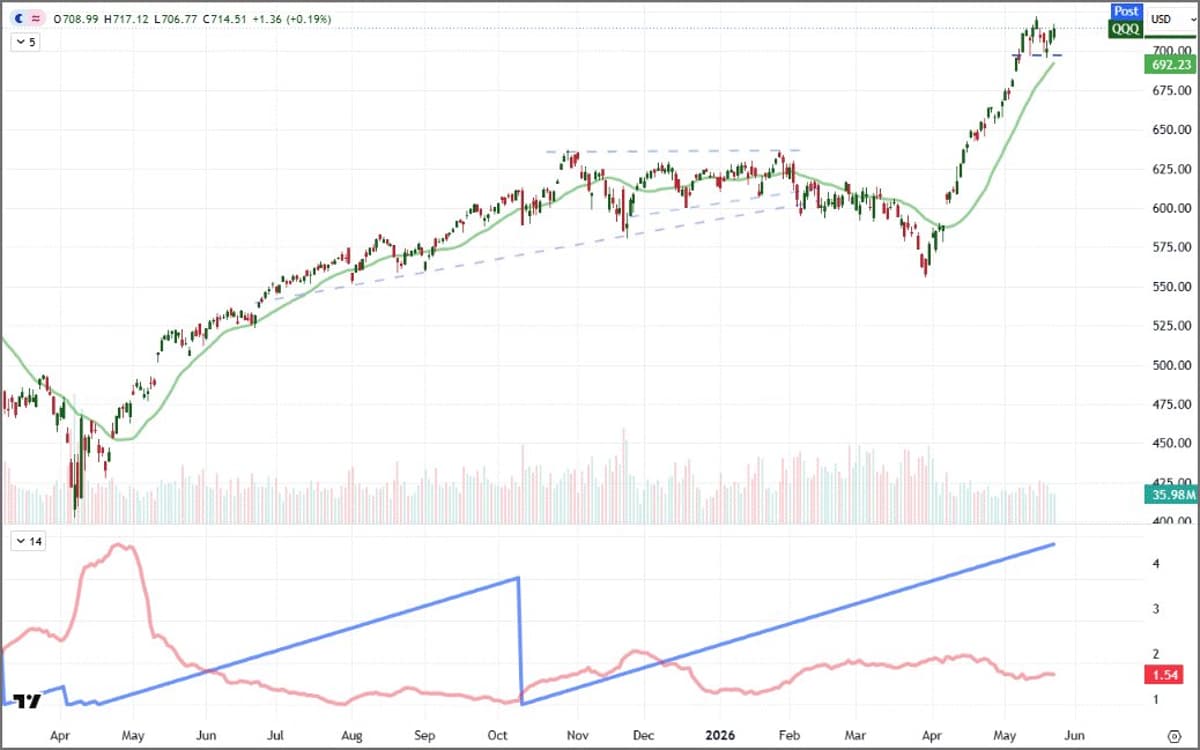
QQQ Nears 3% Drop After 153-Day Streak
It's been 153 trading days since the $QQQ (Nasdaq 100) has put in for a -3 percent retreat and we very unlikely to get it before week's end. We have a holiday weekend ahead (US and UK off Monday), and it...
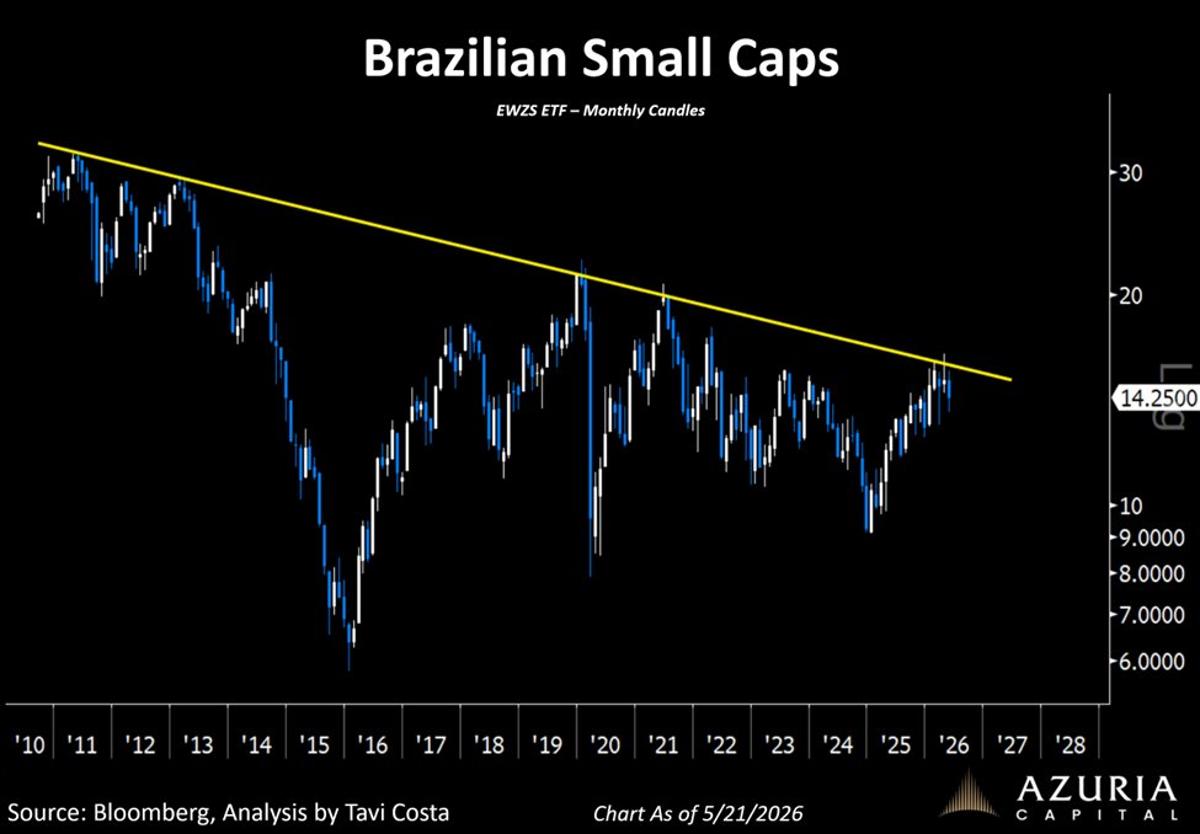
Timing Breakouts Beats Waiting in Brazilian Small Caps
Brazilian small caps. This chart reminds me of a great quote from Paul Tudor Jones: “The key to being successful is to be able to time the breakout, not just wait for it.” https://t.co/NGXxI4M2i4 https://t.co/VehCgTuUo7
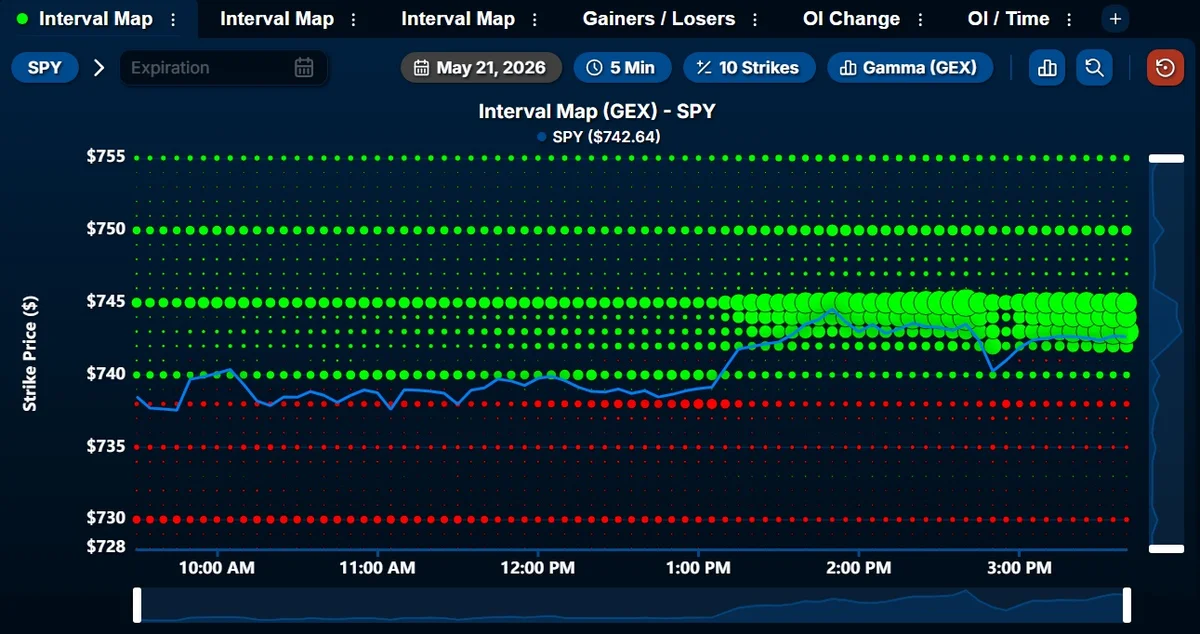
SPY Poised to Close Within $740‑$743 Range
Tons of positive exposure above spot on $SPY, with $743 as the MVC. Expecting us to close within this range here. This morning, the expansion above $740 was pretty clear, especially an hour in, as positive exposure continued to increase.

Caught Solar $TAN at the Bottom This Week
Looks like we bought Solar $TAN right on the screws (on red) earlier this week too
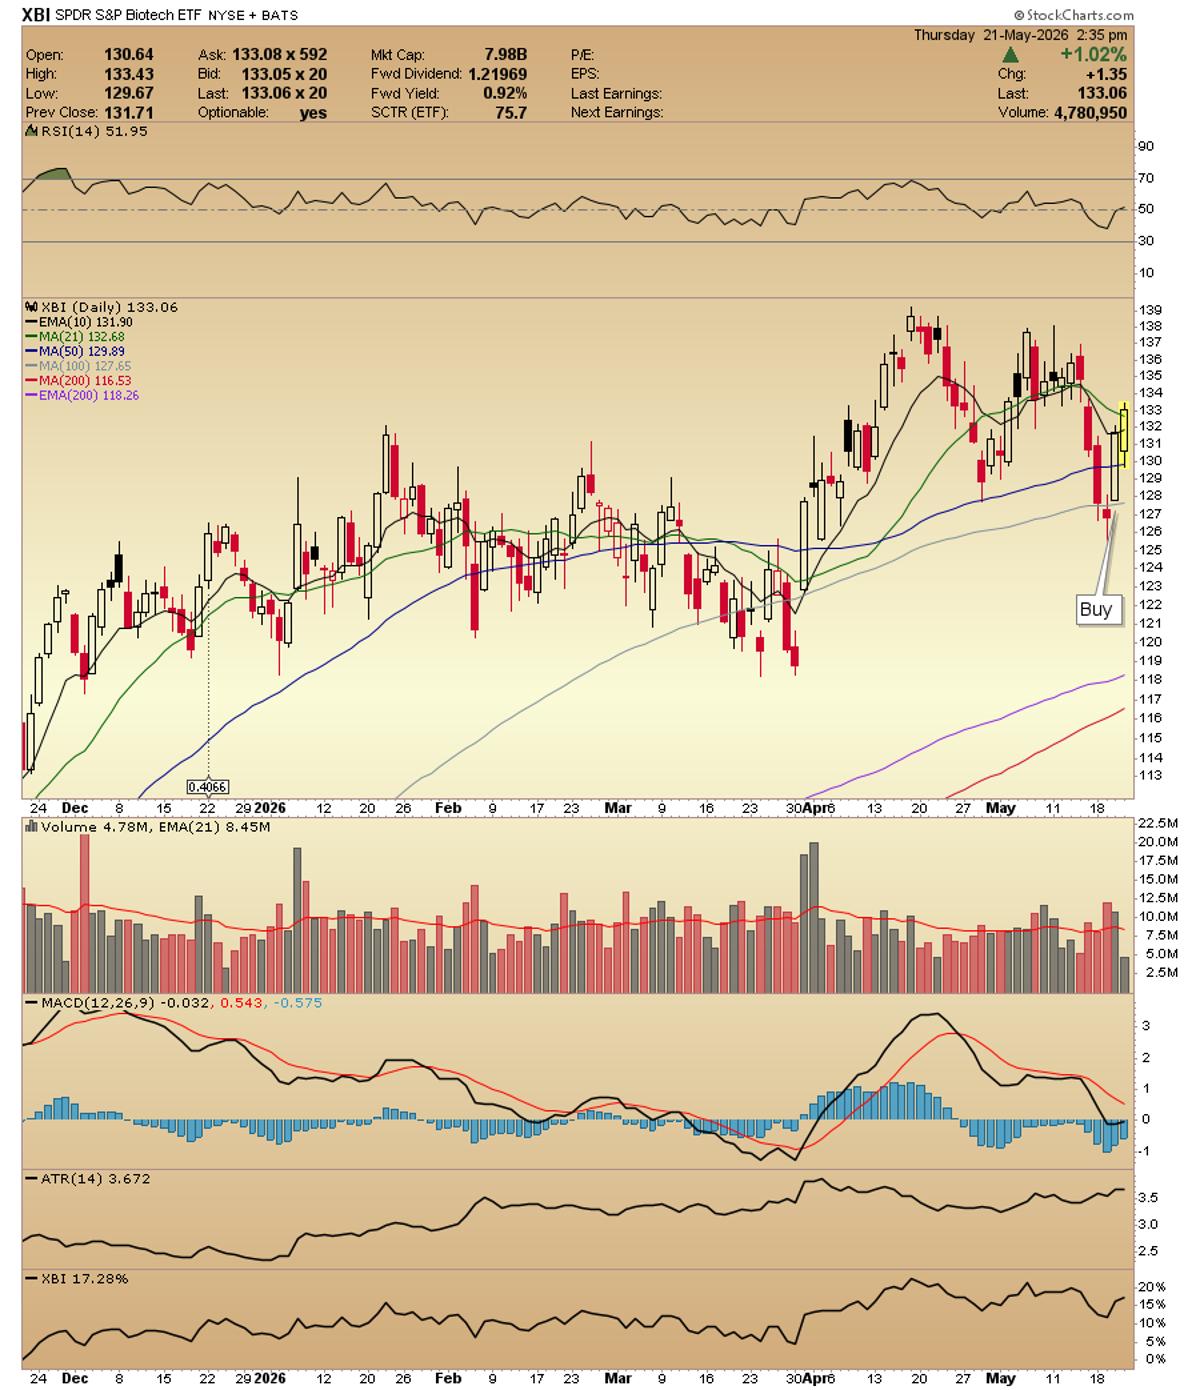
Layered Stops and MA Levels Guide XBI Trade
$XBI as an example of my initial entry, stop and end of day stop to help a couple of followers. I saw the stick on 5-19 and put the name back on my watch. I liked the 100ma...
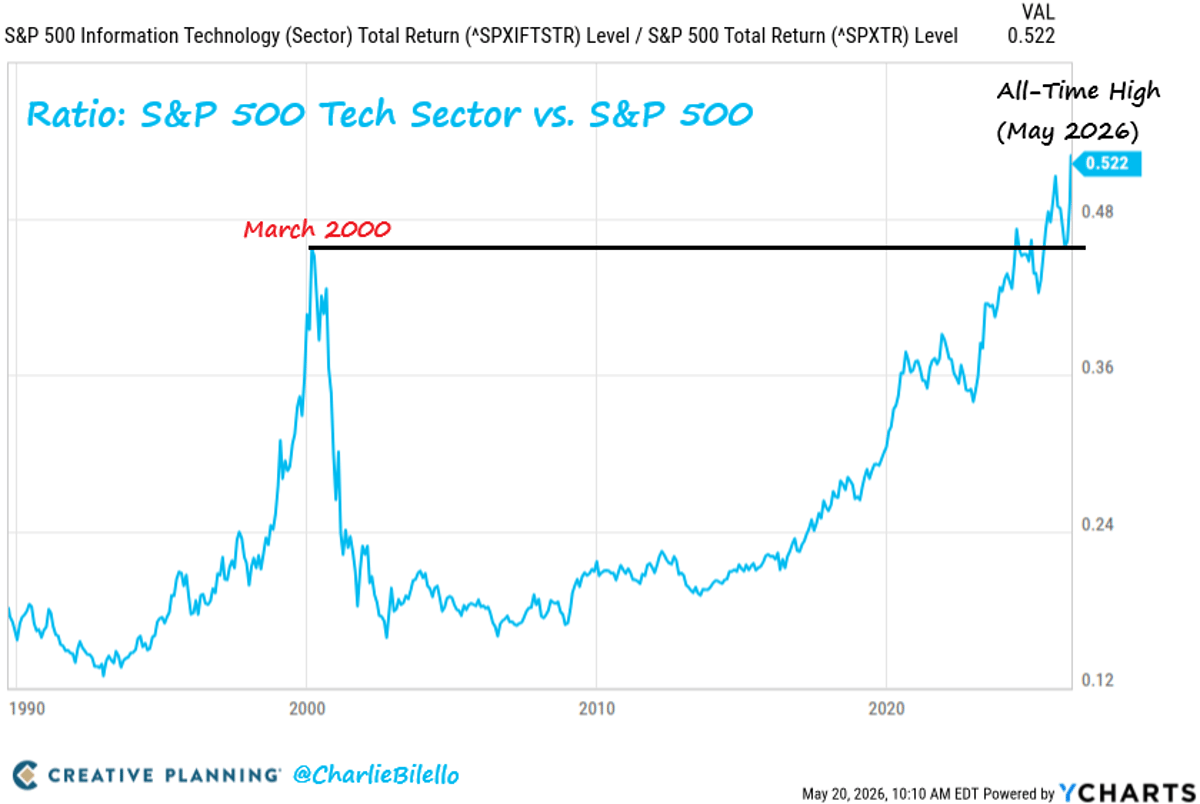
Tech Sector Hits Record Relative Strength, Surpassing 2000 Peak
The S&P 500 technology sector's relative strength versus the broad market is at its highest level in history, above the peak from March 2000. Video: https://t.co/MlNh6tnw11