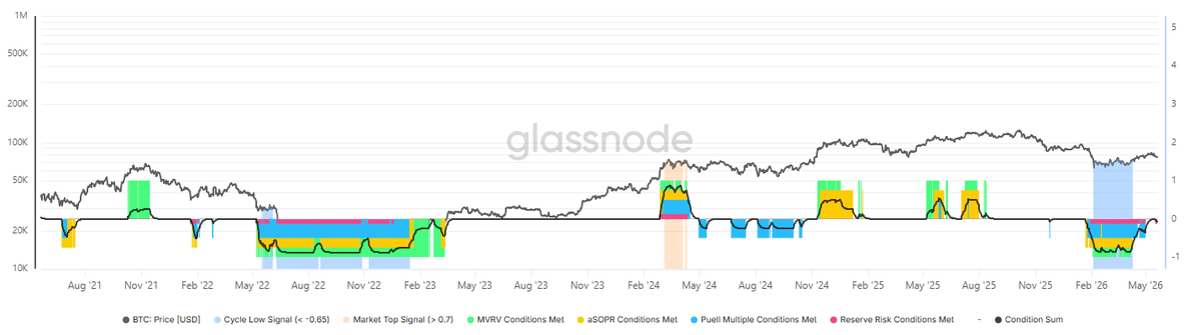
Bitcoin Hits Statistical Cycle Low, Bottom Already Printed
Two months ago, Bitcoin printed a cycle LOW signal. Not a "buy the dip" signal. A statistical, on-chain cycle low: the kind that historically only appeared at the FTX bottom in 2022 and the banking crisis low in early 2023. Most of Crypto Twitter is still talking about a bottom in October ‘26, while the data says that we already printed a bottom. The Glassnode Cycle Extremes indicator aggregates 4 on-chain oscillators: 🟢 MVRV Ratio — unrealized profit/loss extremes 🟡 aSOPR (30D) — realized profit/loss extremes 🔵 Puell Multiple — miner revenue extremes 🔴 Reserve Risk — HODLing intensity extremes The signal fires when at least 3 of 4 hit a statistical extreme (±0.8 to ±1.0 standard deviation from their long-term mean). This is what fired in Feb-Apr 2026. The same confluence that called the 2022 and 2023 bottoms. Doesn't mean we go straight up. It does mean the structural setup underneath the price is not what most people think it is. I'd rather be early on a confirmed signal than late on a feeling.

Stocks Respect Moving Averages, Pull Back to Support
Stocks have a character, they will pullback and find support at a certain MA during trends. They will act a certain way on opens/closes.

Tesla Targets 423 Support; Stops Remain Unchanged
$TSLA see if it can hold the 423 area. Same levels as posted earlier. No change to stops just yet.

Netflix Targets Near $90‑91 Range for Next Move
$NFLX looking at a close over 90.14 for my next level. Then 91.28 and 91.48 next up
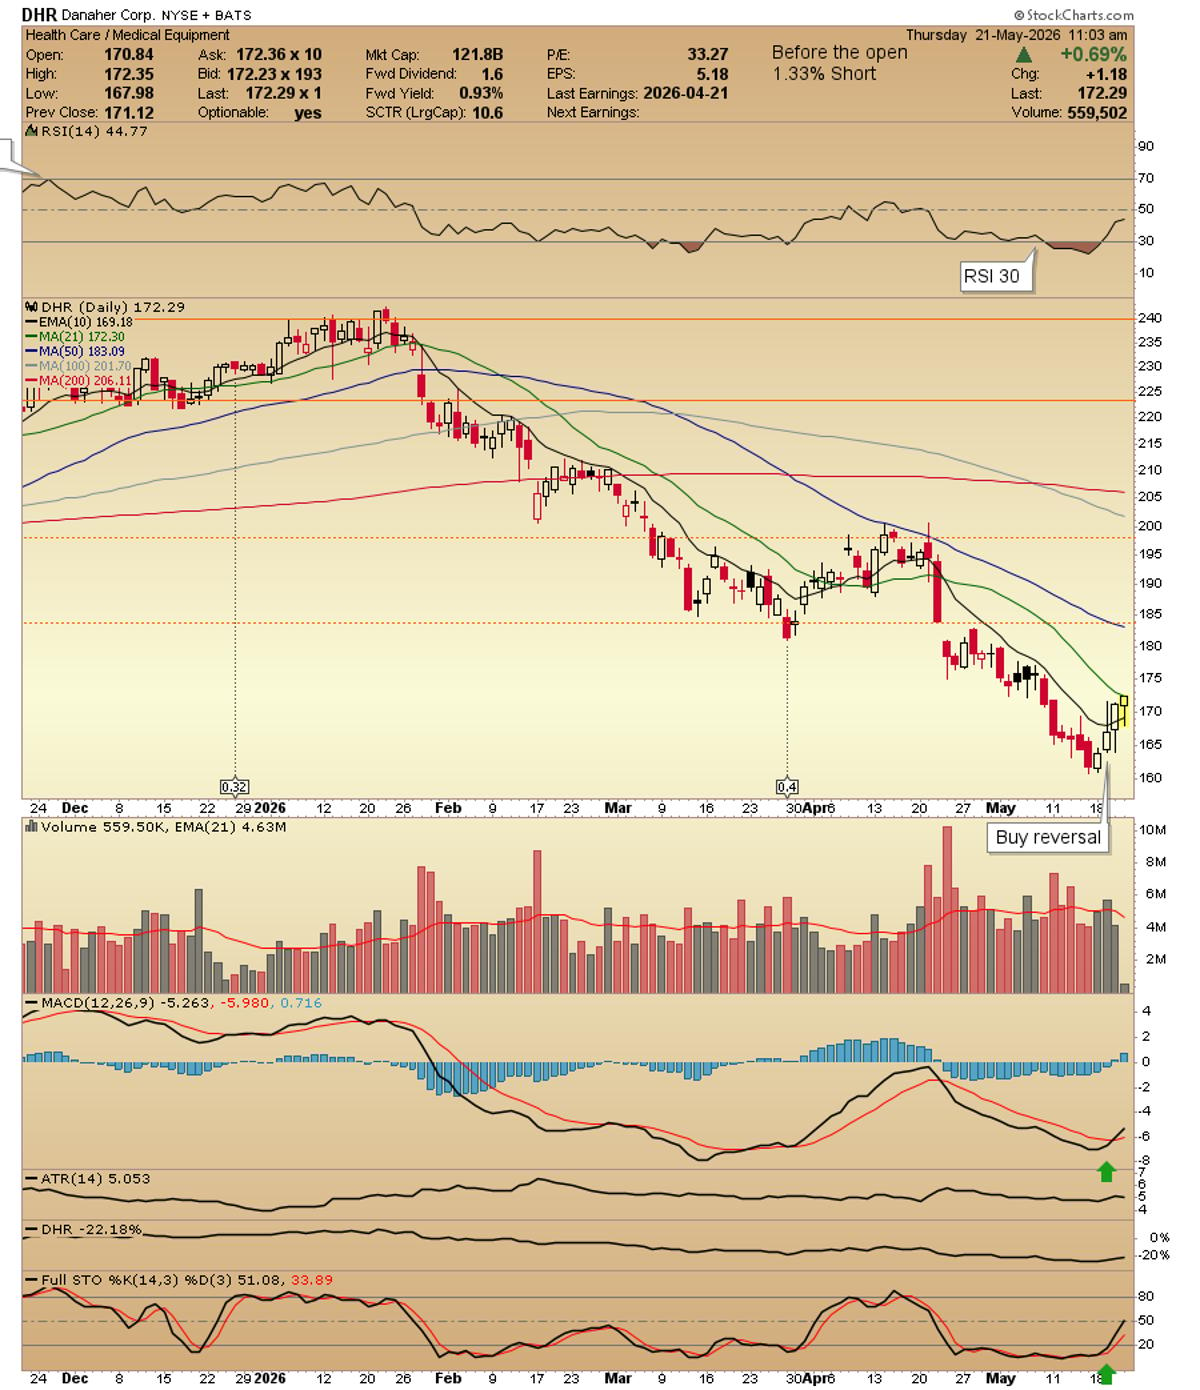
DHR Nears 21‑Day MA, Watch for Potential Move
$DHR tapping on the 21ma daily a move ad hold over by days end next on my radar. updated chart https://t.co/RViWAxJIUG
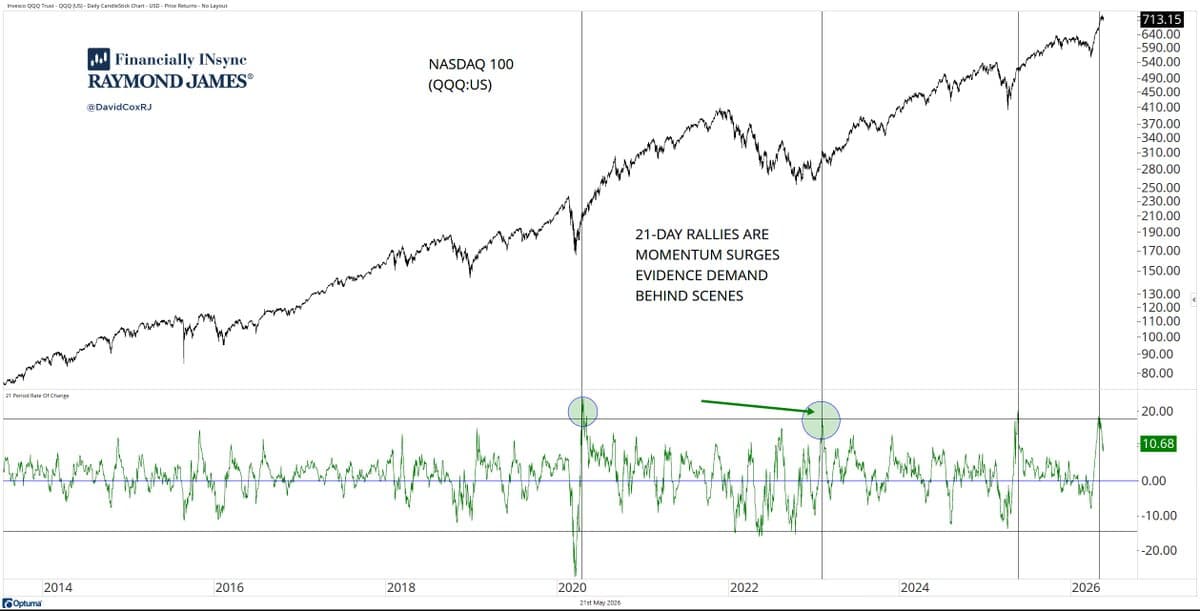
Buying Surges Signal Overwhelming Market Demand
there are many ways to look at the idea of buying thrusts/surges, and i tend to interpret them as signs of overwhelming demand (and/or supply) #marketpulse here's the $QQQ with a 21-day % change and vertical lines plotted at such surges......
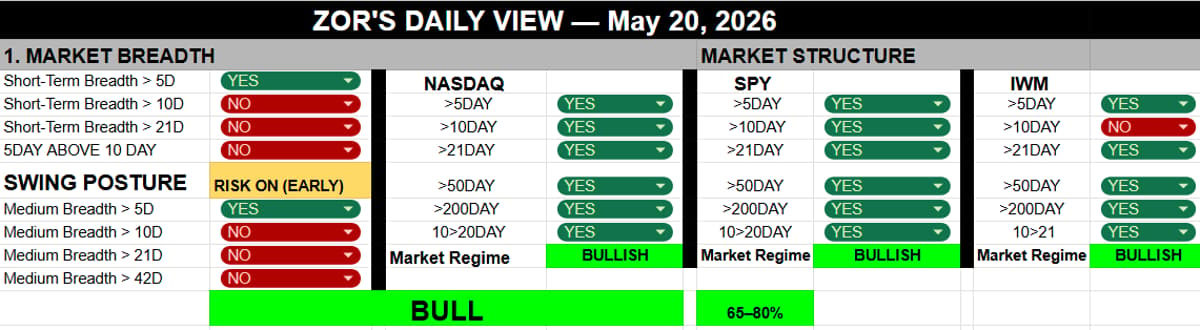
Breadth Returns, Triggering Early Risk‑On Allocation Surge
1/4🧵 ZOR’S DAILY VIEW — May 20, 2026 BREADTH IS BACK. Short-term market breadth just flipped above the 5-day MA → Risk On (Early) activated. Indices climbing back above their short-term moving averages just took our Short-Term Swing Allocation from 0-30%...
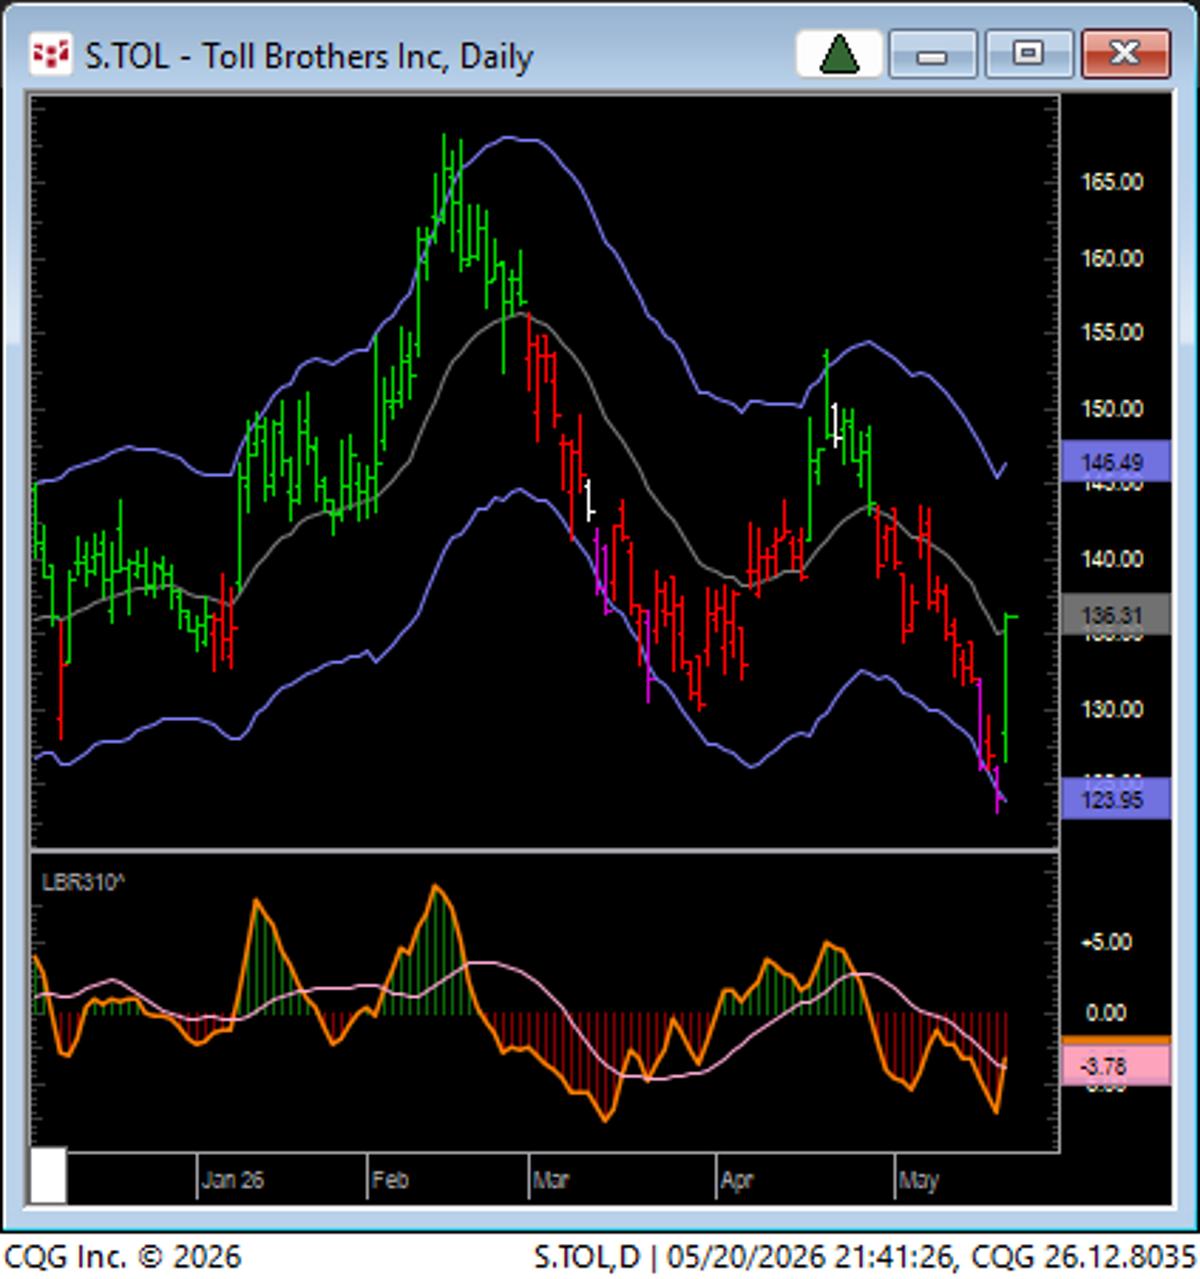
Investors Hunt Oversold Stocks, Betting on Rebound
They are scraping the bottom of the barrel today for oversold shares...TOL OKLO ALK COMP UAL CCL etc...obviously hoping for a return to the normal... https://t.co/CIAW0wSd93

DAX Surges Toward 25k Resistance, Bullish Momentum Builds
#DAX big Up Candle. Resistance 25000, ATH 25508. Support 24000, 23482, 23000. RSI 56 bit off Neutral. 13/21 day EMAs Bullish. Top Bollinger Band 24825. Midpoint Line 24323. Bottom Band 23822.

Stay Still: Systematic Rules for Volatility Spikes
VIX is at 17. Earnings week. The internet is loud. 10 rules I follow when volatility spikes: 1. Don't react to the tape. Read the data. 2. Doing nothing is a position. 3. Margin > EPS. 4. Crypto fear isn't equity thesis change. 5. Forecasts aren't data. 6. Sell...
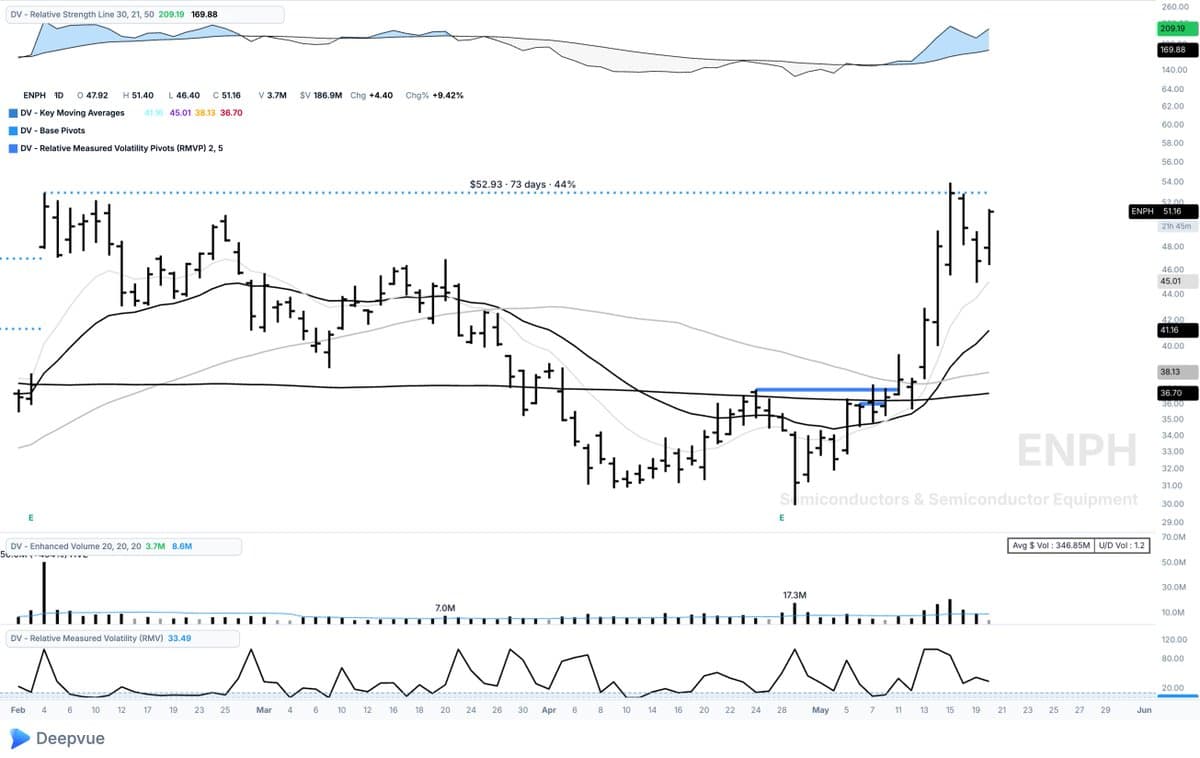
Watch ENPH and Solar Stocks as Flags Form
Keep an eye on $ENPH and solar names. They had a strong move up and now are building out flags https://t.co/fqDYzN7Z8c

NVDA: Market Top
What's the verdict on $NVDA tonight? Market top? Market short term top flush out and rebound even harder in a week or two? Set new floor? 🤔
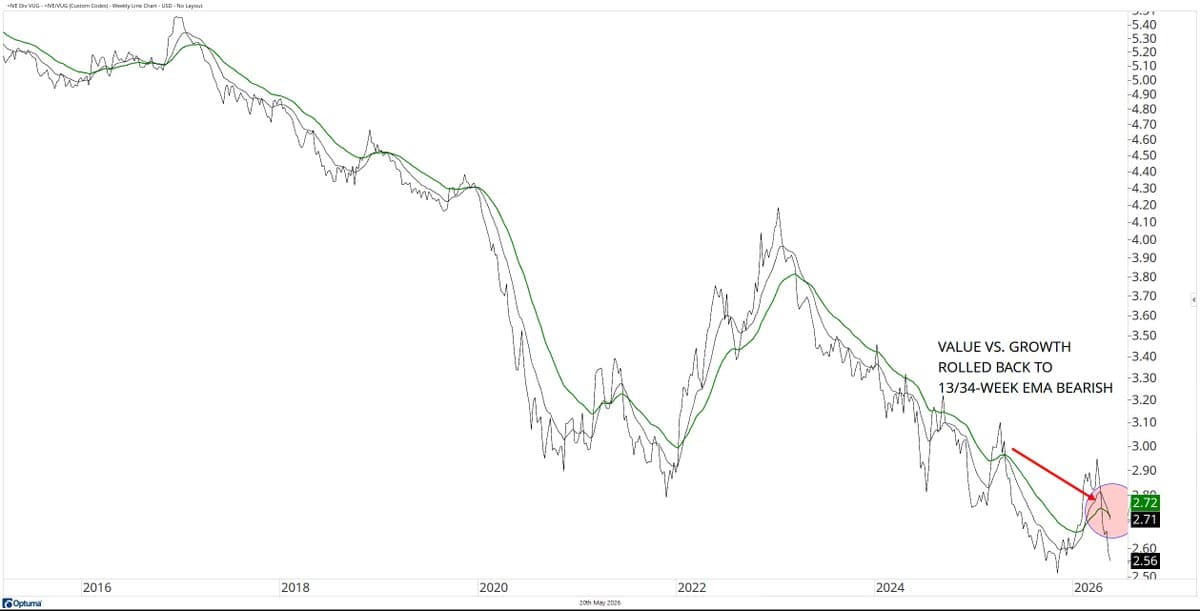
IVE Outperforms VUG as EMA Flips Bearish
value $IVE vs. growth $VUG has turned back 13/34-week EMA bearish... it was still a squint (when it turned bullish) in a seemingly lower highs/lower lows downtrend, all along... but nonetheless... https://t.co/n3v25v3mPq
Rally Expected to Reverse; Raising Cash for Put Protection
Current rally likely to roll over in a few weeks - We're raising cash and plan to buy put options to protect the portfolio from late Q2/early Q3 turbulence. https://t.co/8SXZbDeaRK
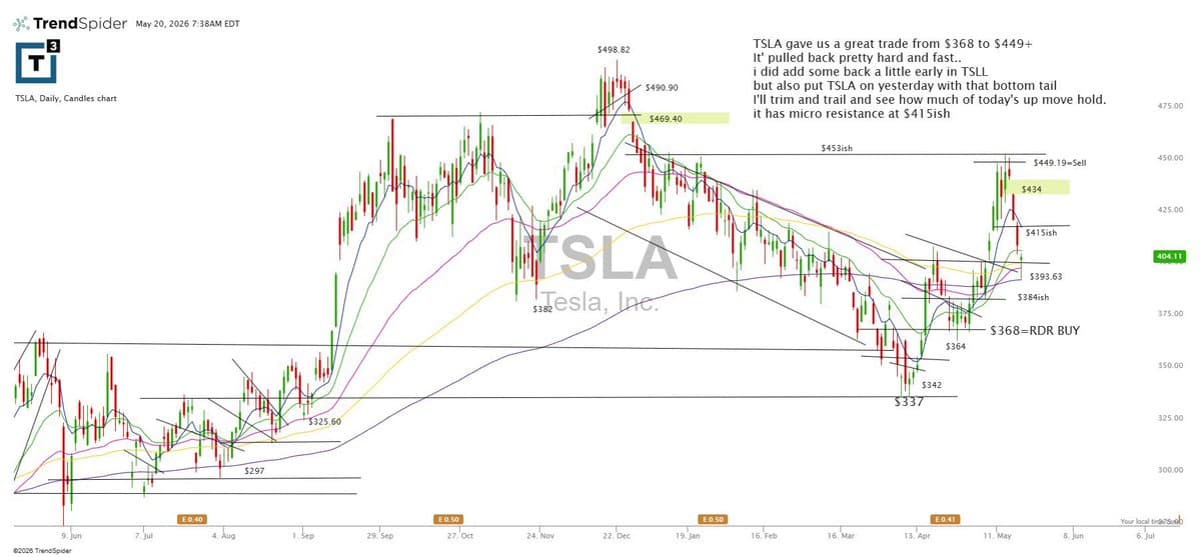
Tesla Shows Bullish Bottom Tail, Signaling Buying Opportunity
$tsla gave a nice bottom tail yesterday to add against - trim and trial into this gap up. https://t.co/2dx7Hwvhzc
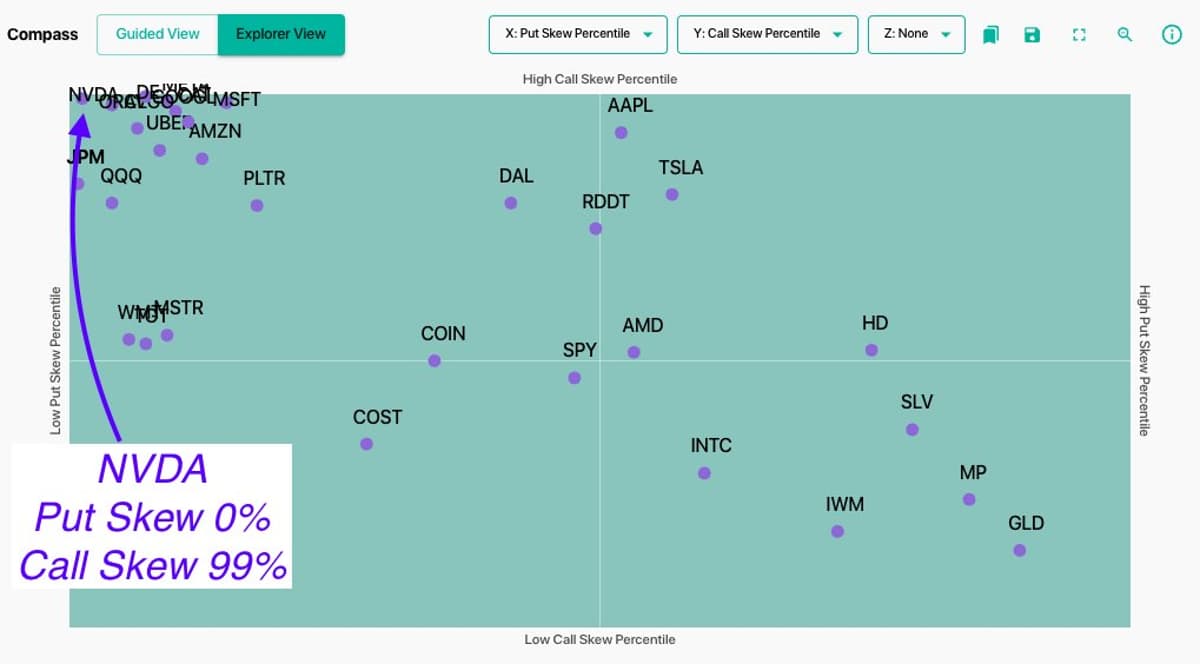
NVDA Earnings: Crowded Upside, Use Call Flies
$NVDA earnings: ~5.2% implied move down from ~6.5% The main features are: 1) IV is high - even relative to prior earnings 2) Call skews = 100 %'ile, Put skews = 0% Expecting big upside seems like a very crowded trade. We like call flies...

Copper Bounces Off Low-End of Risk Range Signal
Dr. Copper with the textbook bounce off the LRR (low-end of Risk Range™ Signal) https://t.co/85eFZznZTL
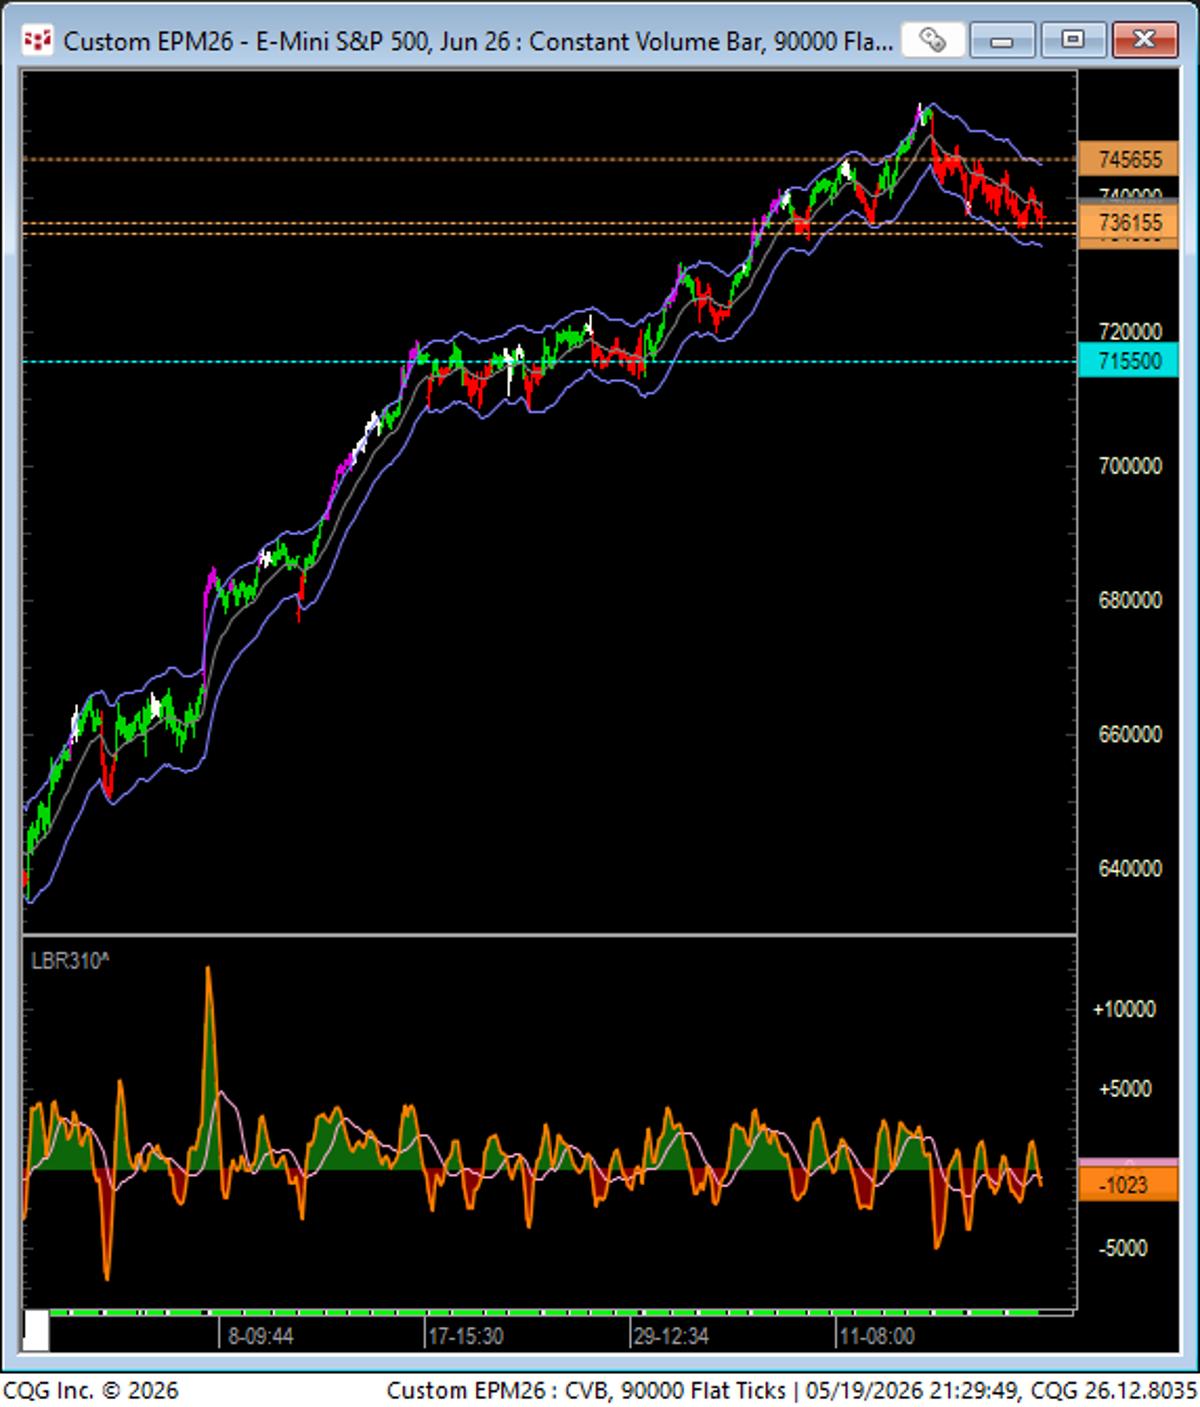
7155 Marks Next Major Support If
If 7363 goes (basis June SP futures), 7155 is the downside equivalent of the next "high volume node". https://t.co/ojUhAUjZ2r
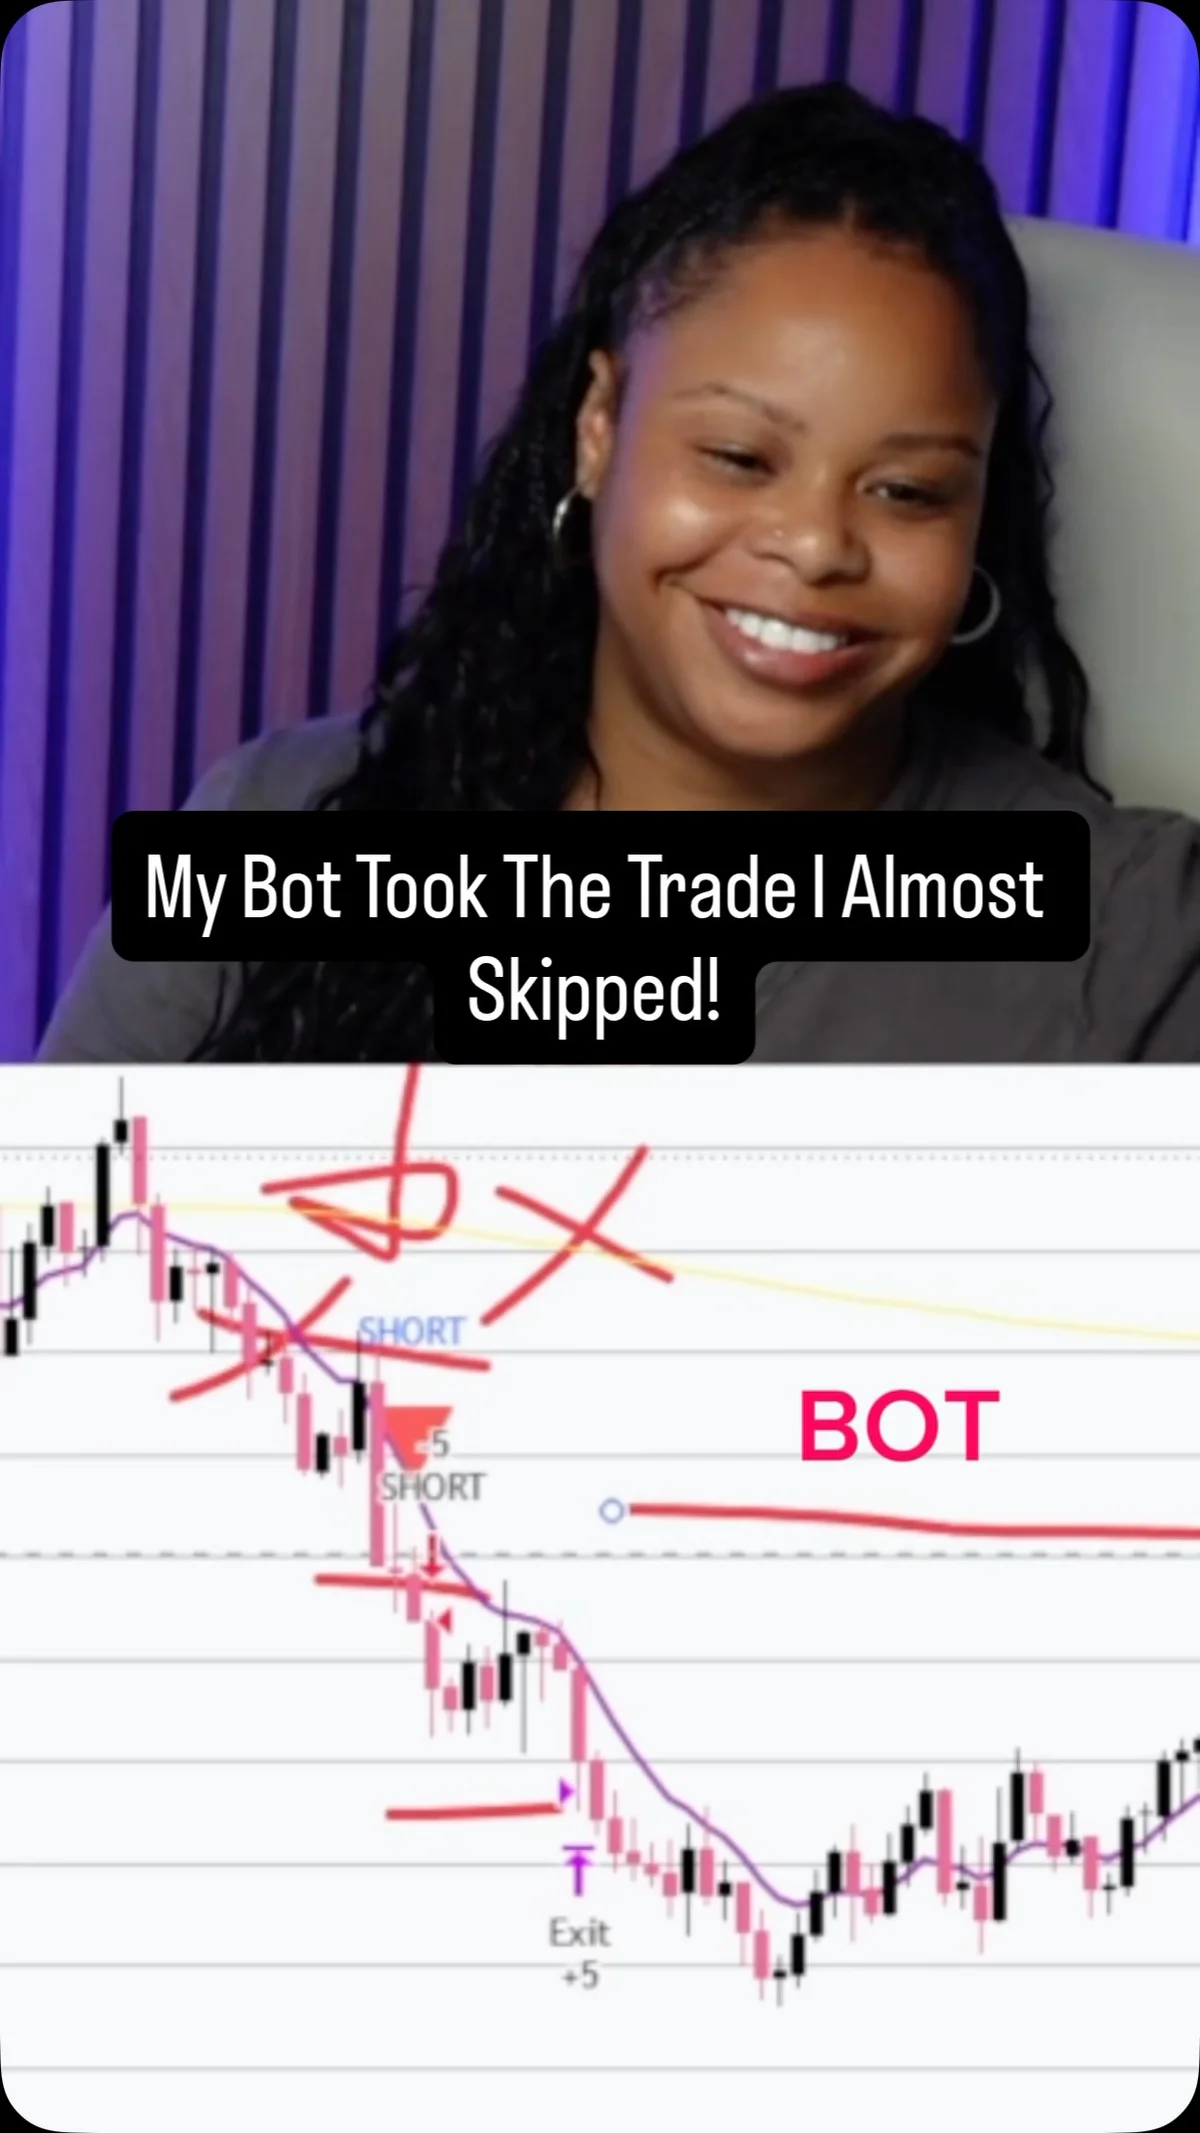
Rule‑Based Bots Avoid Emotional Second‑Guessing in Trades
My trading bot followed the exact market structure, confirmation, and risk management rules I programmed into it even though I hesitated on the setup. That’s the difference between emotional trading and rule based trading. Most traders second guess good setups because...
Top Technical Idea Today: Intel Stock Note Appreciated
i appreciate receiving notes like this. it was my #1 technical idea today. $INTC https://t.co/0tNRu72T5k
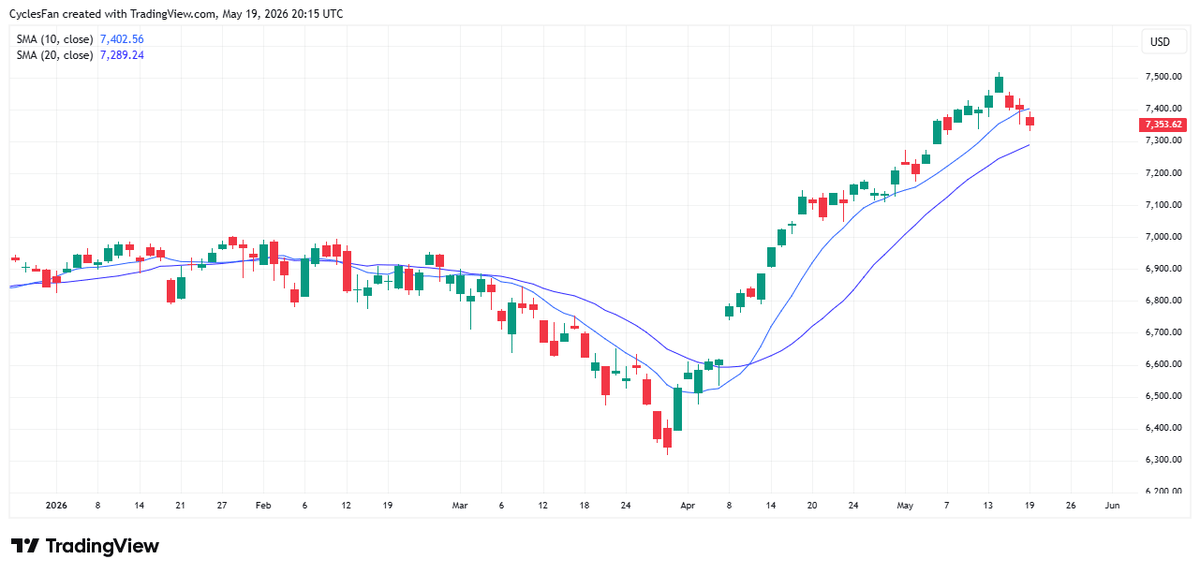
S&P Breaks 10‑Day Trend, Targets 7300
$SPX - Closed below the 10 day MA after 34 consecutive trading days above it. Therefore, the odds favor further downside to the 20 day MA that will be around 7300 tomorrow. https://t.co/WnNLq9oqnW

VWAP Bands Reveal Market Balance, Sharpen Trade Entries
Most traders use VWAP completely wrong. VWAP isn’t just support and resistance. The deviation bands show you whether the market is balanced… or in true price discovery. Once you understand that, your entries become far more precise. Comment BANDS and I’ll show you how...
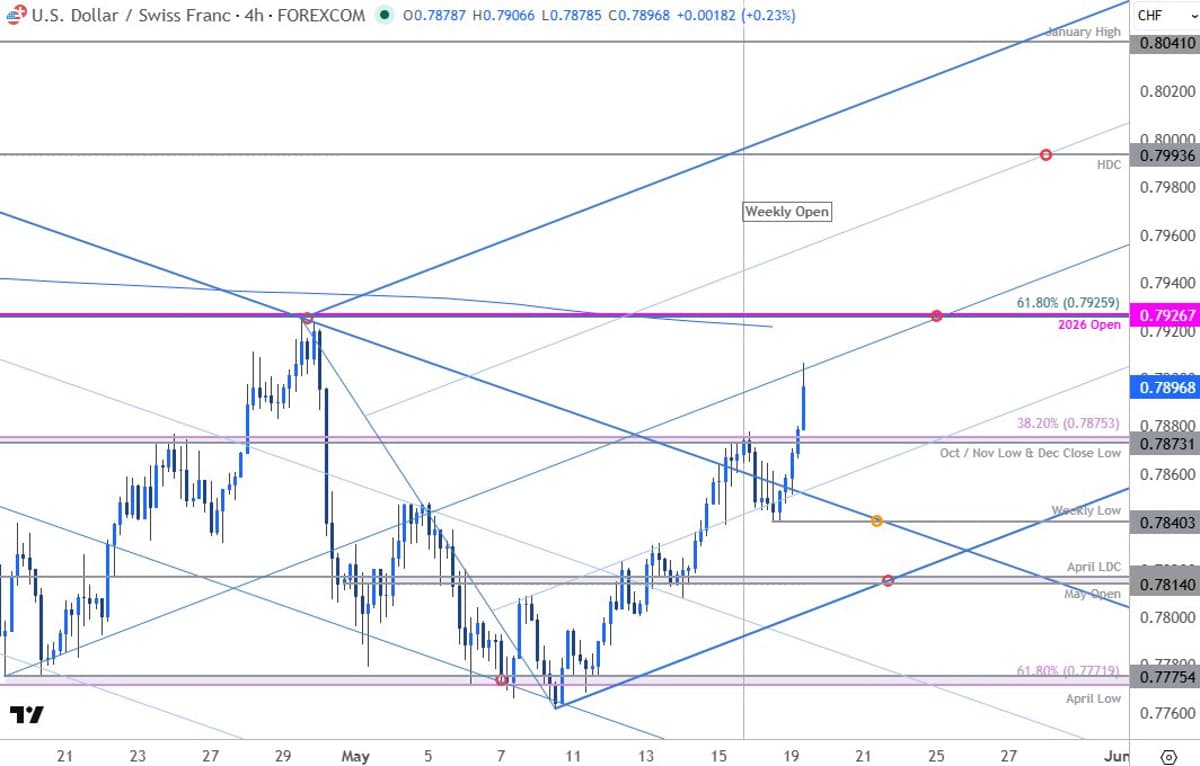
USD/CHF Breakout Hits First Major Resistance
Swiss Franc Short-term Outlook: USD/CHF Breakout Faces First Major Hurdle https://t.co/Z8ntLPDeM6 $USDCHF Daily & 240min Charts https://t.co/6nV1PEQVkf
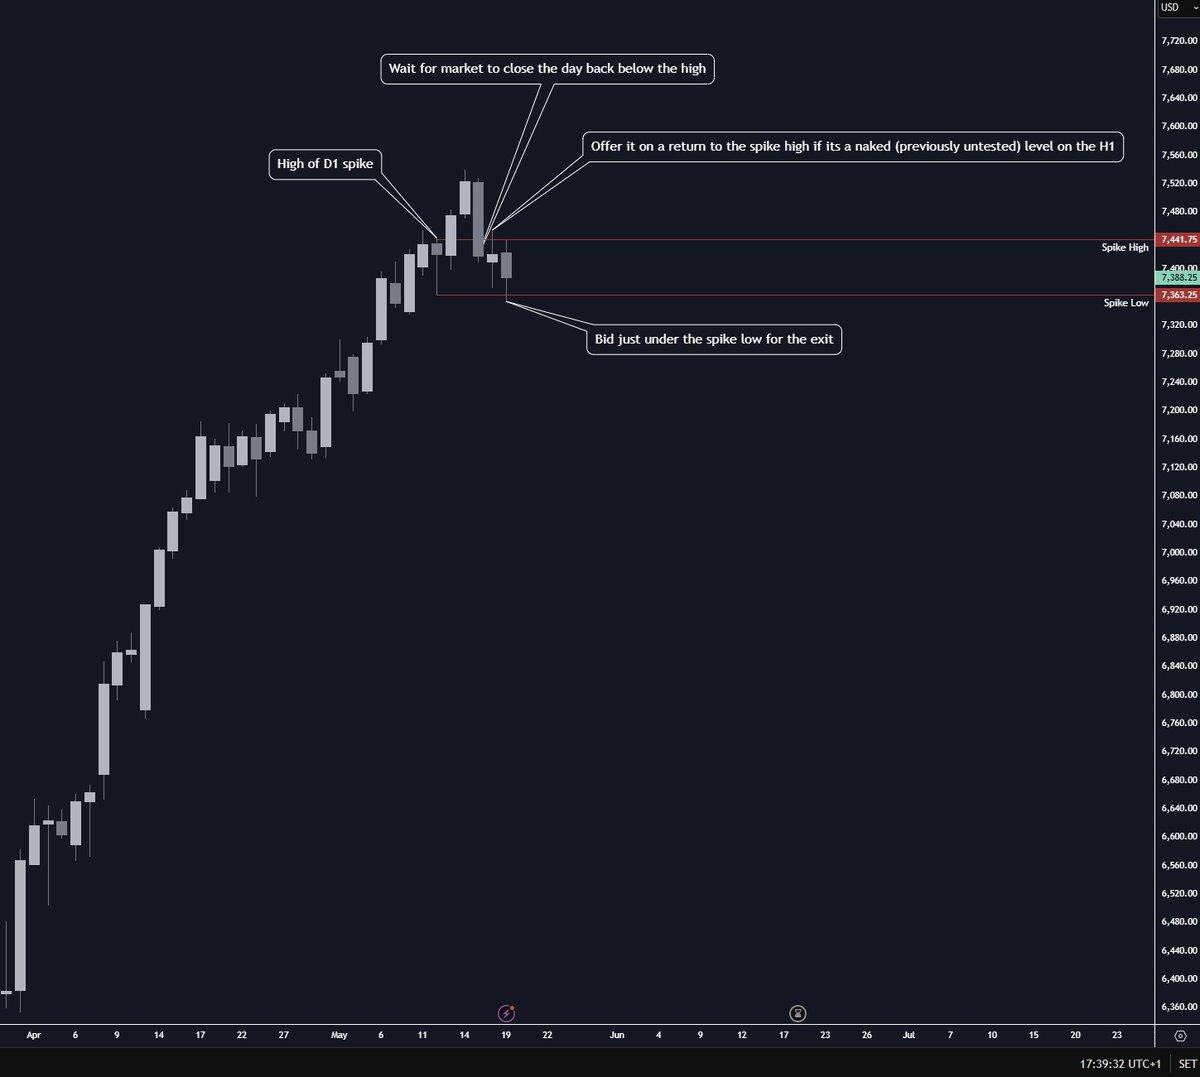
Trade the Spike: Exit Below Daily Close
Sure. Attached is the D1 ES chart. The HTF thesis is simple, buyers get caught and stops get run. Wait for a daily close back below the spike high, offer the retest of that high if it remains naked on...
PLTR Flips From Weakest to Strongest Amid Pullback
Well of course. $PLTR was the weakest of the bunch during this minor pullback, but since the pullback started, it has been the strongest of the bunch. You short weakness or do you fade short-term extremes?
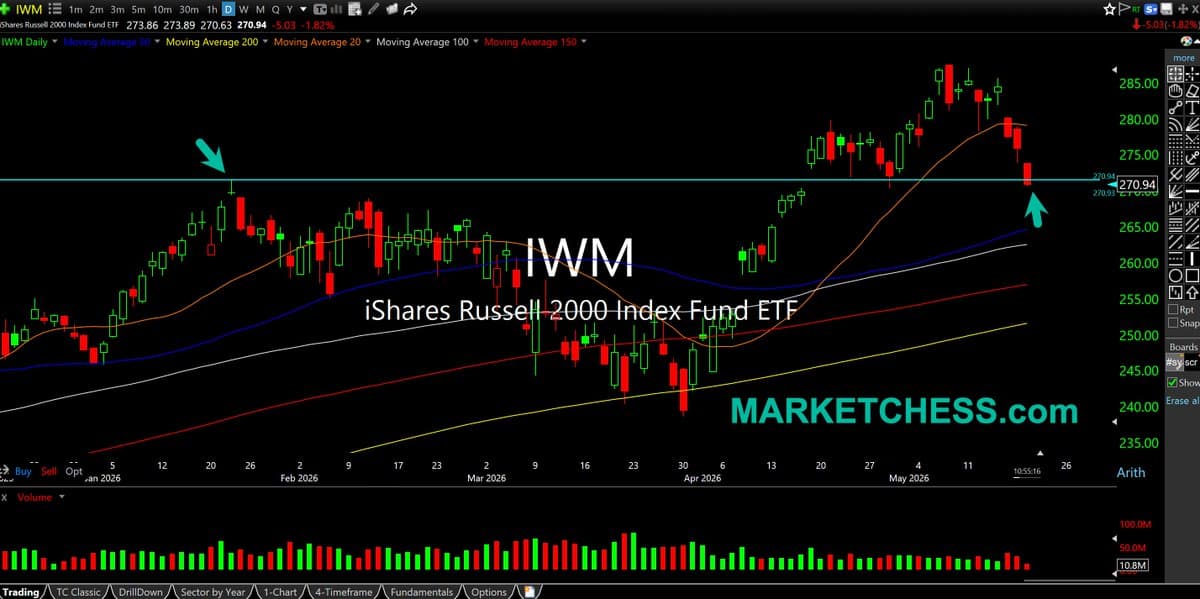
IWM Below Jan High, Bull Trap Looms
$IWM Daily. Small cap dipping below $271.60, the prior highs from January. Failure to reclaim this spot by bulls opens door to the recent breakout being a major bull trap. https://t.co/qqVz2SeDuC
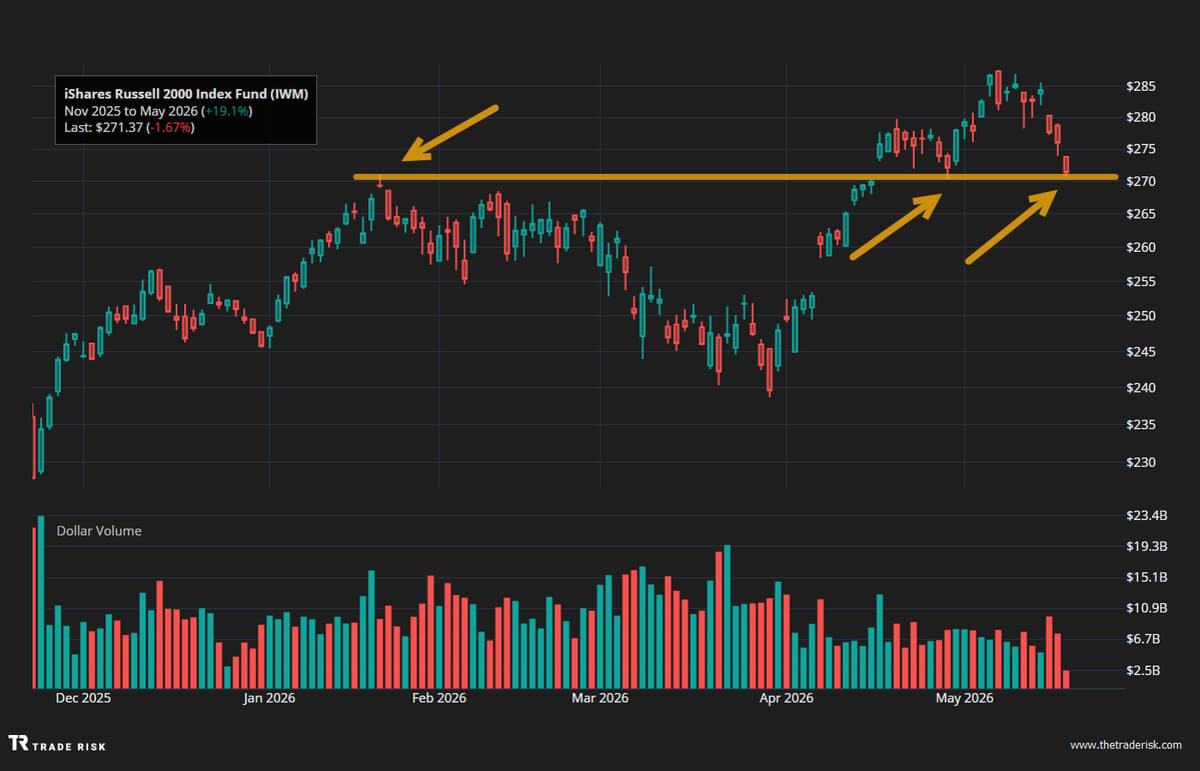
Russell 2000 Tests Late‑April Pivot After 6% Drop
Russell 2000 down 3 days in a row, 6% from highs and testing that late April pivot. Let's see if we can keep this pullback "innocent" by holding around here. $IWM https://t.co/KUuIj6sV3T

High‑Beta Momentum Slides 6.5% Today
CHART OF THE DAY: High Beta Momentum Down -6.5% On The Day https://t.co/kmY1WhmnJB via @hedgeye

Buy May 22 300/292.5 Put Spread, Target $7.50
$HD "Trade Idea 1: Buy the May 22 Expiry 300/292.50 1×2 Put Spread for 20 cents.' sell to close a 300/292.50 put spread near $7.50 or watch to max Friday, let IV fall then can buy to close remaining put...
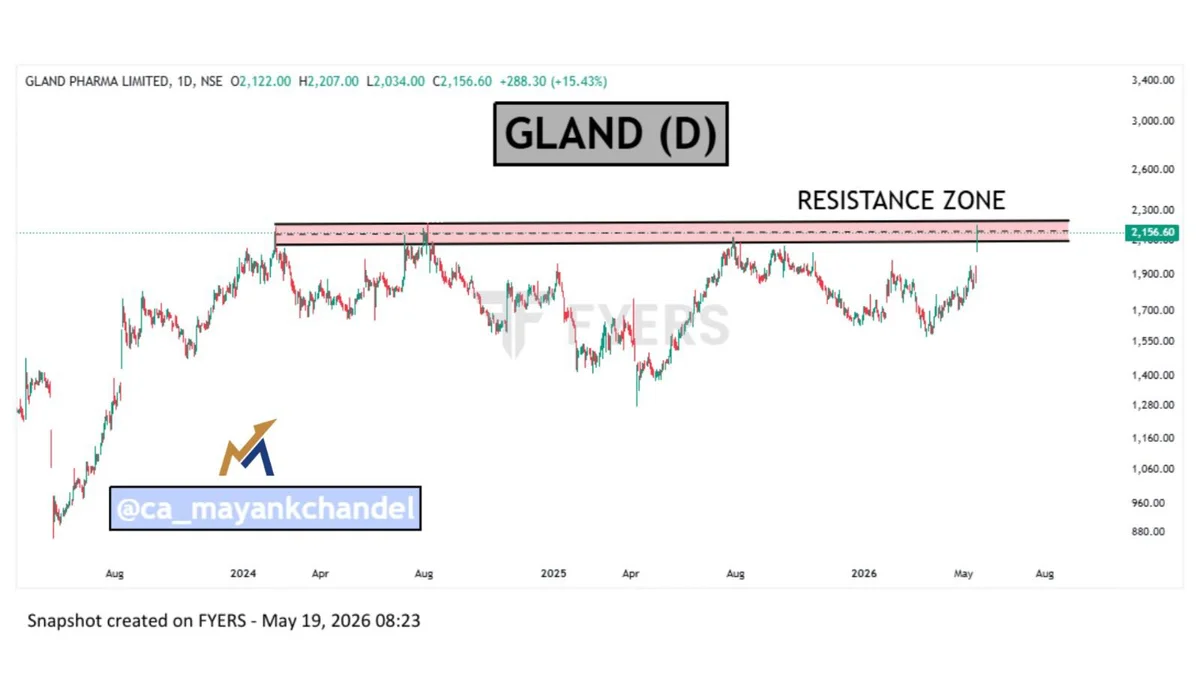
GLAND Poised for Breakout Above ₹2208, Targeting ₹3125
📌 GLAND GLAND is trading near a key resistance zone . Once it gives a clear breakout, the stock has a high probability of entering an uptrend . Entry: Above ₹2208 Stoploss: Below ₹1935 Target: ₹3125 Not a buy or sell...
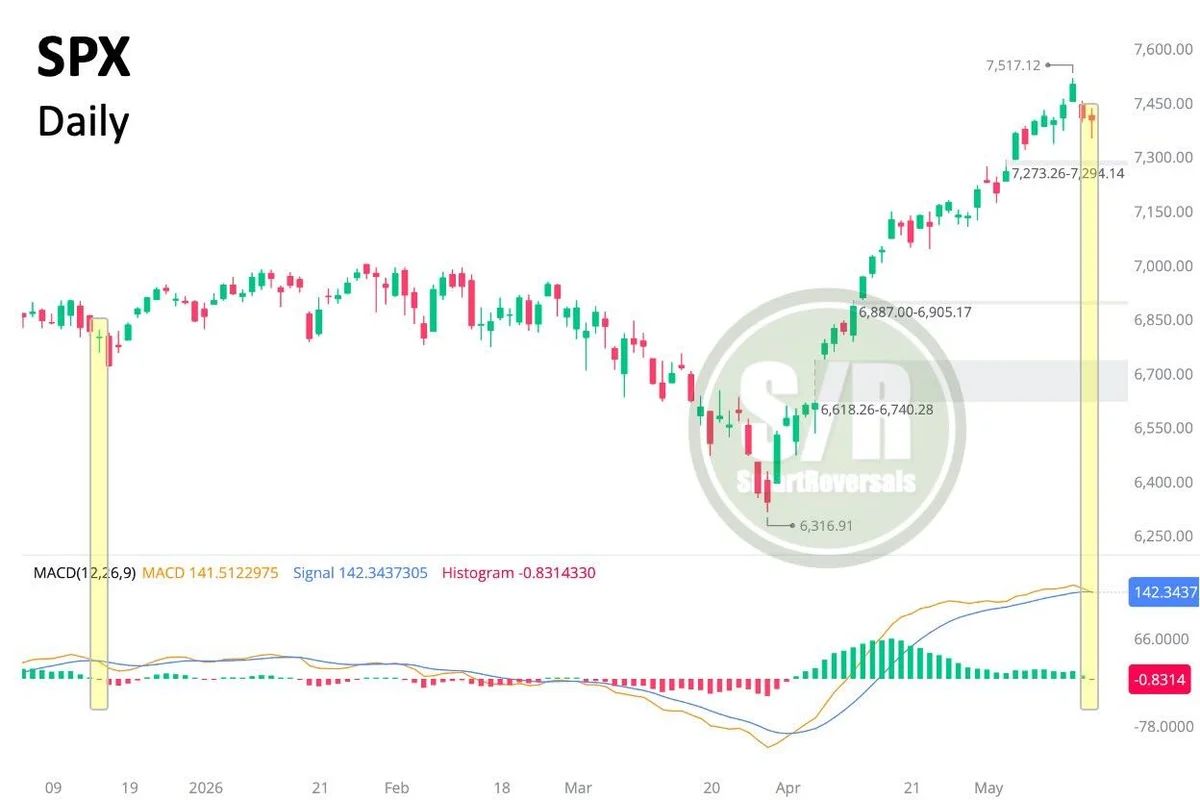
Dip Buyers Trigger Bullish Reversal Near 7,360 Zone
SPX: Dip buyers jumped in close to the 7,360 daily demand zone. The candle suggests a bullish reversal, the MACD crossover indicates the trend is switching, making further decline likely. The gap at 7,273 is a must-watch zone. #SPY.

FTSE Small‑Cap Stalls Near 7,800 Resistance
#FTSEsmallcap doji Candle and Sideways. Resistance 7815, 8000. Support 7604, 7519, 7321. RSI 55.5 bit off Neutral. 13/21 day EMAs Bullish. Top Bollinger Band 7813. Midpoint Line 7753. Bottom Band 7692.

AIM Faces Down Candle, Holds Near Bullish Support
#AIM All Share Down Candle. Support 785, 763, 741. Resistance 824, 837. RSI 57 not high. 13/21 day EMAs Bullish. Top Bollinger Band 826. Midpoint Line 812. Bottom Band 797.

S&P 500 Hovers Near ATH, Bearish MACD Crossing Soon
#SP500 doji Candle near ATH 7517. Support 7294, 7046, 6790. On verge MACD Bear Cross. RSI 68.5 high but not Overbought. 13/21 day EMAs Bullish. Top Bollinger Band 7515. Midpoint Line 7393. Bottom Band 7272.

Dow Near ATH Resistance, Bullish EMAs Hint Uptrend
#DOW doji Candle and Sideways. Resistance ATH 50513. Support 48708, 48000, 46978. RSI 58 not high. 13/21 day EMAs Bullish. Top Bollinger Band 50078. Midpoint Line 49682. Bottom Band 49293.

Brent Oil Eyes Resistance Near $115 Amid Bullish Signals
#BrentOil Comp Doji Candle but drifting up. Resistance $114.7. Support $100, $96.1, $86.1. RSI 59 not high. 13/21 day EMAs Bullish. Top Bollinger Band $112.2. Midpoint Line $105.8. Bottom Band $99.6.
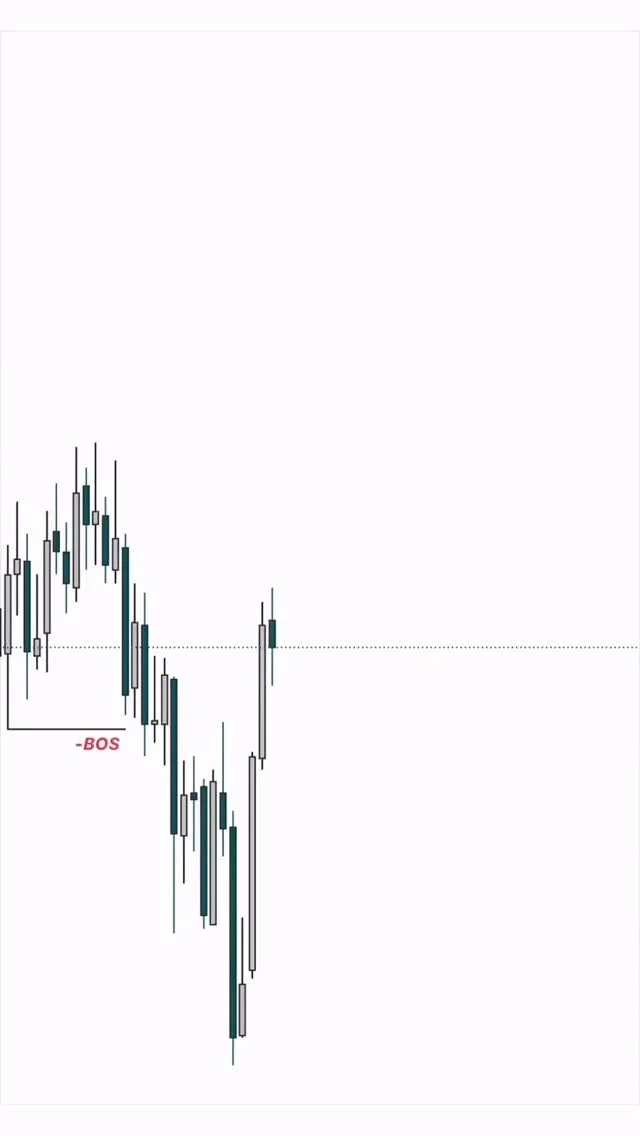
Wait for Liquidity Grab, Then Ride the Move
You didn’t lose… you were liquidity. This chart shows a perfect smart money move — liquidity taken, FVG respected, and price exploded upward. Most traders enter too early. Professionals wait for confirmation. Change your timing, change your results. Follow for real trading knowledge. #ExploreForex #TradingReels...
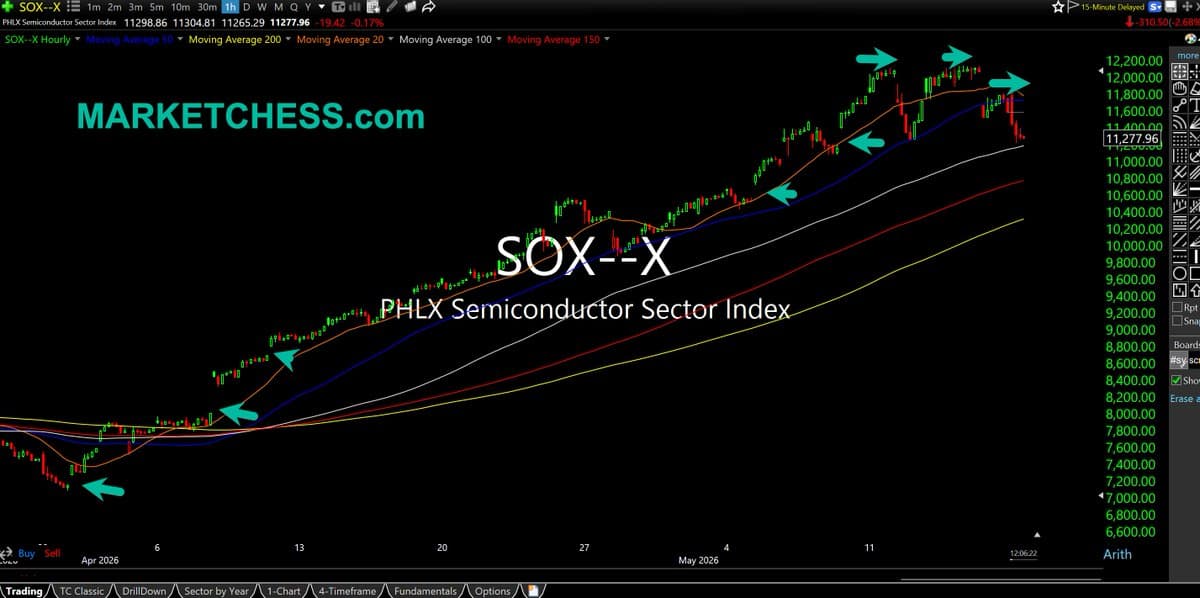
Semiconductor Weakness Emerges Ahead of Nvidia Earnings
$SOX Hourly. Some clear notable relative weakness for semis today. NVIDIA earnings this week. Tons of (mostly) open gaps below since end of March. This timeframe finally looking toppy. $SMH $NVDA https://t.co/9AIXPkgLS5
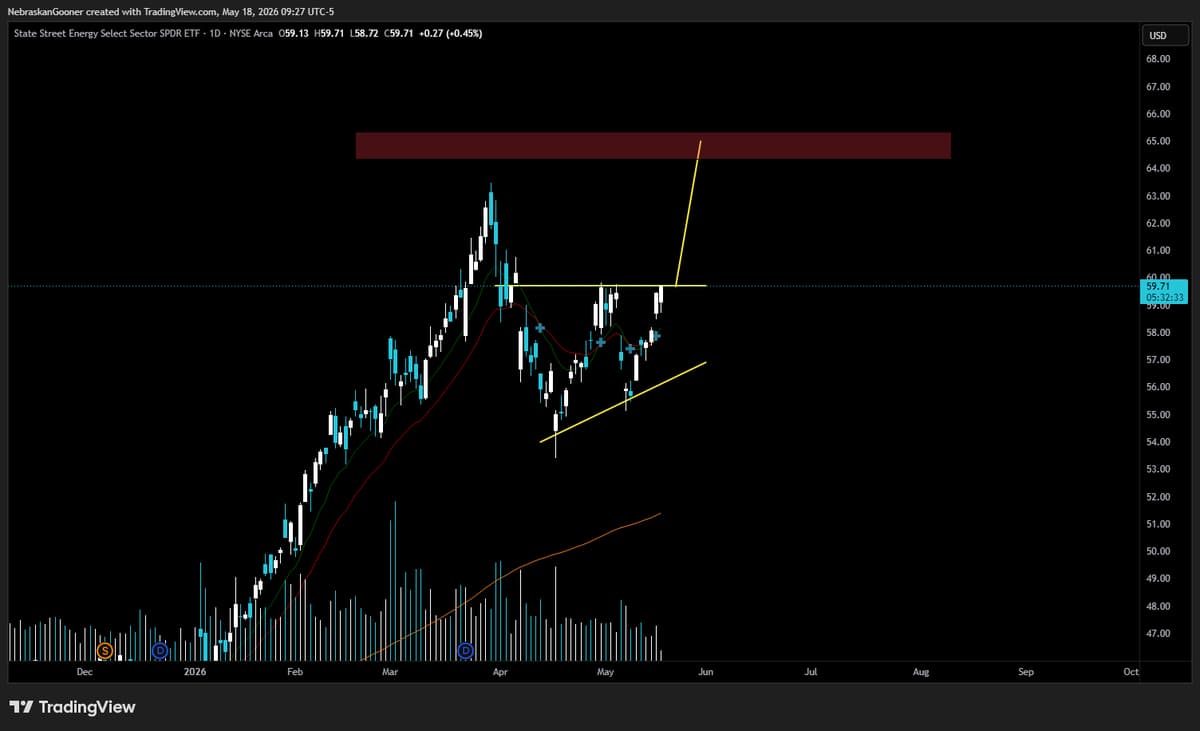
XLE Triangle Breakout Could Target $65
$XLE Watching for a triangle breakout. Would yield a measured target in the $65 ball park. https://t.co/UiUpSpmMnX
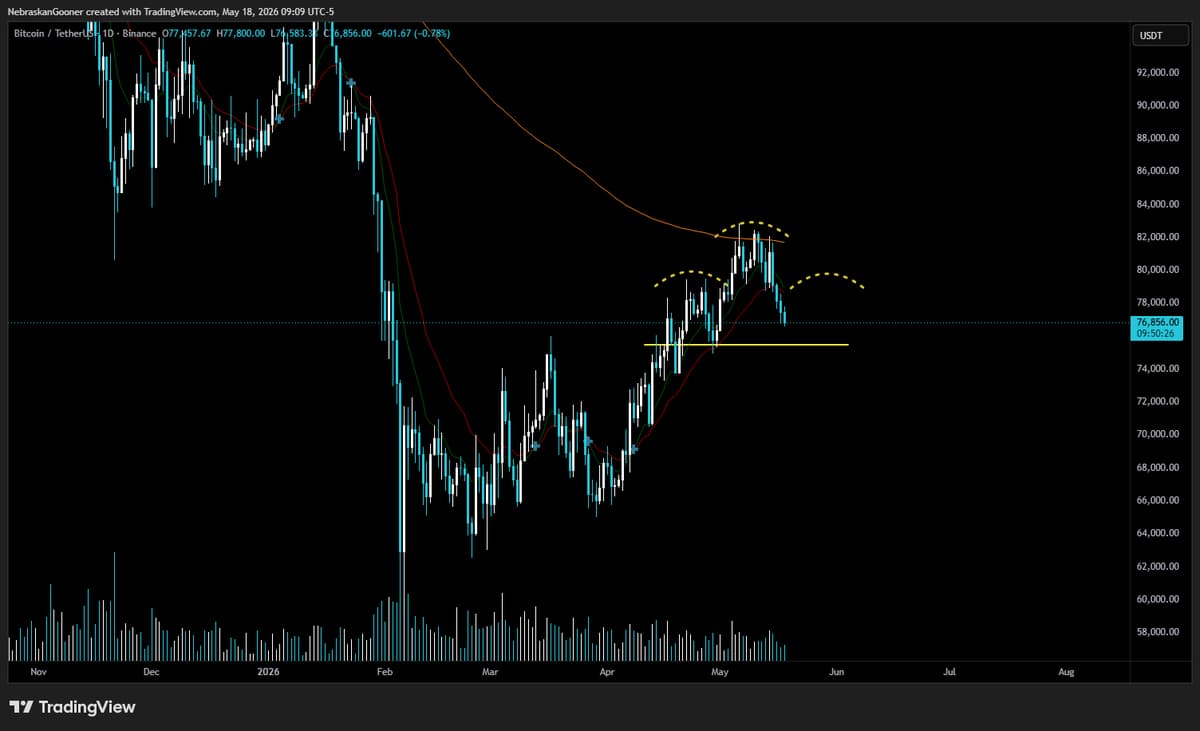
Bitcoin Faces Resistance, Possible Head‑Shoulders Formation
#Bitcoin Not the kind of rejection we want to see at key resistance. Still chance for more upside but more of a grey area right now. Chance for some chop around here could consider the potential for price action to form...

SPY Rally Falters, Defensive Positioning Needed Now
📺 MARKET TREND SHIFT? WHAT YOU NEED TO KNOW We may have a potential shift in the market $SPY character after an extremely strong rally. The fast-moving bullish “active sequence” may end and turn into a more corrective phase. So, traders may...

Late‑Stage Throw‑Over Signals Trend Exhaustion and Blowoff Top
Textbook example of a "late-stage throw-over". Price closes above a well rising trendline late in the game. This signals trend exhaustion, a buying climax or blowoff top. SP Weekly chart: https://t.co/UwG6U7F47V

Stop Replaying Last Month—Embrace Aggressive, Straight Moves
1/10 Most traders are still playing last month’s game. They’re stuck in the “should’ve held… should’ve sized up… should’ve ignored the stop” loop. The market rewarded aggression for weeks. Straight moves. Violent expansions. Minimal pullbacks. That’s the trap.

S&P 500 Rally Shows Signs of Fading Momentum
Just saw a deep dive on the S&P 500’s topping pattern. Key data points suggest the current rally might be losing steam. Not time to panic, but worth watching the technicals closely. 🐻📉 MarketWatch
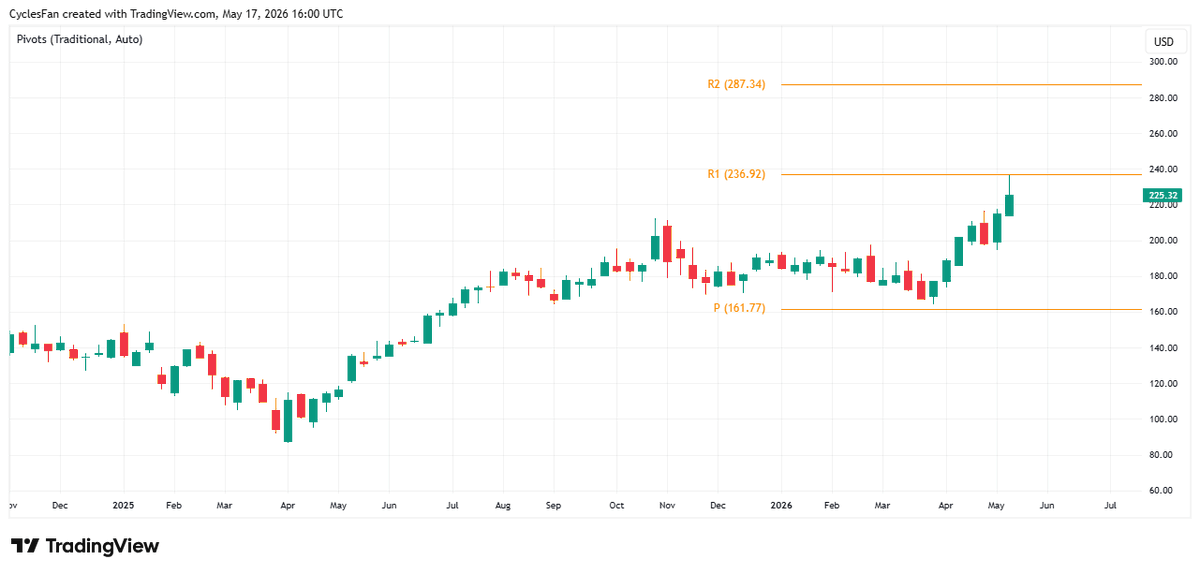
NVDA's 237 Resistance Test Signals Potential Top
$NVDA - At the intra week high it reached the 1st yearly resistance at 237 and then dropped 4.9%. If the market has a negative reaction to earnings it may have made an early intermediate term top. On the other...

MicroStrategy May Dump BTC as Price Nears $80k
BTC $78k; U.S. retail holders 67M. MSTR to retire $1.5B notes and may sell BTC to fund STRC dividends; Risk: corporate selling vs. retail demand; Trade: no new longs < $80k. — Viktor Kopylov, PhD, CFA. More insights: t.me/si14Kopylov
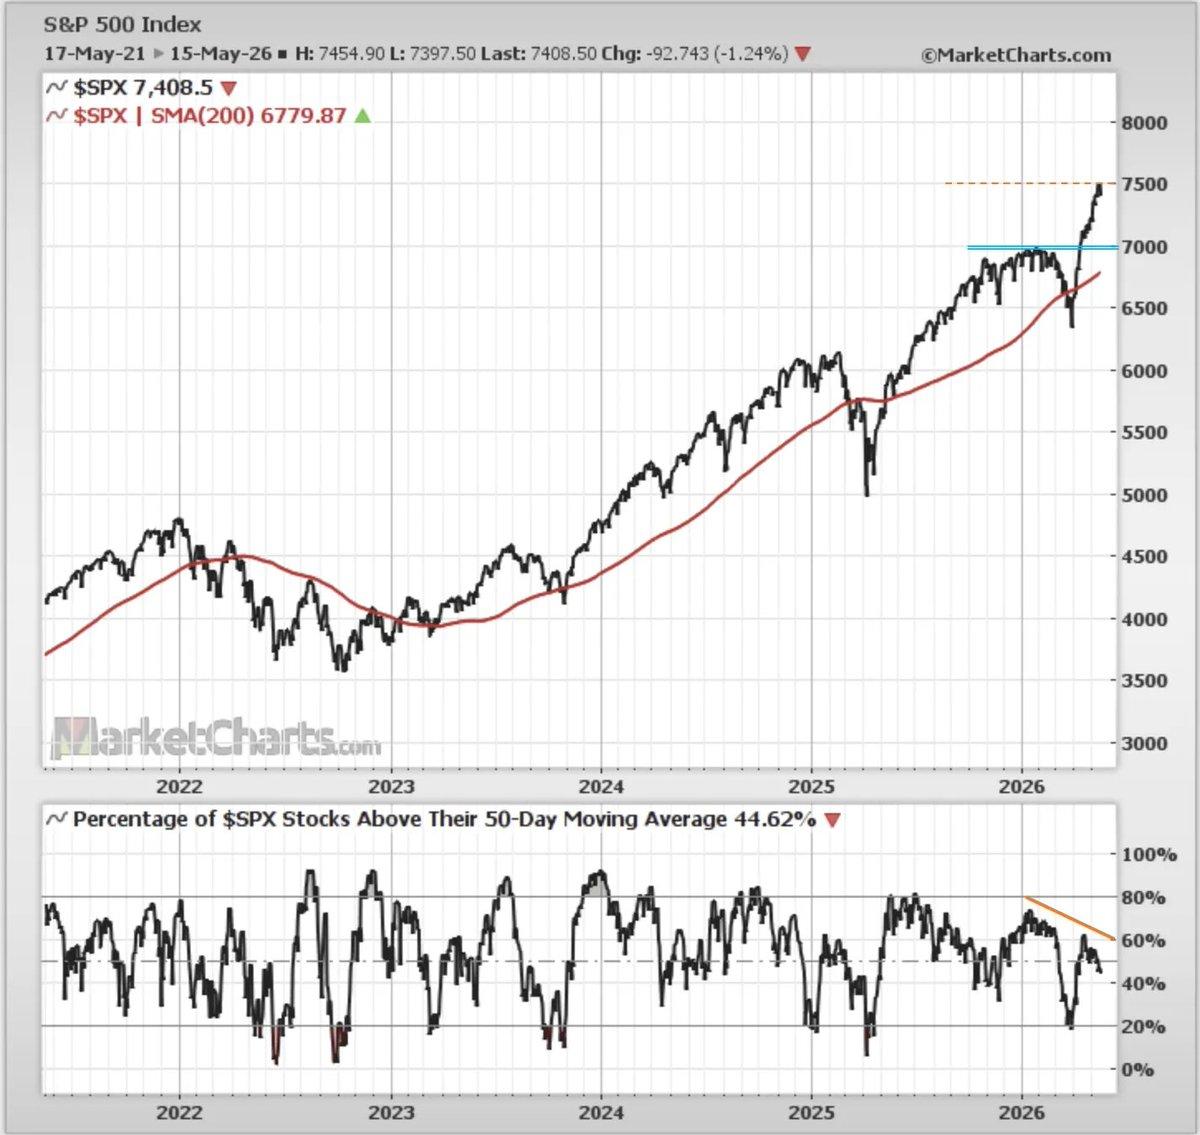
S&P 500 Near 7.5k Ceiling Amid Rising Risks
Weekly S&P500 ChartStorm https://t.co/4KILHPD7hO This week: the 7.5k ceiling, risk-watch, steam (momentum, margin debt, leveraged ETFs, semis, valuations), case for commodities, software stocks setup... https://t.co/gq1Z6aJTYG
Meta Slides Below 20‑Week MA, Threatened by New Low
$META - The only MAG 7 stock that is trading below its 20 week MA which puts it in a weekly downtrend. Unless it closes above the 20 week MA in the next few weeks it's at risk of making...
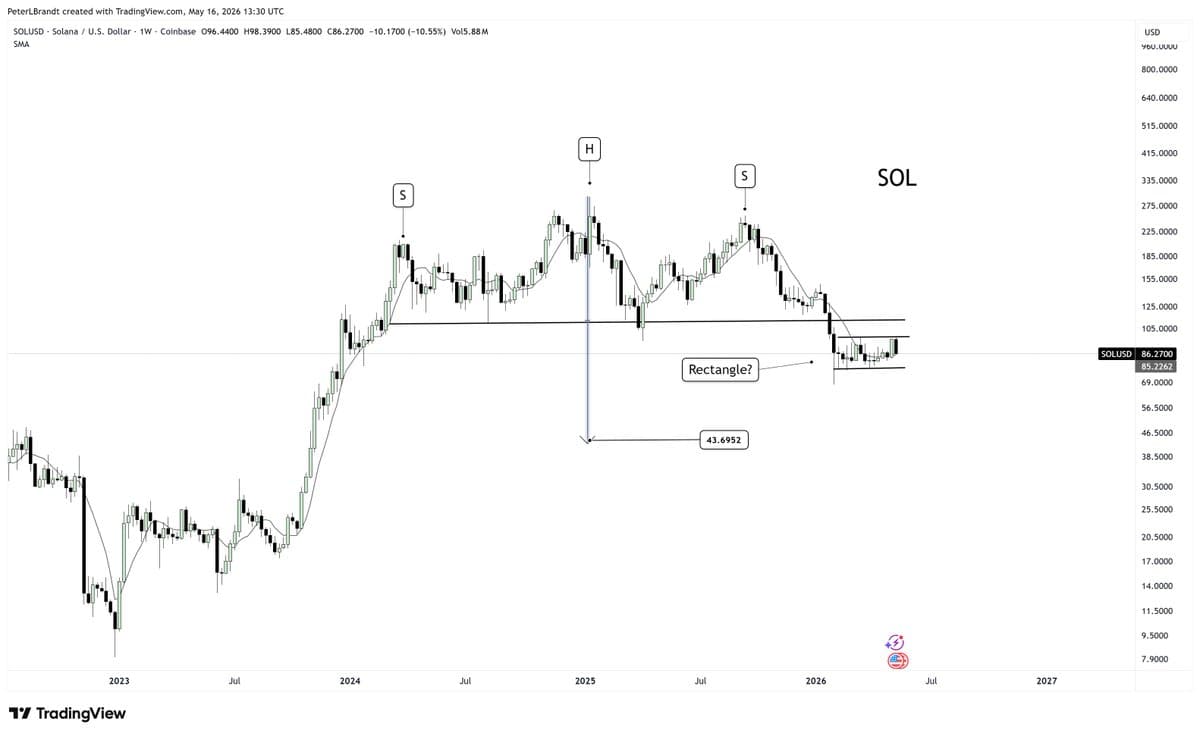
SOL Faces 14‑week Rectangle; Downside Break Could Hit $43.70
The Factor Report™️ does NOT make predictions We present possibilities The weekly chart of $SOL now presents a 14-week rectangle If it is a continuation rectangle with downside BO, then the 43.70 target from the massive H&S top will be confirmed https://t.co/bT8rhhtLeC
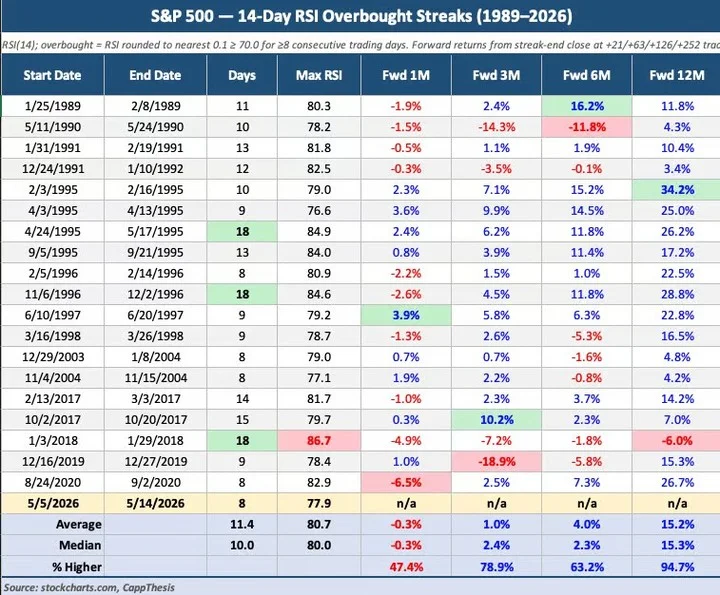
Respect Overbought Levels, But Not Yet Bearish
"Overbought conditions deserve respect, particularly after such a powerful run from the March lows. But overbought does not automatically mean bearish. Bearish price action occurs when bullish patterns start to fail; so far, that has yet to happen." Frank Cappelleri, CappNotes