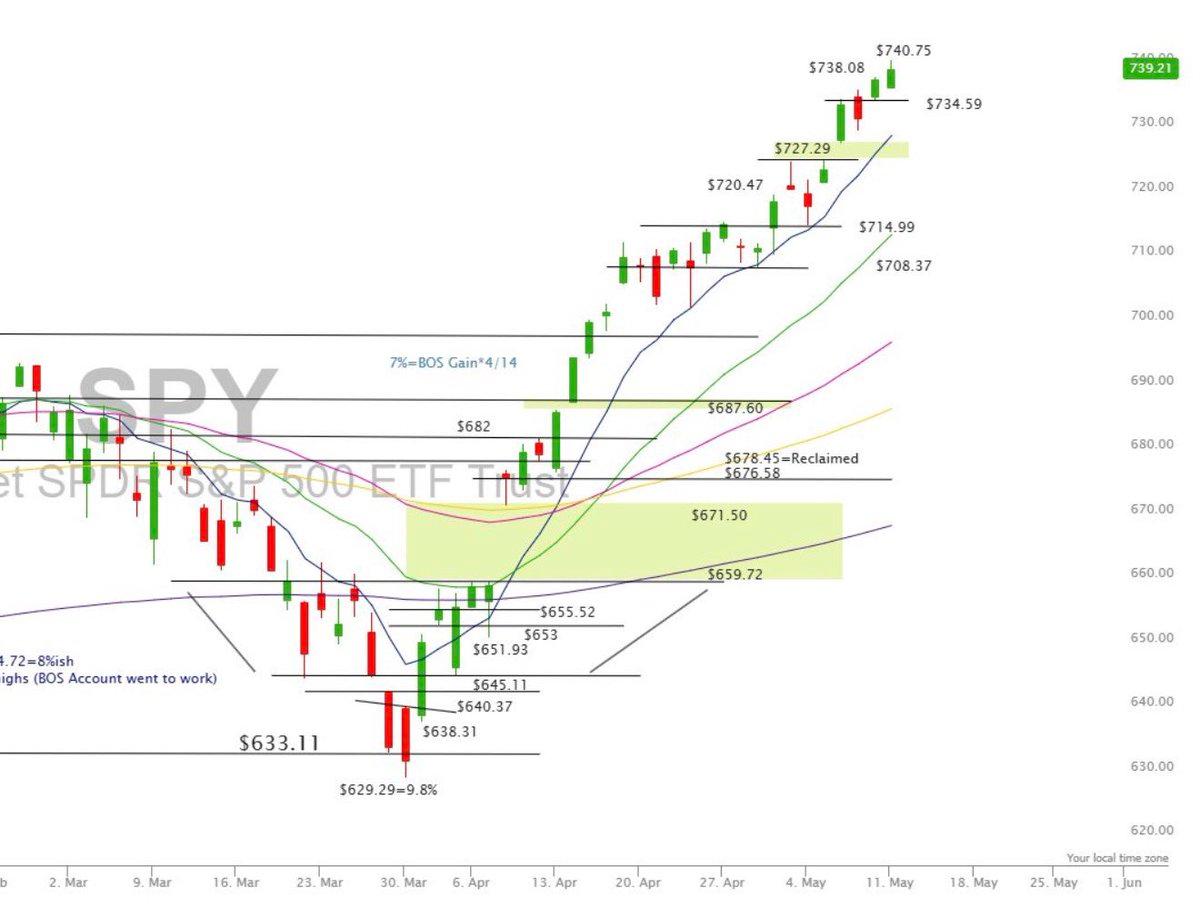
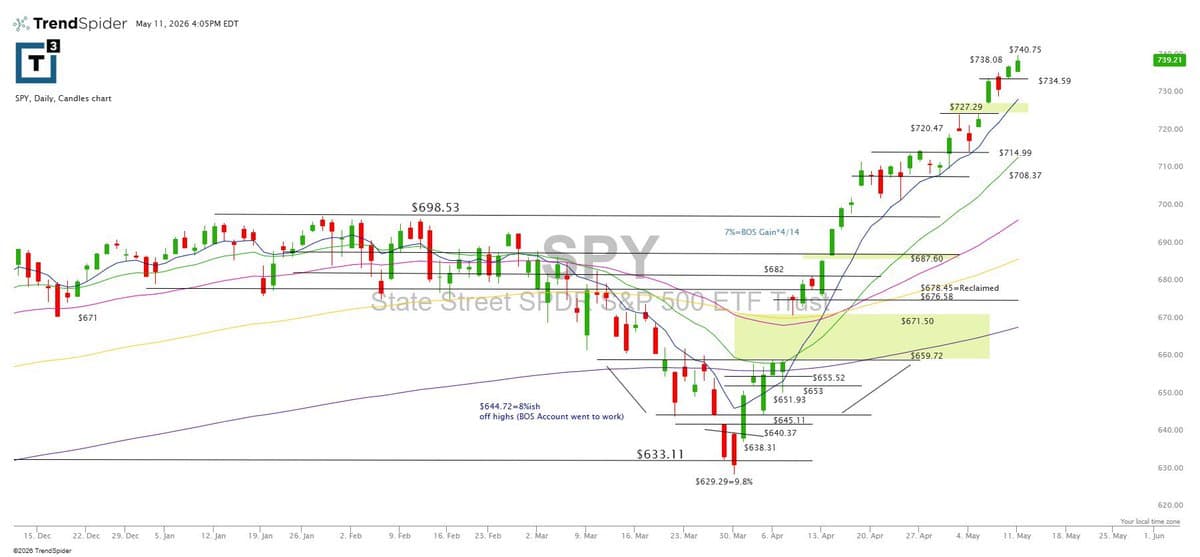
Markets Slide; SPX Futures Test 8‑day Support
Mostly red arrows around the World as markets are allowed a down day. Europe and Asia lower $spx futures -29 as we see if 8day holds to keep current upper speed and composure or does it change a bit. $spy hit $740+ to manage. $734.50ish is active support spot but the 8day is closer to $729 now
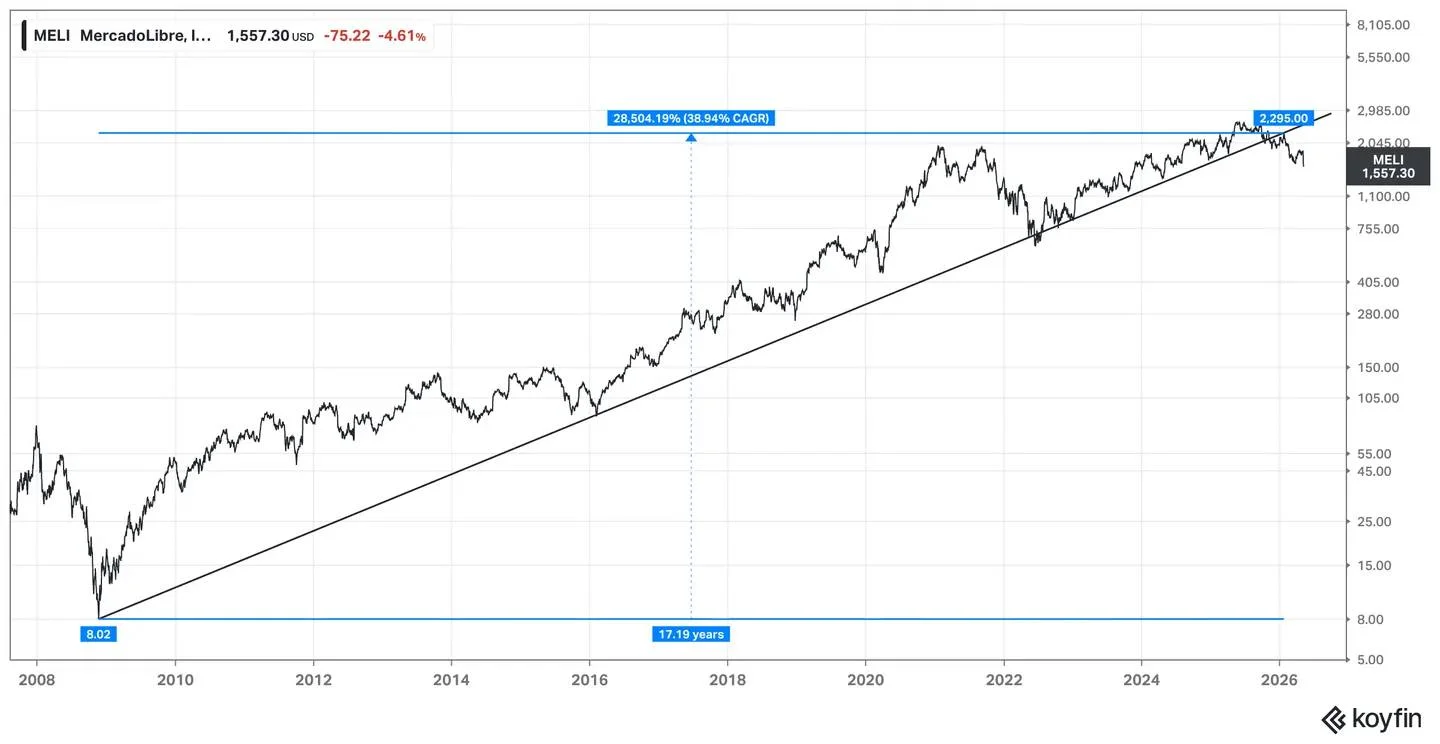
Steep Uptrends Yield Sharp Reversals: MELI Faces Downside
The longer and steeper the uptrend, the more violent the reversion when it finally breaks. $MELI has compounded at almost a 40% CAGR over almost two decades. The stock is in a 40% drawdown. I could see more downside here, even though I...
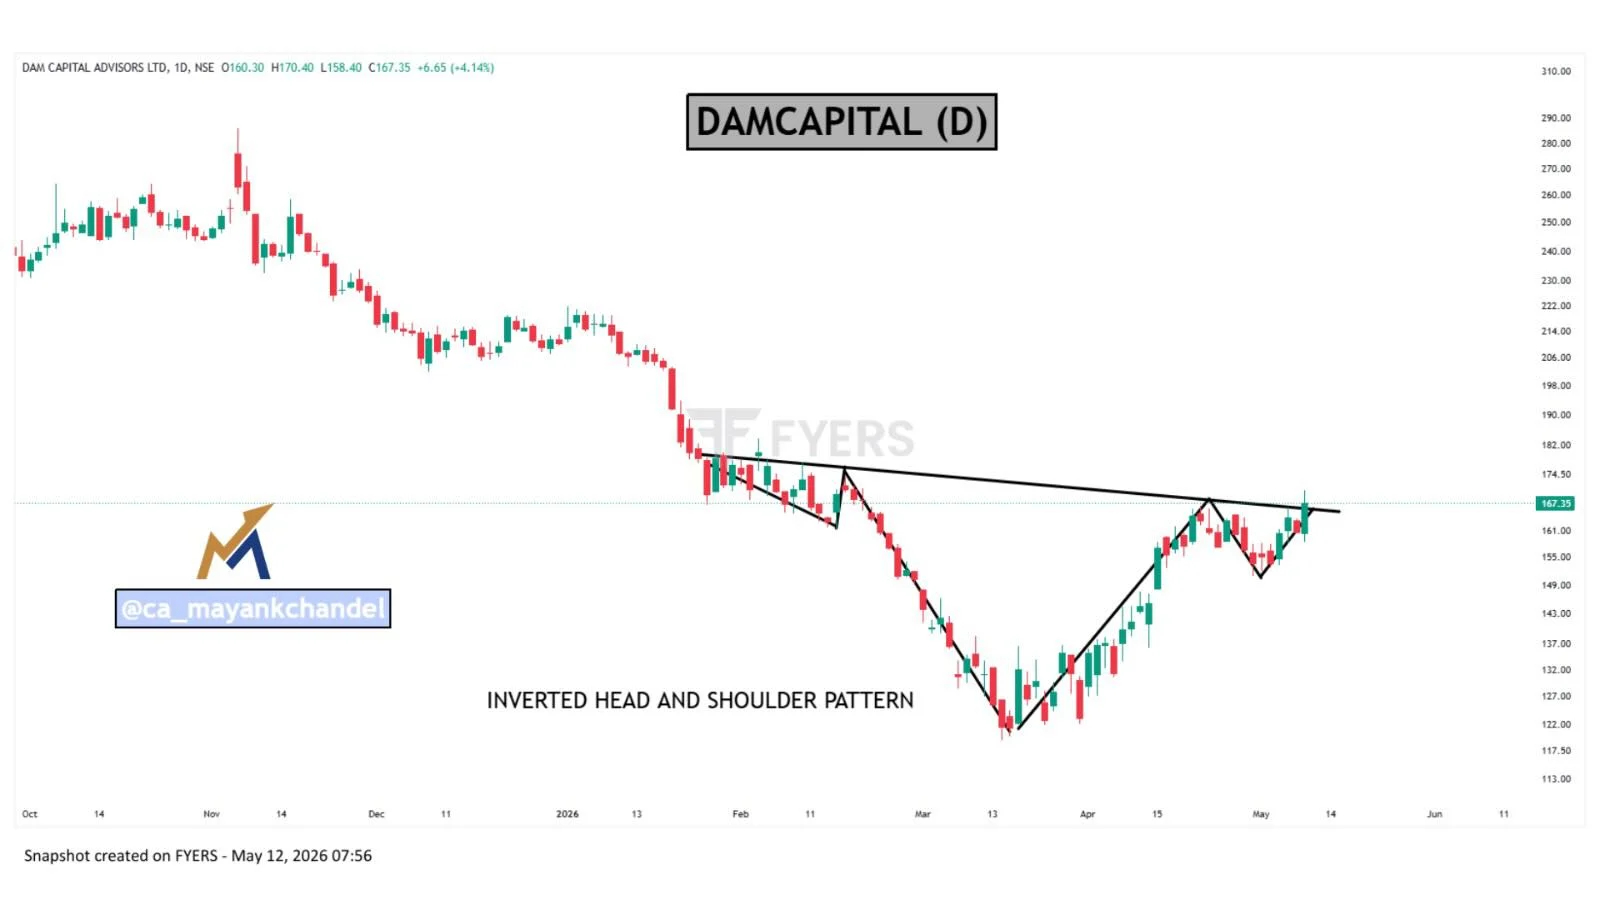
DAMCAPITAL Shows Bullish Inverted Head‑Shoulder Signal
#DAMCAPITAL DAMCAPITAL has formed an inverted head and shoulder pattern, which is considered a bullish reversal setup. Keep it in your watchlist for a potential trading opportunity 👀🚀
Warsh Nomination Sparks Fed Politicization, Prompting 10Y Selloff
Macro: Warsh nomination raises Fed politicization. Key: White House pressure, rate path, balance-sheet plans. Risk: policy uncertainty. Trade: shorten duration—sell 10Y Treasuries into June meeting. — Viktor Kopylov, PhD, CFA More insights: t.me/si14Kopylov
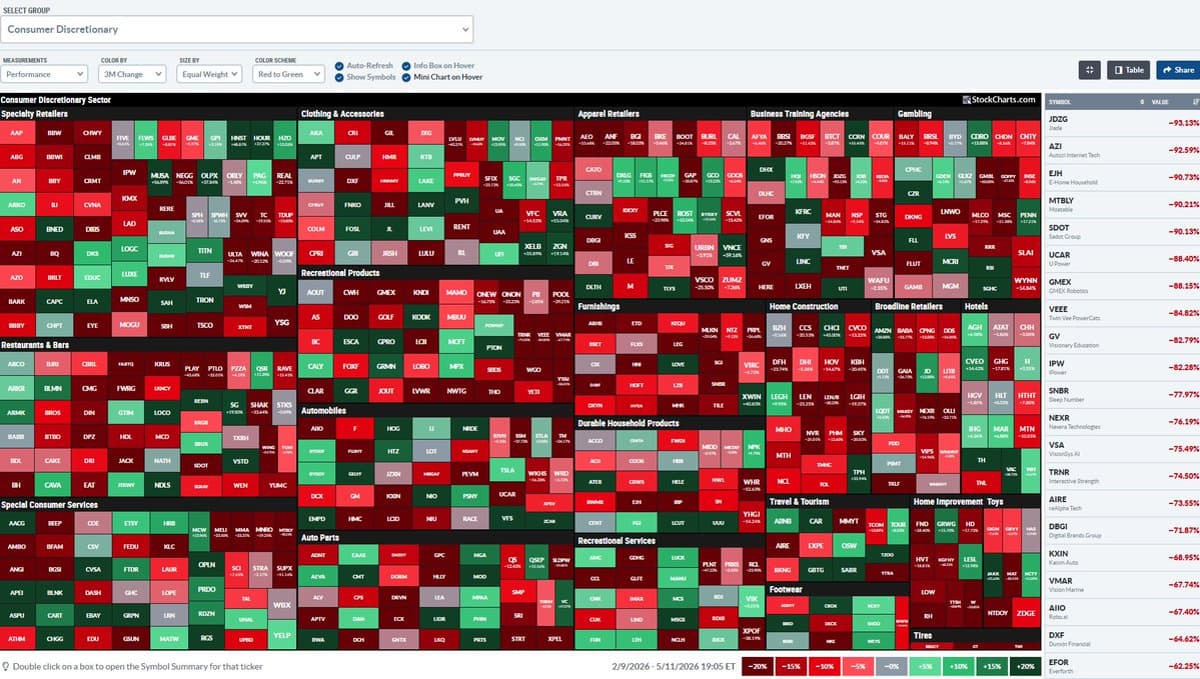
Consumer Discretionary ETF Sizzles Amid Economic Headwinds
Equal-weight Consumer Discretionary ETF 3-month performance heat map is an inferno @stockcharts $RSPD Gas prices, another pandemic, negative real wages... not good. https://t.co/Ukjd3xD6jl
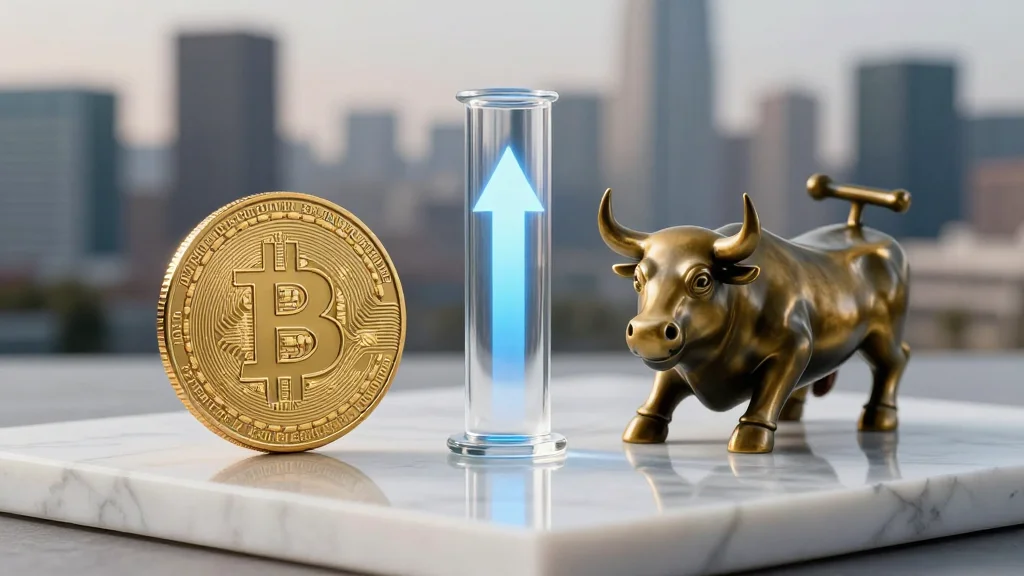
Strategy Peaks; Consider Buying Bitcoin Stock Comeback
Strategy just hit a new high for the year. Should you buy the comeback in bitcoin stocks? https://t.co/iPRNzrNEau #fairleadstrategies
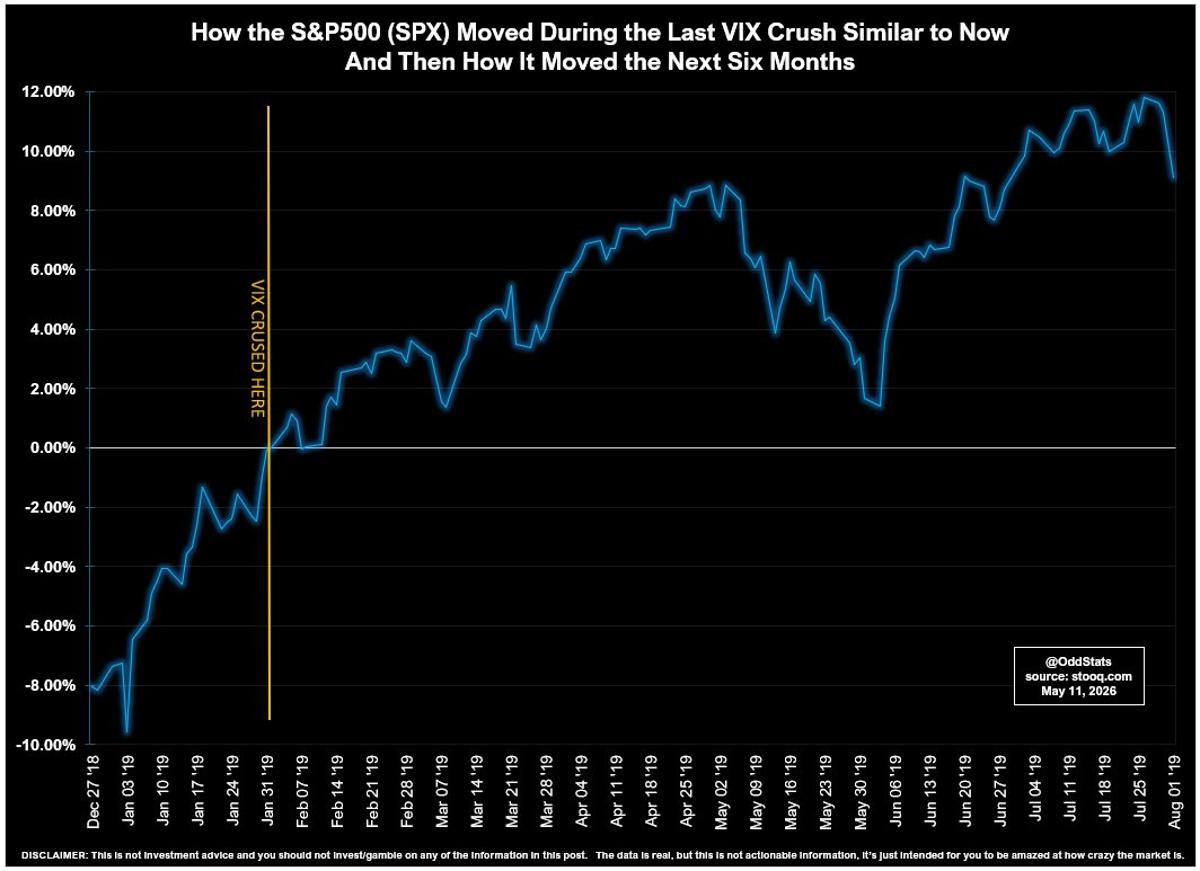
VIX Crash Didn't Trigger Market Decline, Stocks Rose
HISTORIC CRUSHED VIX $VIX just went from above 31.50 to below 16.20 within 27 trading days (intraday, not at the close). A massive turnaround in a very short time. How massive? There's only been one time in the history of $VIX that...
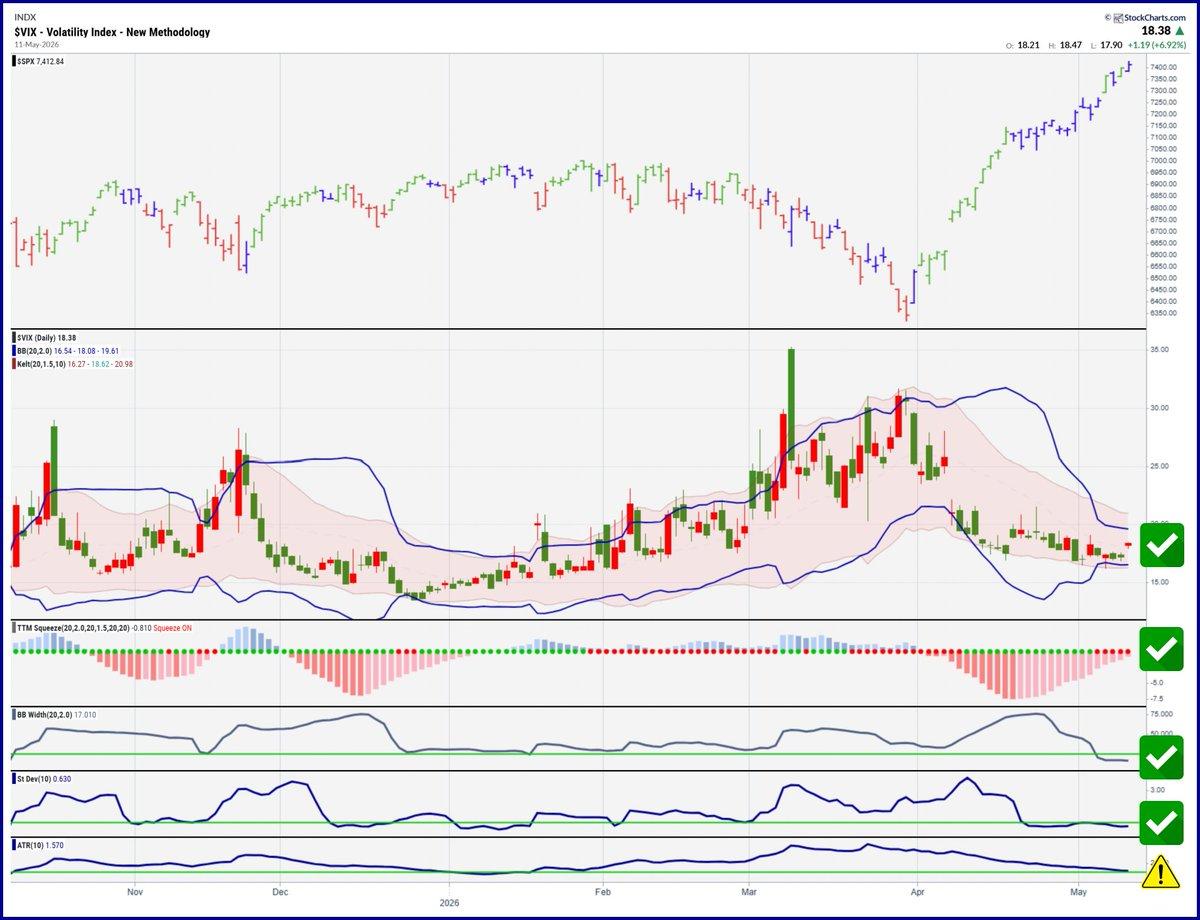
VIX Squeeze Template: Warning Signs & Essential Reading
My VIX squeeze template built on @AndrewThrasher concepts. To avoid confusion, my green checks are warning signs. His paper is a perennial. Do yourself the favor of reading it. https://t.co/qzePB8O2Zn https://t.co/253fqrOzJ2

Retail Investors Bleed on 3x Bearish Semiconductor ETF
Carnage for "Retail Investors" betting on 3x Bearish Semis $SOXS (again) today This sick ETF puppy traded over 296,000,000 shares, lol https://t.co/5hO8uIVmab
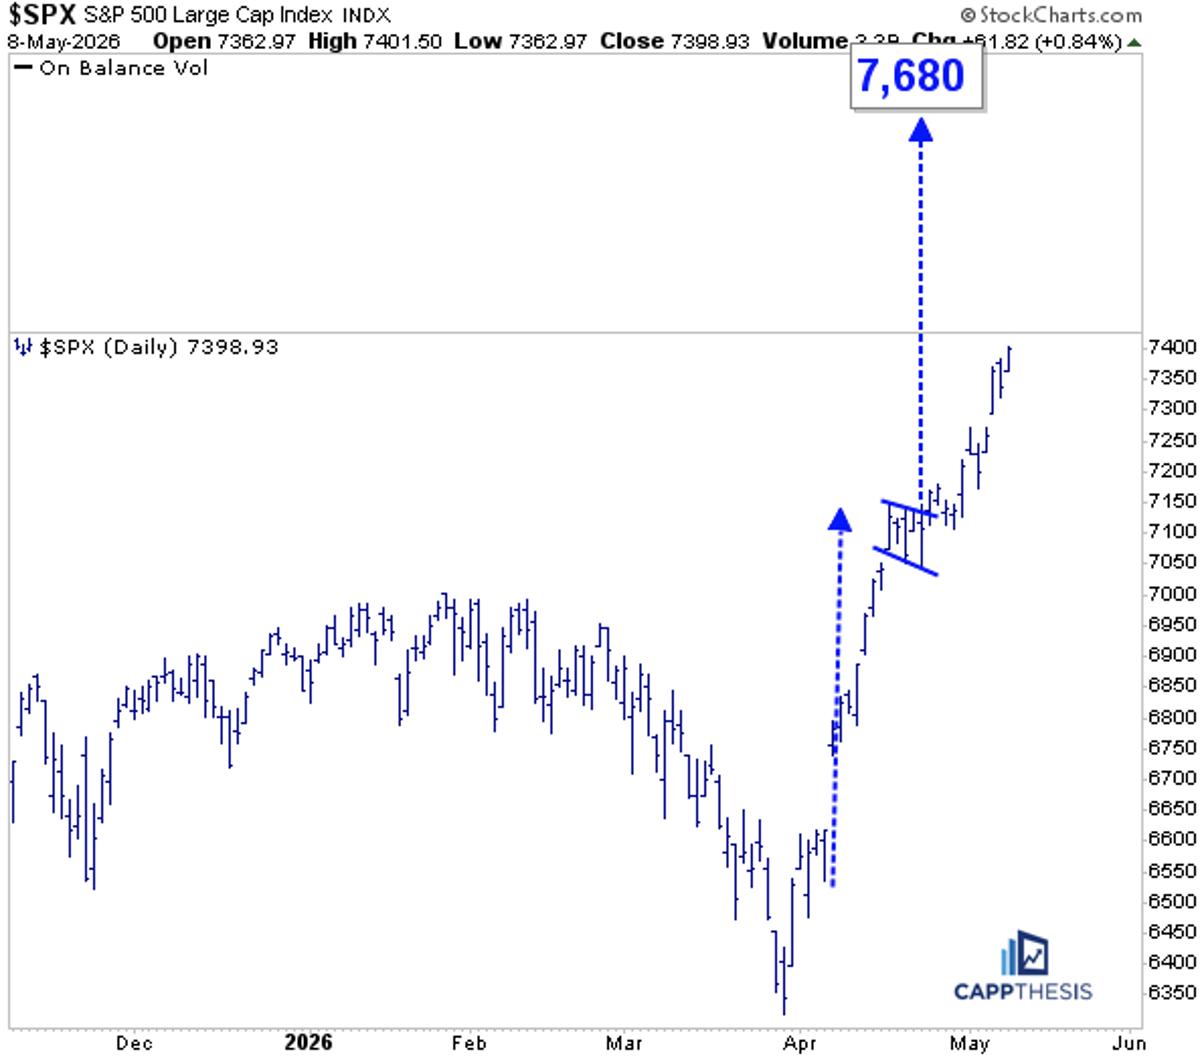
7,680 Target Now Feels Achievable, Not Crazy
The 7,680 target that @FrankCappelleri noted a couple weeks ago doesn't sound so crazy now. https://t.co/aLsedsc8YU

Altcoins Poised for Big Upside as Bitcoin Climbs
There's significantly more upside to come for #Altcoins. Most of them have barely moved against $BTC. Literally almost nothing. Quite often, these moves are violent and fast. They are not gradual as hype cycles are short-lived. That's why you position before the actual move...
FTSE Small‑Cap Stalls Near Resistance, Bullish EMAs Hold
#FTSEsmallcap doji Candle and Sideways. Resistance 7937, 8042. Support 7604, 7321, 7283. RSI 62.5 not high. 13/21 day EMAs Bullish. Top Bollinger Band 7841. Midpoint Line 7708. Bottom Band 7572.

Why the Compound Fulcrum Chart Pattern Excels
This is a good review of one of my favorite chart patterns -- the compound fulcrum

AIM Shows Modest Rise; Watch 837 Resistance
#AIM All Share small Up Candle. Resistance 837. Support 800, 785, 741, 726. RSI 66.5 getting high but not Overbought. Top Bollinger Band 827. Midpoint Line 803. Bottom Band 778.
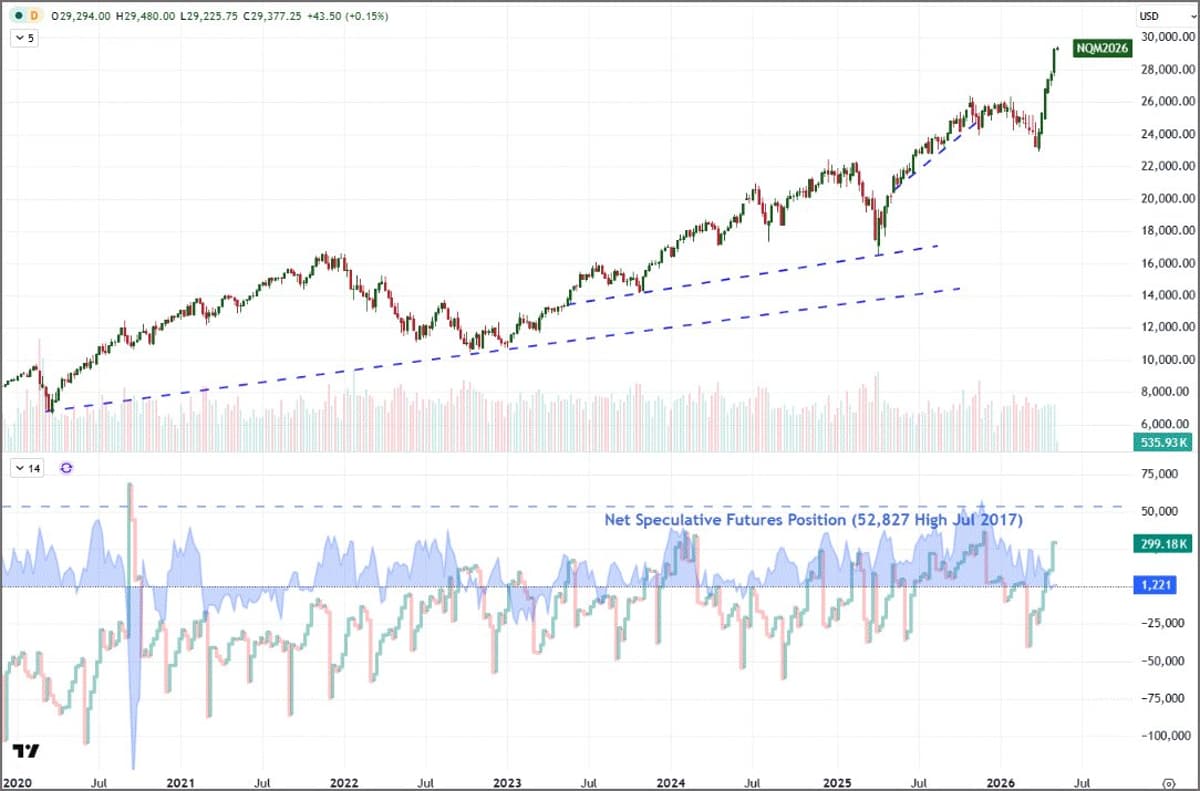
Nasdaq Futures Open Interest Hits Decade Highs, Bull
Checking in on Nasdaq 100 futs activity given this incredible charge. $NQ Open interest has been rising and is near decade-level highs. Net spec futures positioning hovering around neutral - was heaviest net bullish standing in 9 years just six...

FTSE100 Stagnates Near 10,500 Resistance, Bearish Trend
#FTSE100 doji Candle and Sideways 8 days. Resistance 10500, 10683, ATH 10935. Support 10185, 10000, 9670. RSI 44 bit off Neutral. 13/21 day EMAs Bearish. Top Bollinger Band 10446. Midpoint Line 10304. Bottom Band 10160.
SPY Closes Strong Using Tiered Active Sequence
$spy post close as we move our feet and use a tier system in this strong active sequence https://t.co/os0VlQP1yj
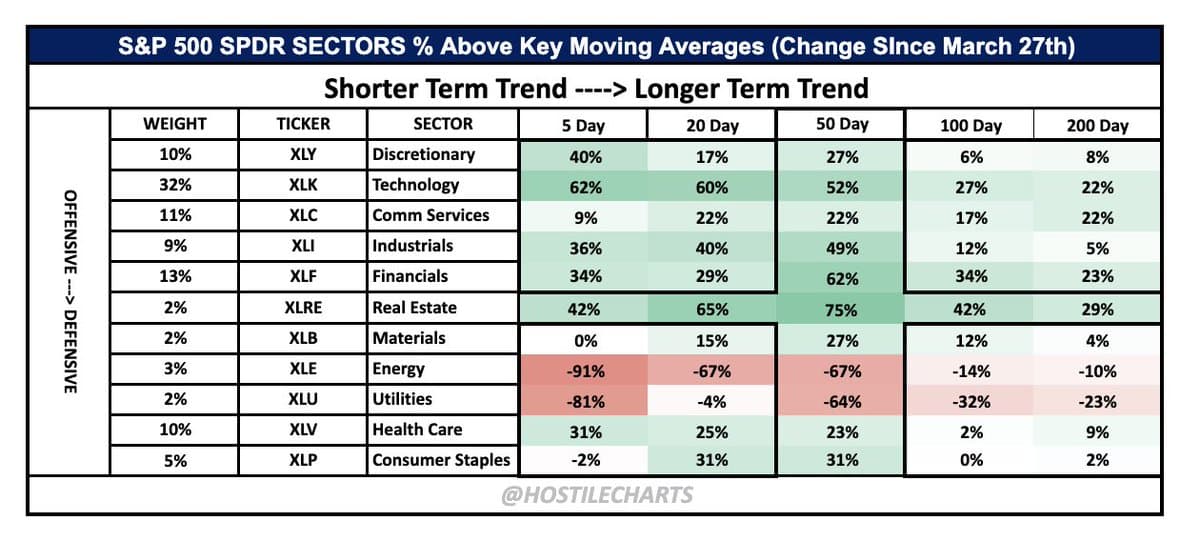
Strong Leadership Doesn't Mean Excluding Participation
Breadth (Improvement) Change Since March 27th Don't confuse strong leadership with a lack of participation. https://t.co/bBzFbL0pCw
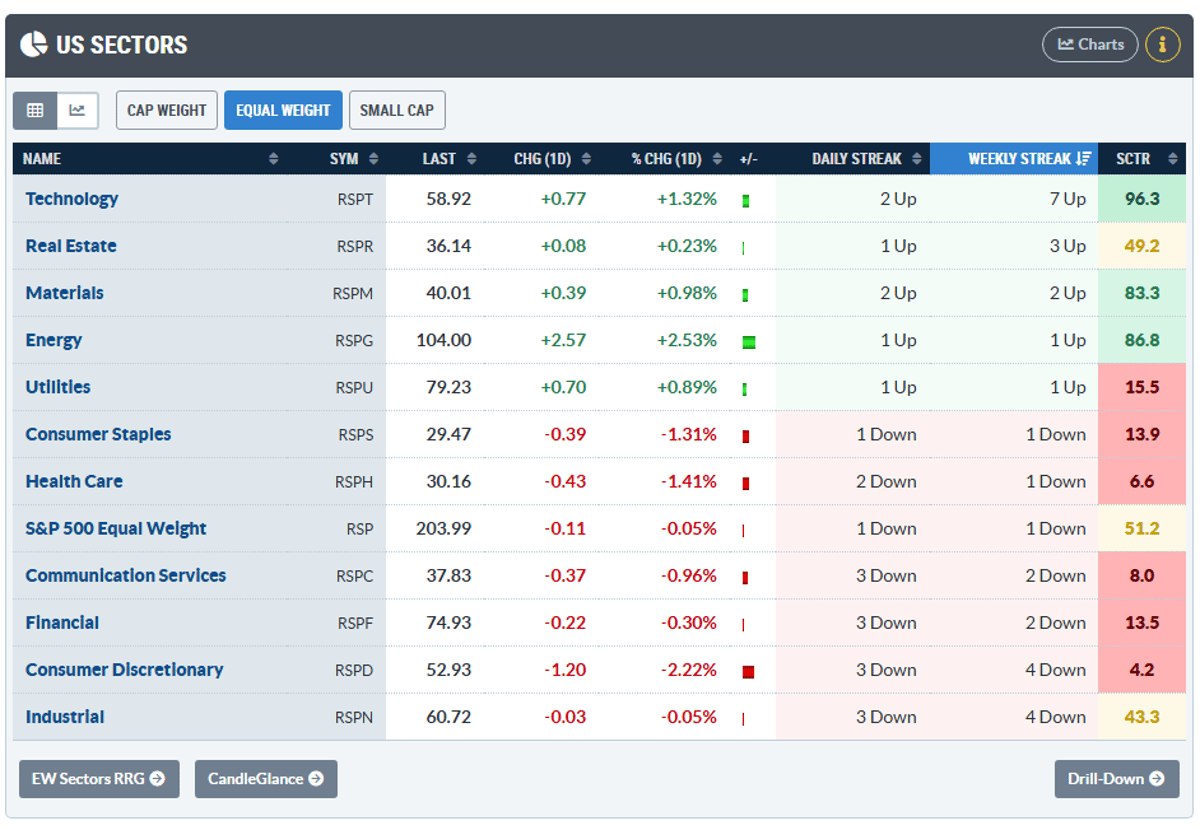
S&P Eyes 7th Winning Week as Sectors Lag
S&P 500 gunning for its 7th straight positive week... as EW Industrials & EW Discretionary pace for 5 straight negative weeks @stockcharts https://t.co/CC1DABfpaS https://t.co/A2AzvRdNFc

Br
#BrentOil Comp Doji Candle and been in z Sideways Range 6 weeks ish. Resistance $115.1. Support $100, $96.1, $86.1. RSI 56 near Neutral. 13/21 day EMAs Bullish. Top Bollinger Band $116. Midpoint Line $107.1. Bottom Band $98.
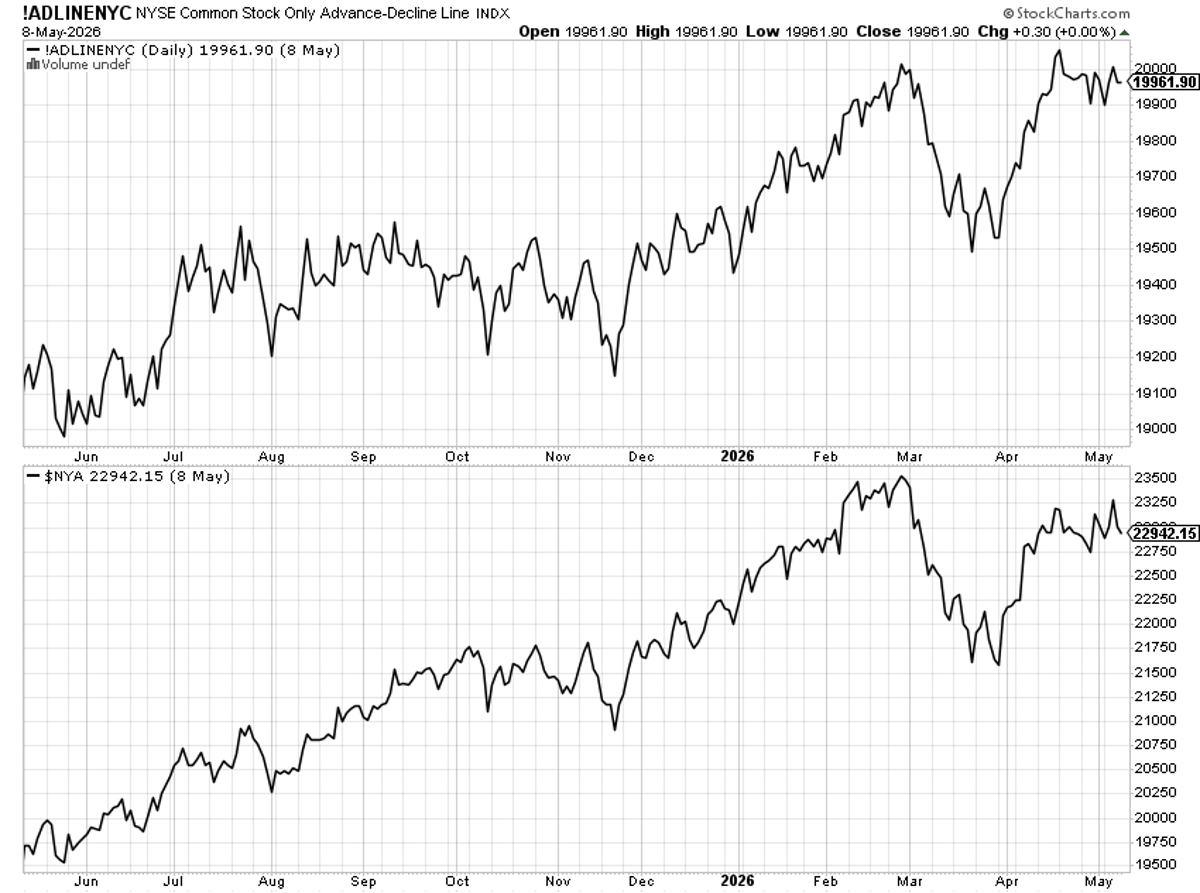
Bears Risk Collapse if AD Line Confirms Breakout
Not sure bears can handle a breadth breakout right about now. They might completely lose it if the Advance-Decline line confirms. $SPY $SPX $QQQ $NYA https://t.co/FLuPhmVW4u
SPX Hits Record Amid Rising Volatility and Chip Surge
Interesting today.. jumpy yields, oil up a bit, silver soared, retail rekt... memory/storage/chips kept surging VIX near 19, SPX record high, more new lows than highs
Semiconductor Rally Dominates S&P, Heightening Whipsaw Risk
It's a bull market. The main risk you have is whipsaw risk. If you own semiconductors, you're wondering if you sell because you'r up 80% in three months. It's max anxiety, max frustration, max FOMO, max fear. The market has...
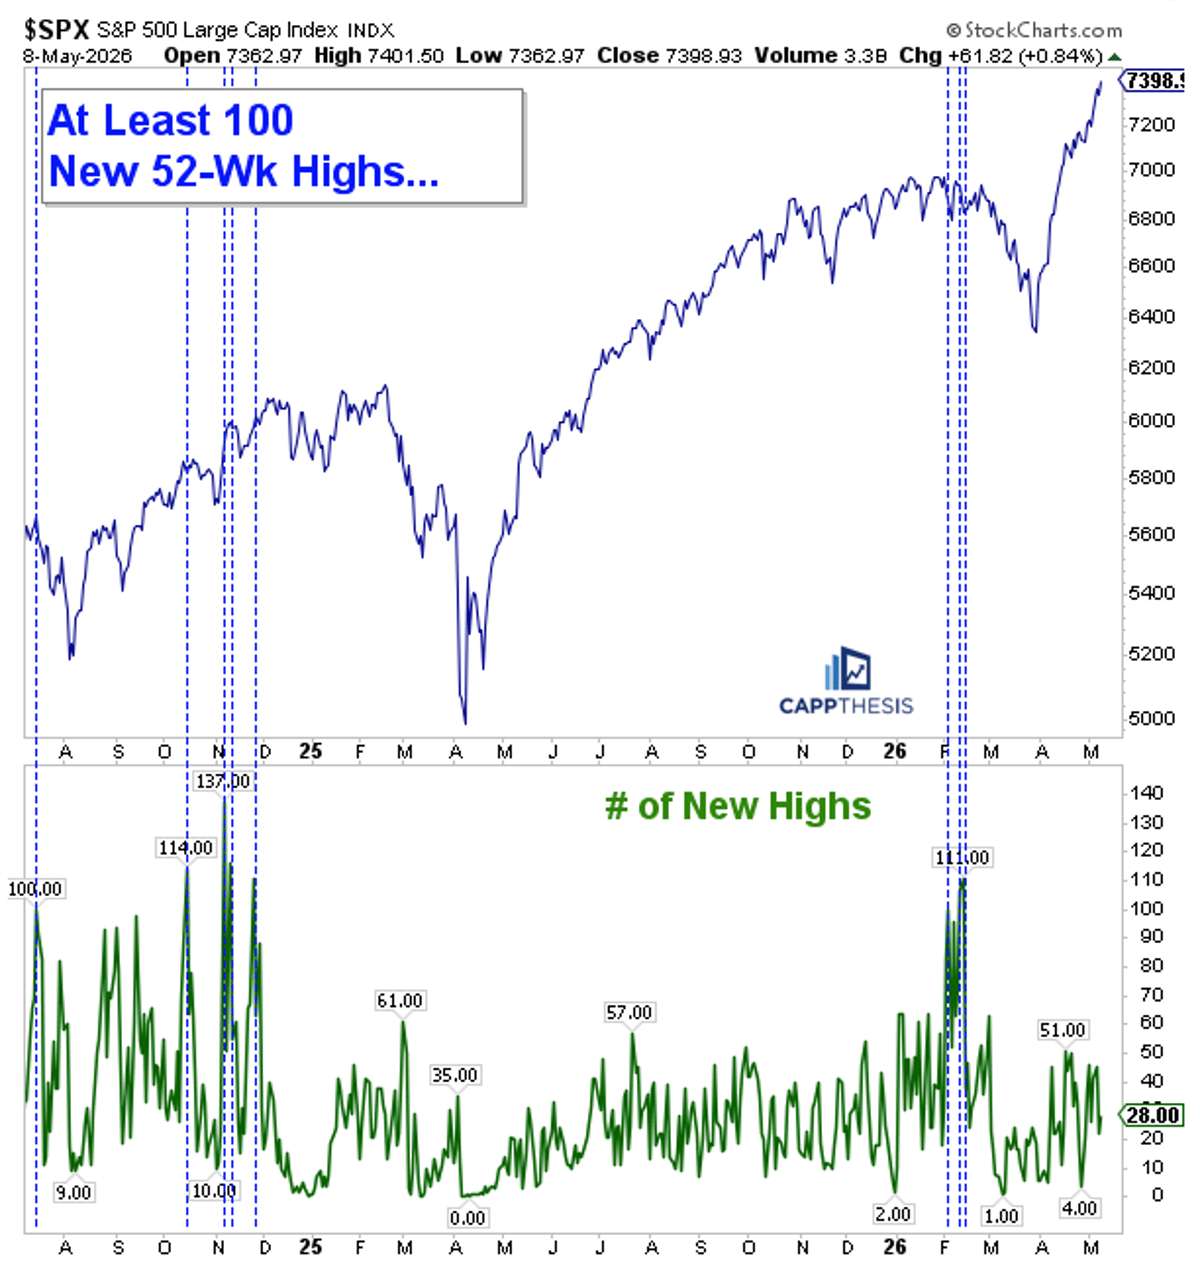
Few SPX Highs Signal Lag, Not
The number of $SPX stocks making new 52-week highs remains low. The last time we had more than 60 in a single day was 3/2/26. So, is it a problem that fewer stocks are making new highs while the index pushes...
Semis' First 5% Correction Roars Like Jet Engine
The first 5% correction in Semis is going to sound like a jet engine. Obnoxiously loud.
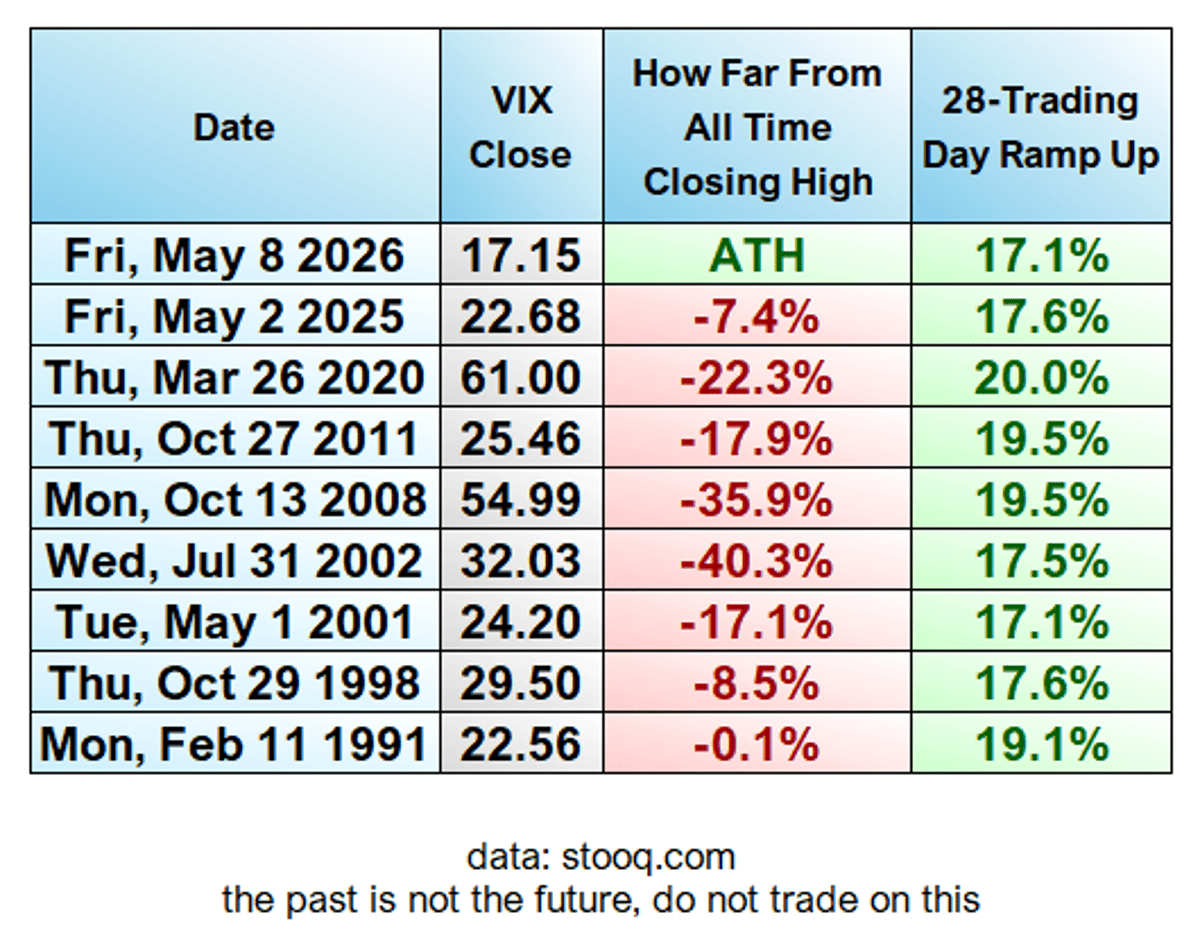
S&P Rallies 17% in 28 Days—Unprecedented Low‑VIX Surge
Wait, what the hell is going on here? The S&P500 (SPX) was up +17.1% in 28 trading days as of Friday's close. Absolutely absurd. But what if I told you it was also the first time a ramp up that...
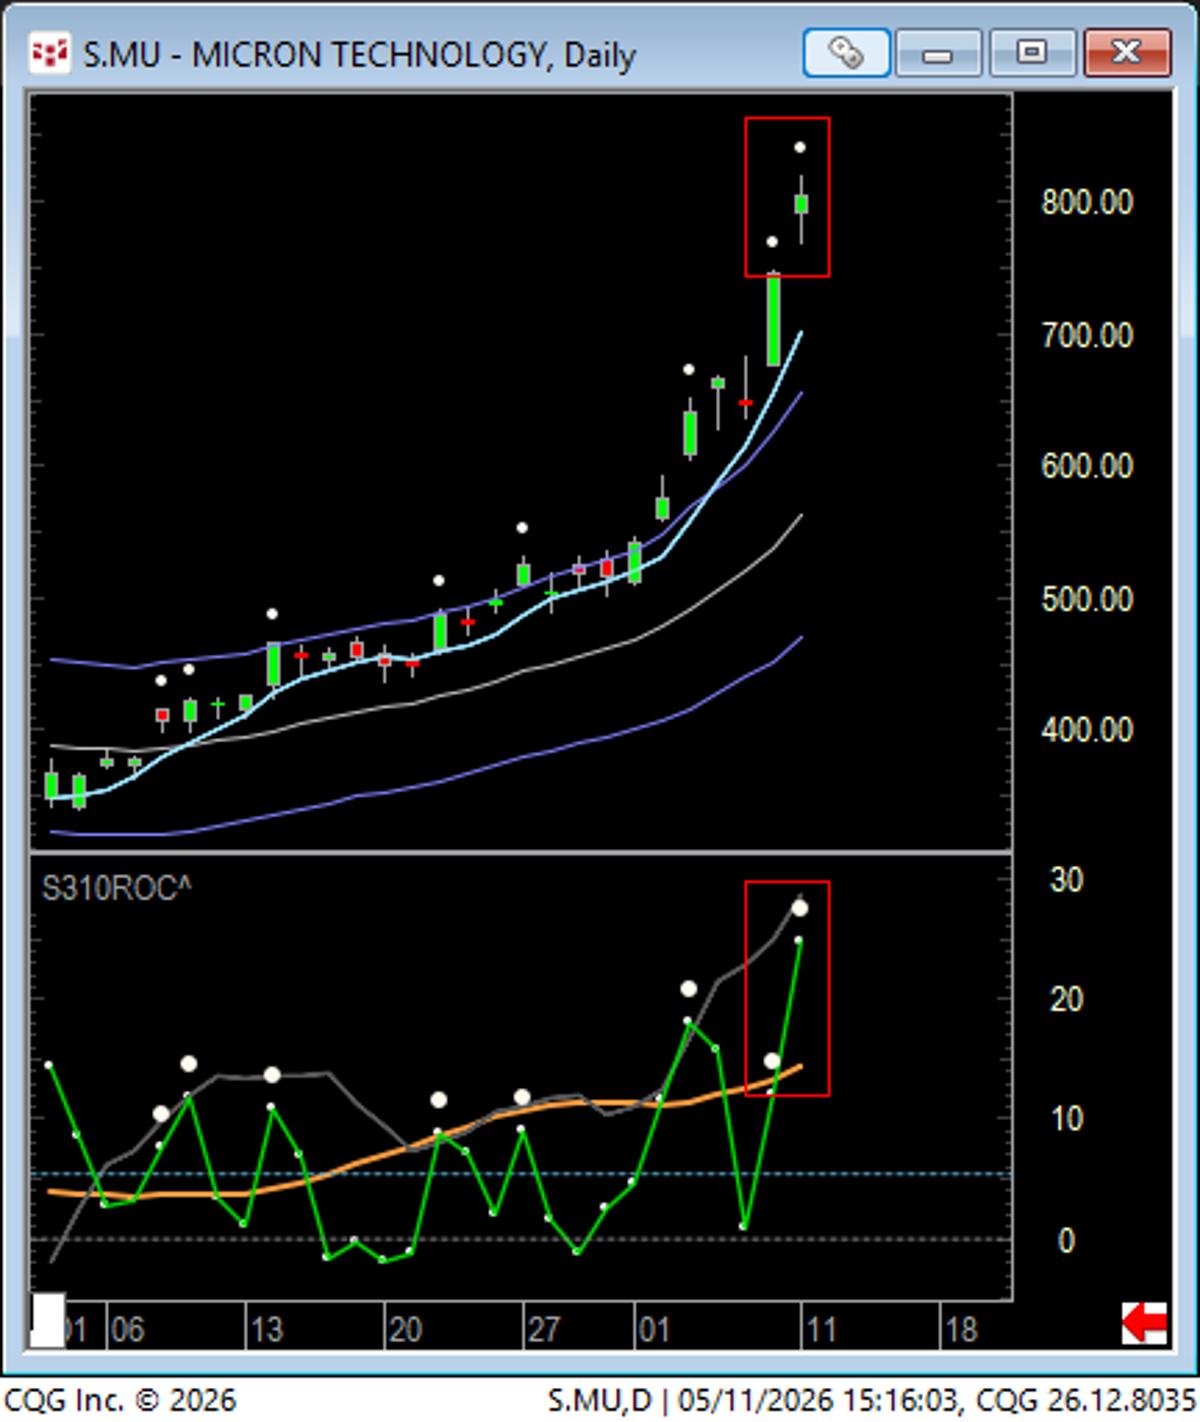
PF3s Rise, Limited Range Signals Run’s End
MU (RS leader) - reading tea leaves: 2 "PF3s" up (dots) with lessor range often is the end of an extended run. 2-per ROC high can be a climax pattern at the end of a swing. https://t.co/uYWkop0M8d
Short‑Side Alerts Remain Spot‑On Amid SPY Surge
Very few mistakes in Real-Time Alerts on the Short Side during this ramp to all-time $SPY highs
Use 2x/3x for Quick Gains, Hold Commons Long‑term
FWIW the 2x's and 3x's trades are meant for shorter holds as they have volatility decay. If want let it rides in time the best is to use the common shares. Why I will often buy both....

Use Trailing Stops and Profit‑taking to Avoid Greed
Don't get giddy or complacent keep inching stops and/or take some profits out of the market. Greed causes complacency. Don't be one. Staying long until wrong here but inching stops and taking some along the way is...
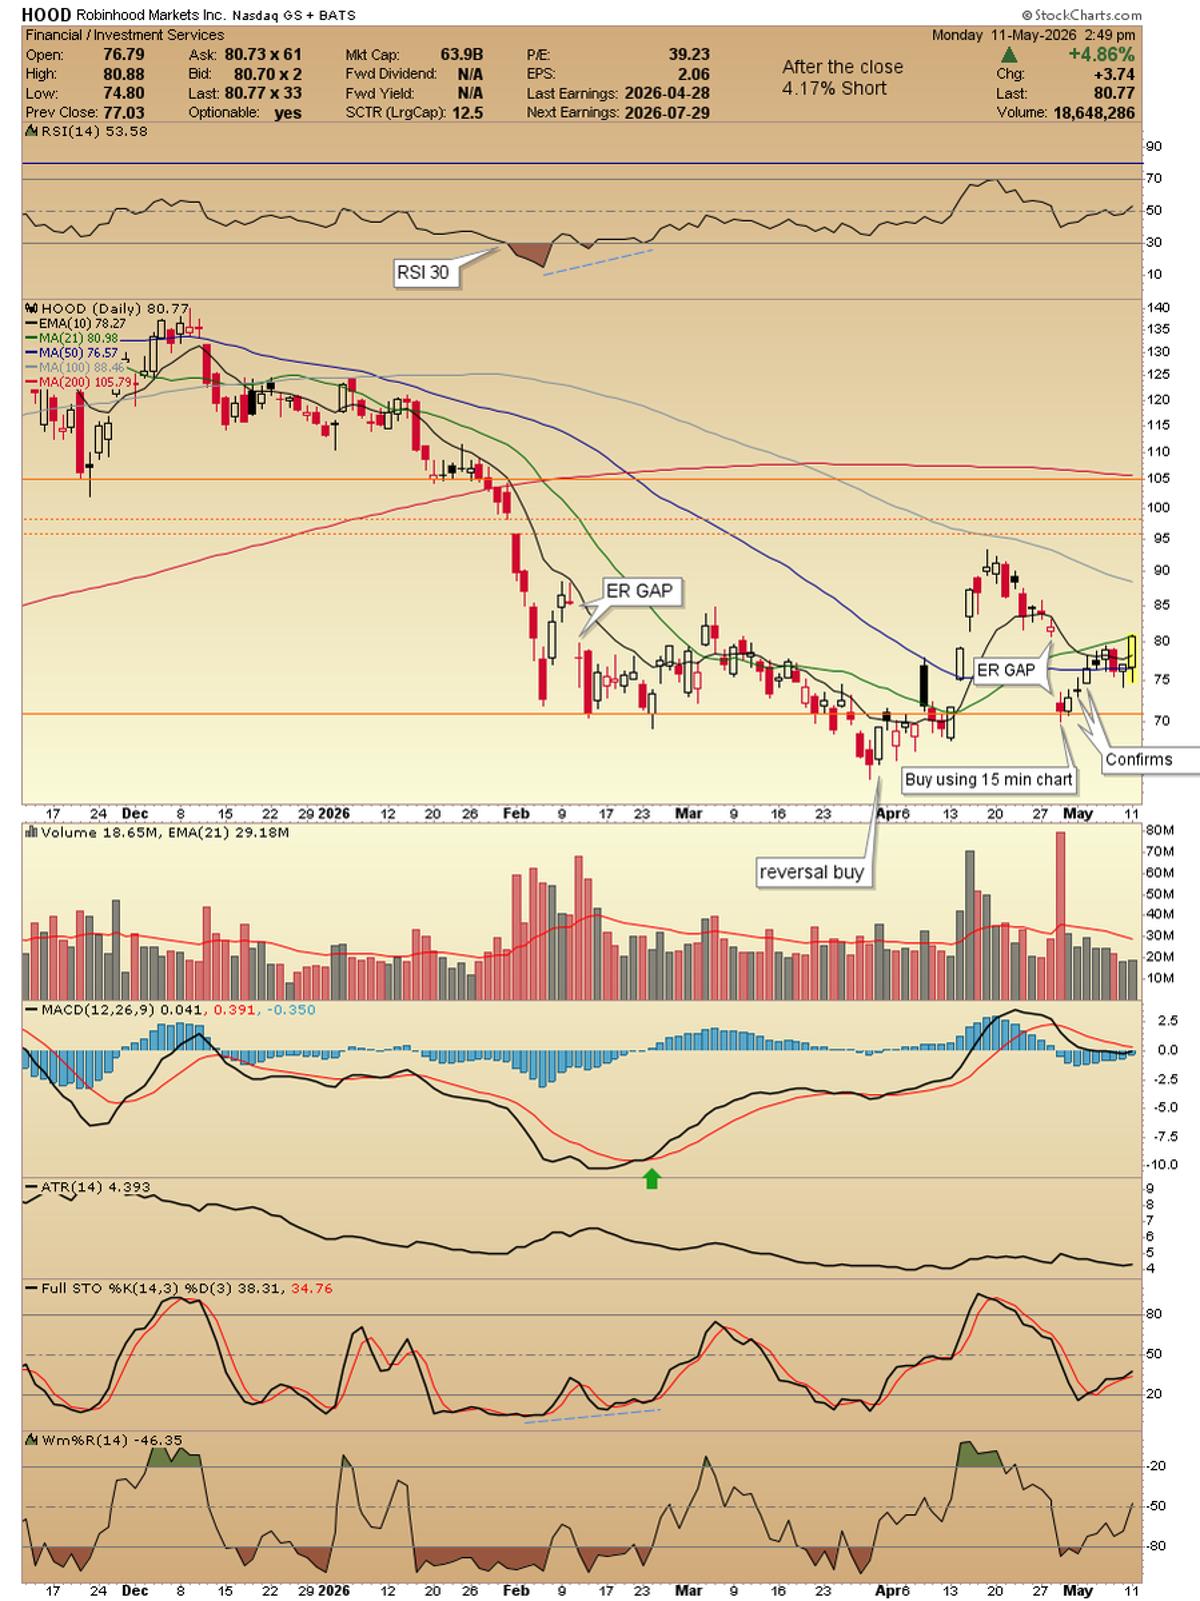
HOOD & ROBN Reclaim 10/50 MAs, Await Close
$HOOD $ROBN daily chart back over 10/50ma's working on the 21ma and best it filled the ER gap down today. A close over is what I am watching to have me move up stops https://t.co/uWgwCL9jPa
Amazon Likely to Retest ATH Before Breaking 272
$AMZN is having trouble achieving a weekly close above the 1st yearly resistance at 272. I think it will eventually do that but it may pull back and test the previous ATH before that. A weekly close above 272 will...
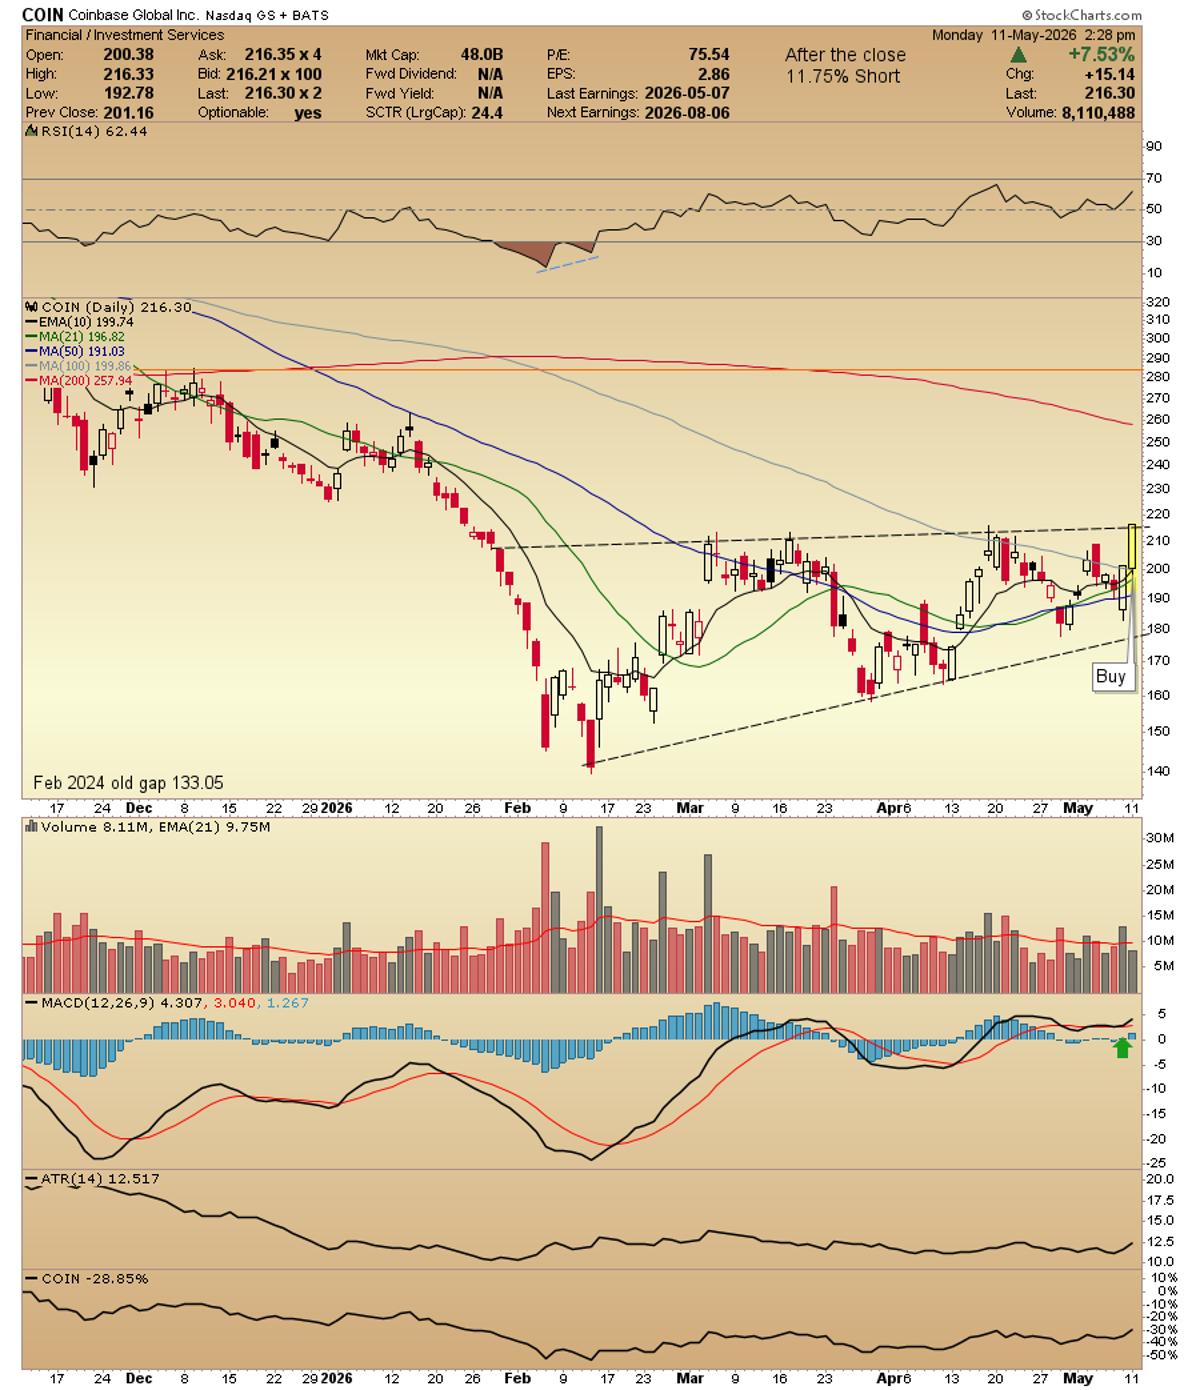
COIN Poised for Breakout, Eyeing Big Paydays
$COIN at the top of its base looking to take my paydays soon (today). I have $CONL too https://t.co/GU0aIFNAAj
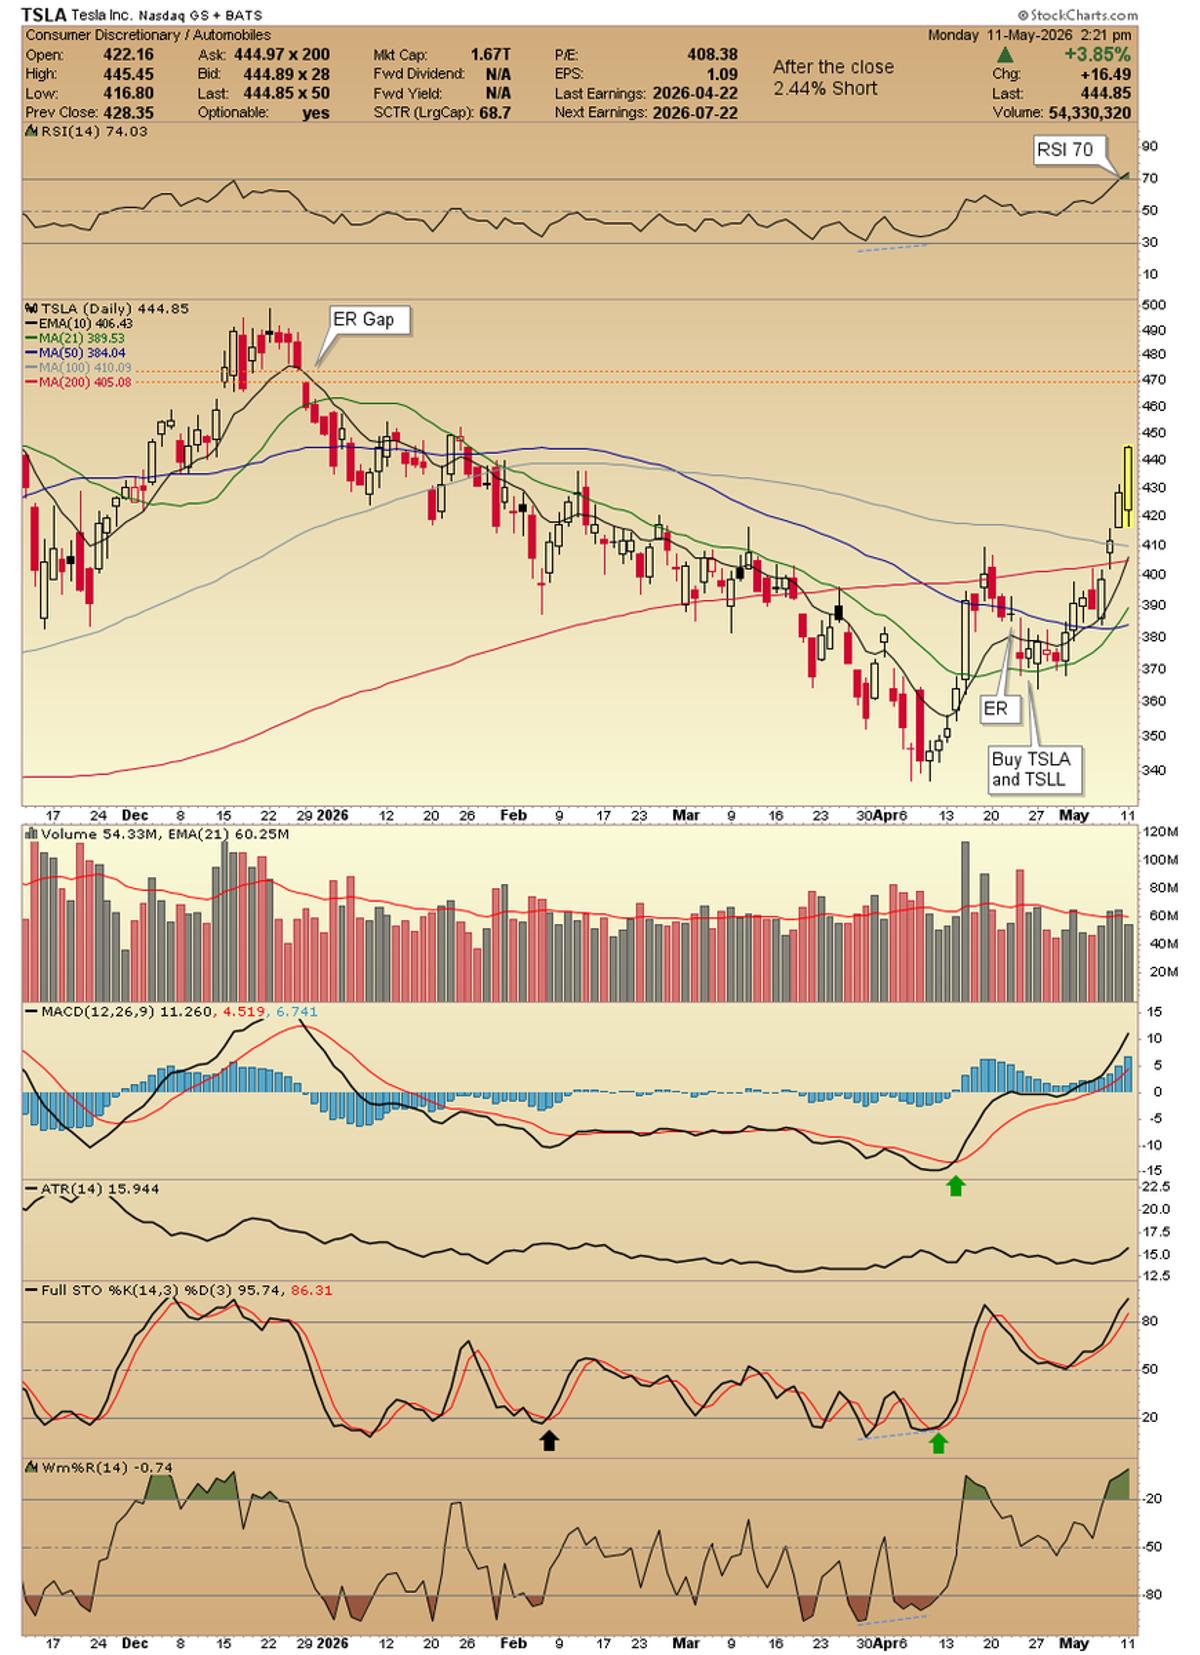
Tesla Chart Updated, Stop Loss Moved, Holding Long
$TSLA updated chart. Moved all stop on let it rides. Own some $TSLL too https://t.co/x4cJxDUHSV
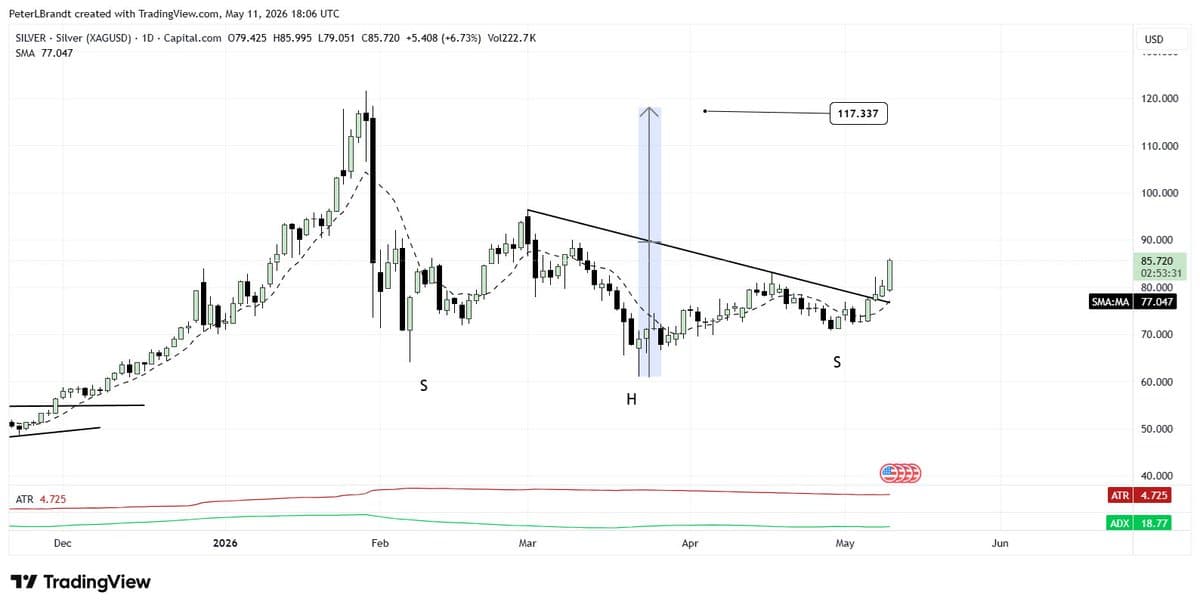
Valid Inverted H&S Signals Retest of $SI_V High
IF this is a legit inverted H&S (in trading, everything is an IF), the target is a retest of the high $SI_V https://t.co/077kZqcANM
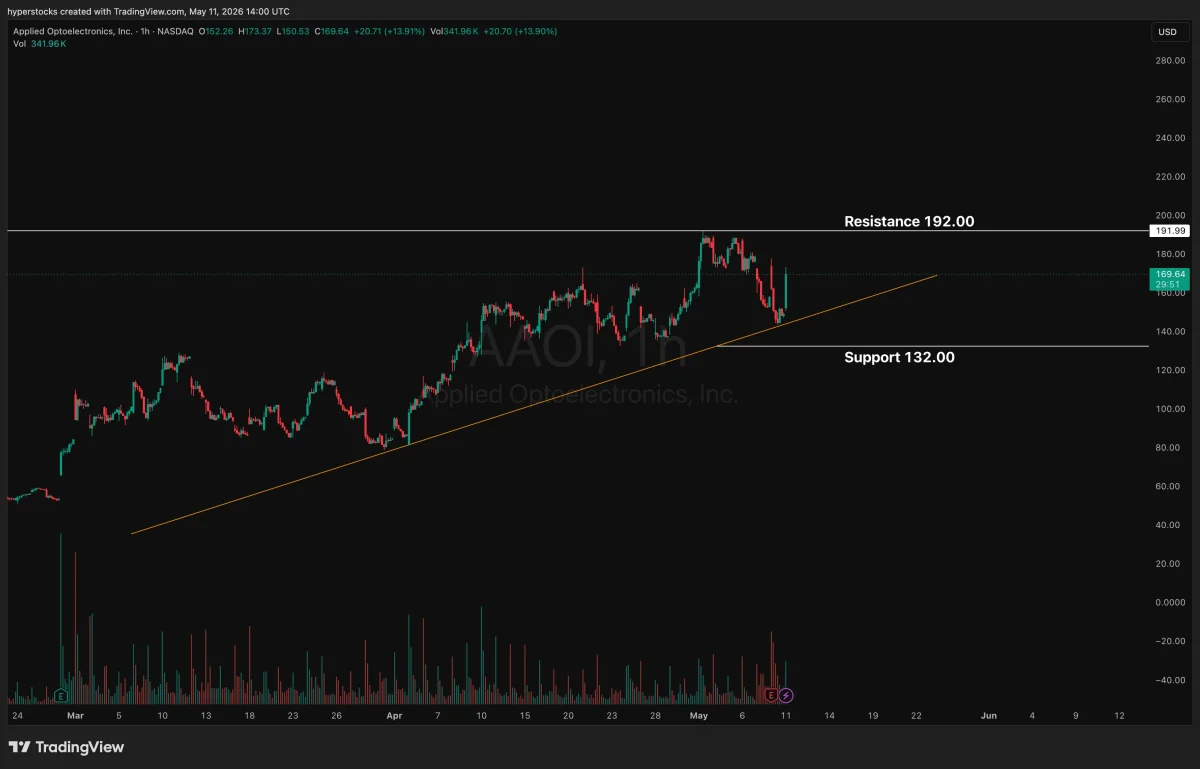
AAOI Holds Trend Line, Eyes 192 Breakout
$AAOI defending its trend line, but still early in the week. 192.00 is the magic breakout point for the move to 200+
Seeking Clues: Will Money Rotate or Pause?
Is money going to rotate or do we take a breather across the board? Looking for clues here.

Trade Only When Stocks Have Clear Catalysts
Trade a stock on a day that it has a reason to move. We want expansion from our entry Day 1 Technical - Breakout through a key level Technical - Undercut and rally of a key level External - Earnings report External - News...
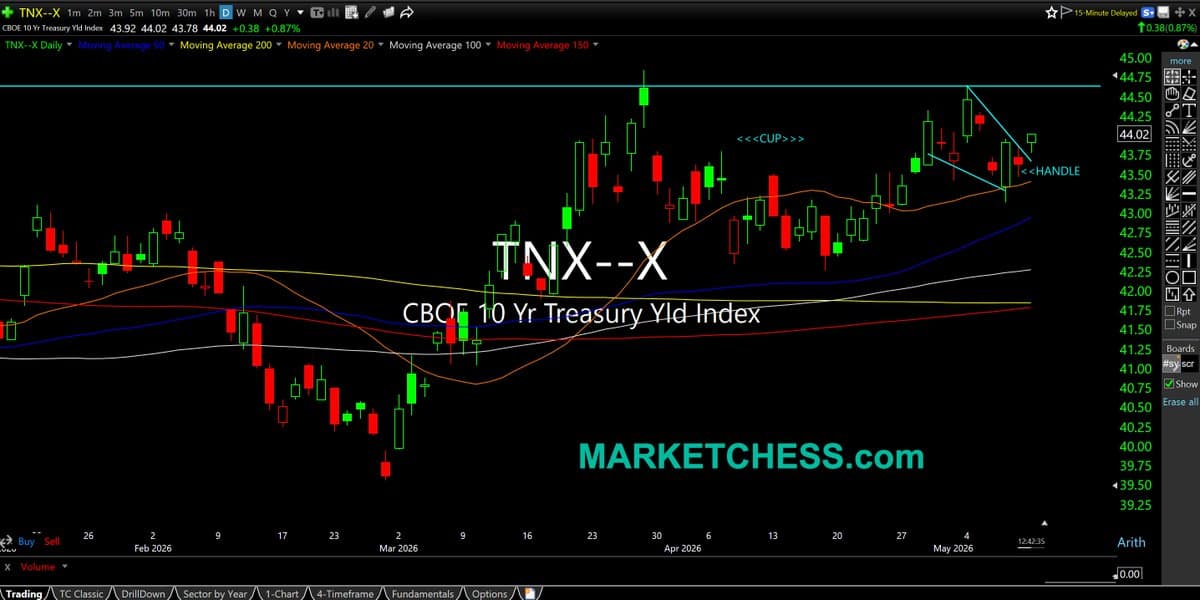
10-Year Note Forms Bullish Cup‑Handle, Breakout Loom
$TNX Daily. Index for Rates on 10-Year Note. Chart patterns can & often do morph. Here, consolidation morphs to bullish cup & handle. Back over at least 4.7% threatens breakout https://t.co/gQXIqXWRgI

Sell Into Strength: Reduce Exposure When Market Allows
Took advantage of the strength this morning to reduce some exposure. I prefer to sell into strength when the market gives me the opportunity. As always, do what works for you and your timeframe.
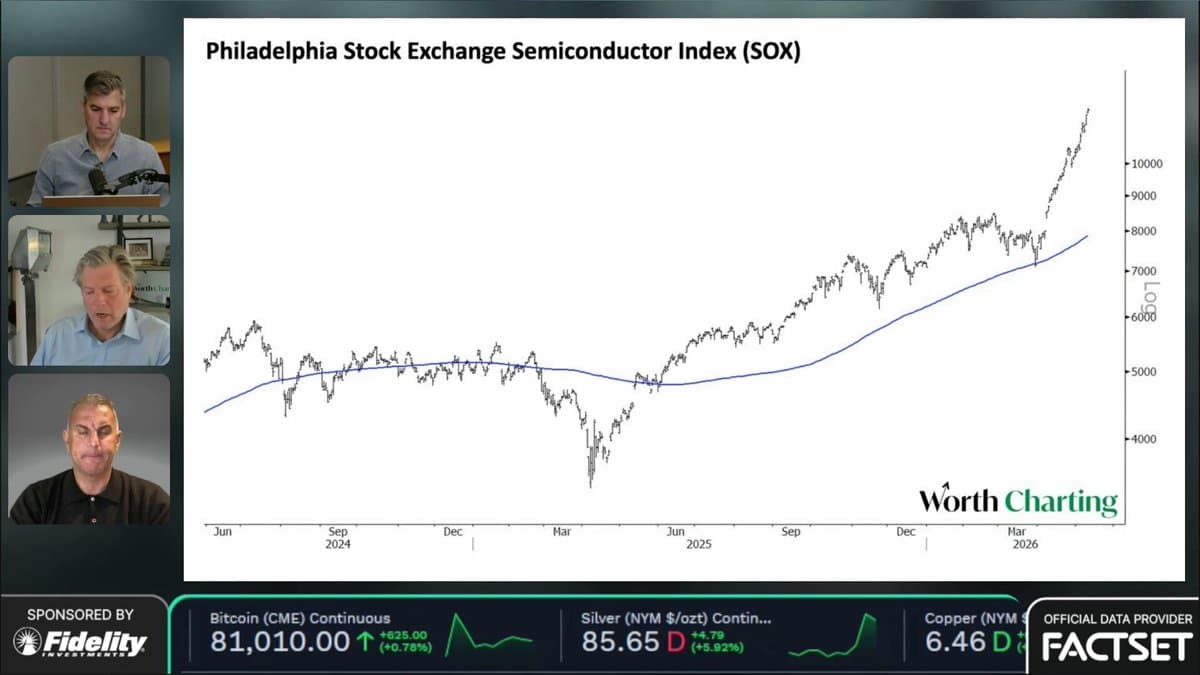
Semis Surge 53% Above 150‑day Average, Rare Since 2000
Semis are 53% above their 150-day moving average The only other times we've been this steep? 1999 & 2000 @CarterBWorth breaks it down on MRKT Call with Dan Nathan & @GuyAdami 📈 $SOX $SOXX $XLK https://t.co/xrB46fDqge
Consumer Stocks Slipping, Panelist’s Optimism Unfounded
A panelist (who seems to have never made an unprofitable trade (save disasters $MRNA $UNH, etc.) on @HalftimeReport says the consumer is doing great. See today's price action in COST -$20, $WMT -$4, PG -$4, PEP -$5. And, by the way,...
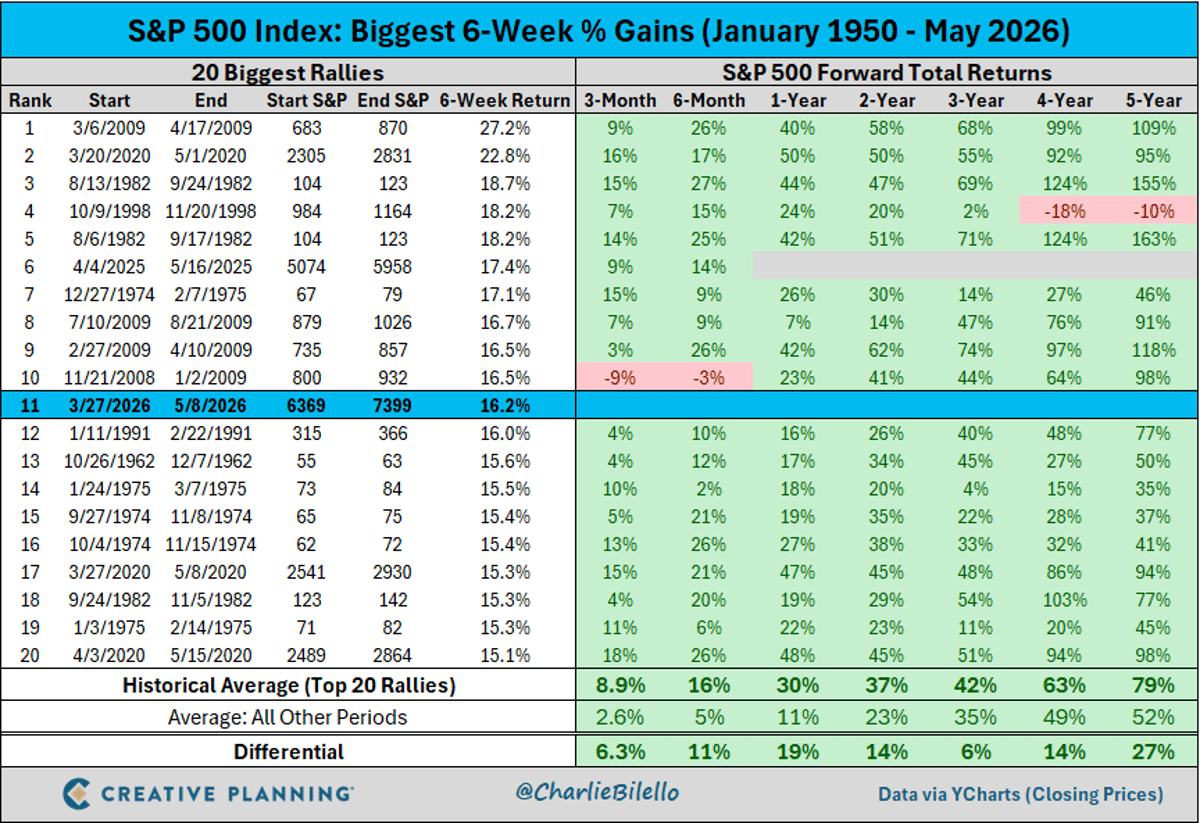
Historic S&P Rally Unlinked to Bear Market Cycle
The 16% gain in the S&P 500 over the last 6 weeks is the 11th biggest 6-week gain for the index since 1950. What's unique about this rally? It's the only example in the top 20 that did not occur either during...
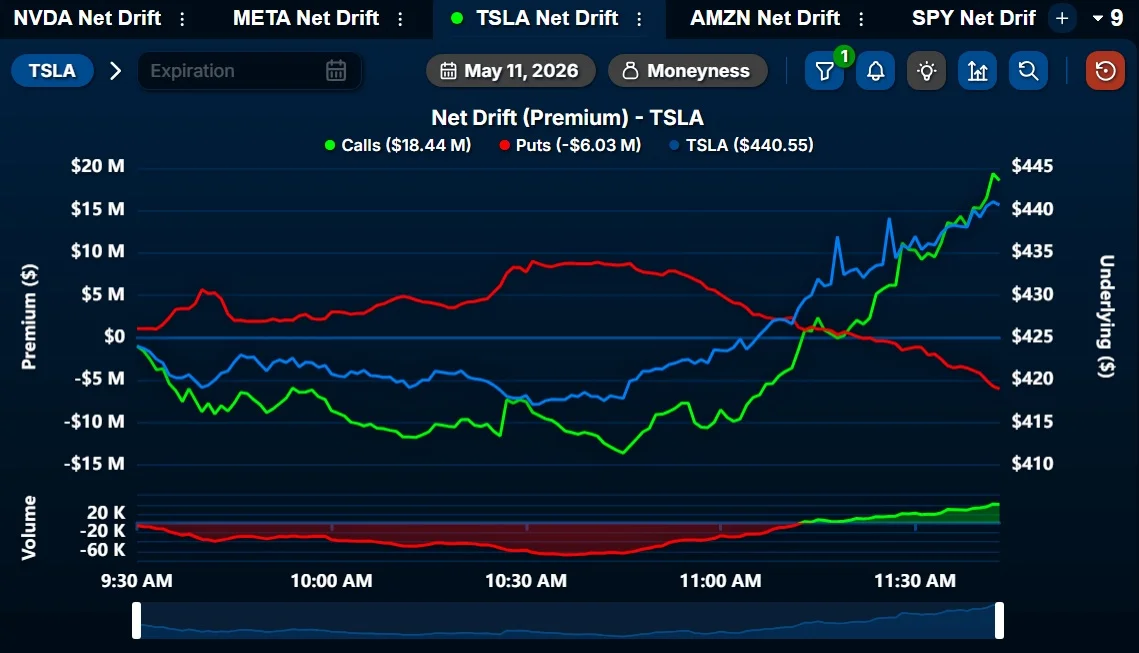
Tesla Surges 3% as $20M Net Calls Flood In
Quite the rally on $TSLA, $20M in Net Calls over the past 30 minutes. Underlying is up ~3%.
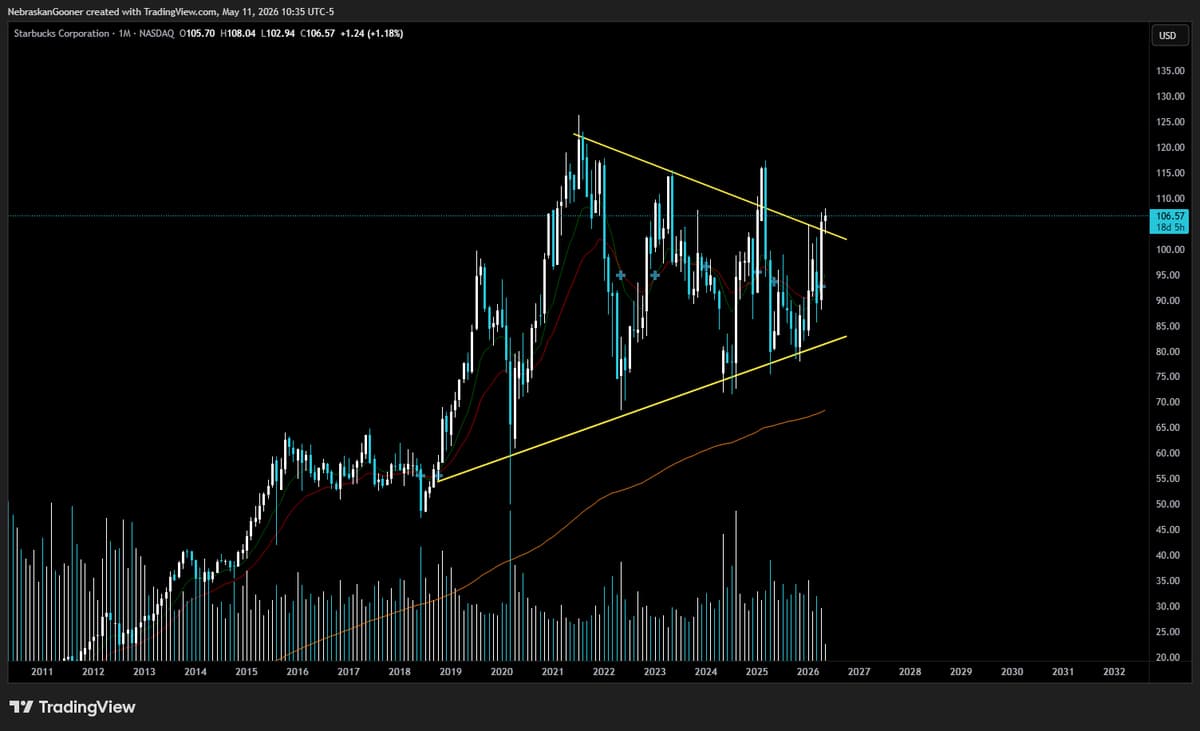
Starbucks Breaks 8‑Year Consolidation, Eyes $160 Target
$SBUX Looks like a breakout of an 8 year consolidation. People love their coffee. Could see this heading for new ATH as long as it holds above this trendline unlike last attempt. Measured target puts upside potential around $160 https://t.co/gVYbgMUeTo
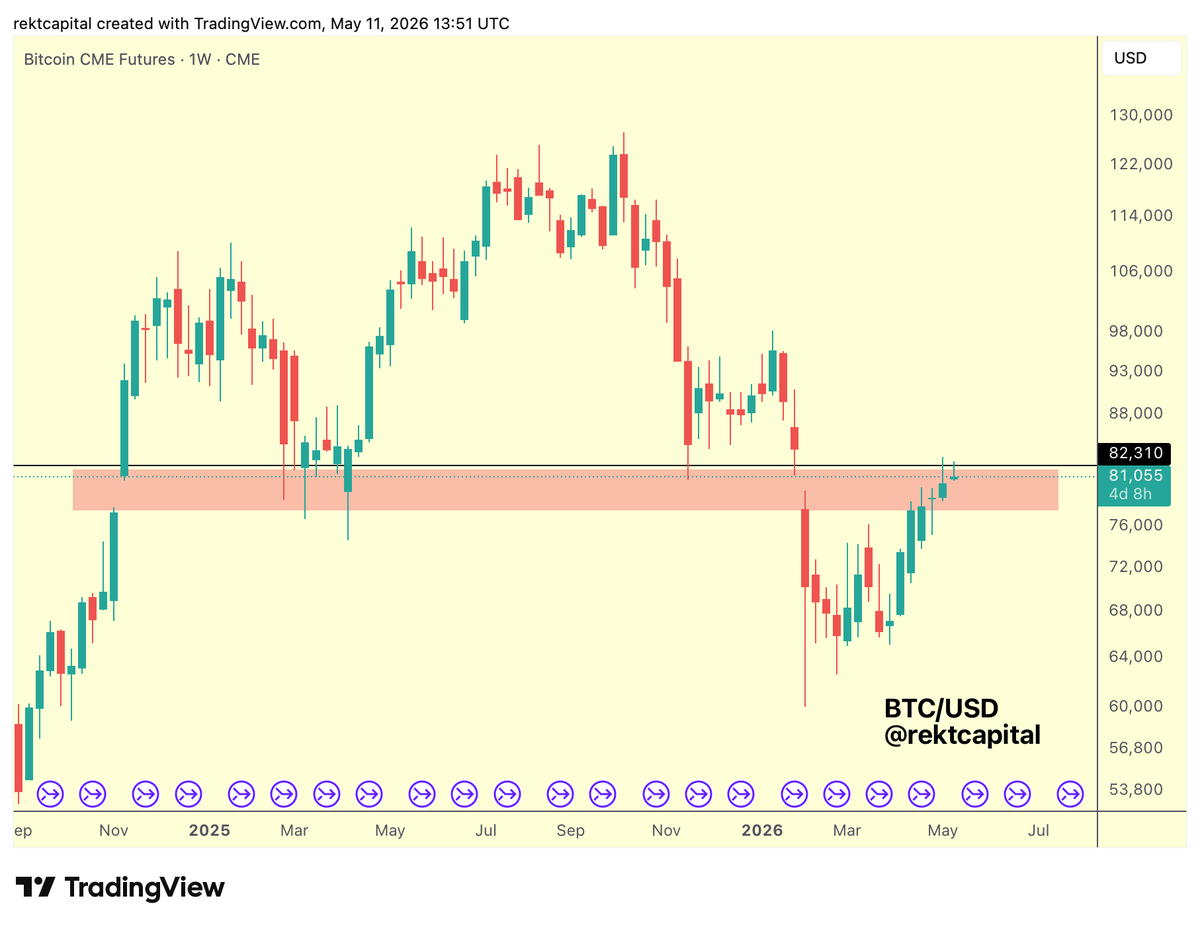
BTC Stuck Below CME Gap Top, Consolidation Expected
#BTC Bitcoin has Weekly Close beneath the top of the Weekly CME Gap Thus, this level will continue to figure as resistance for now This also means price could be sentenced to additional consolidation between the bottom & top levels of the...
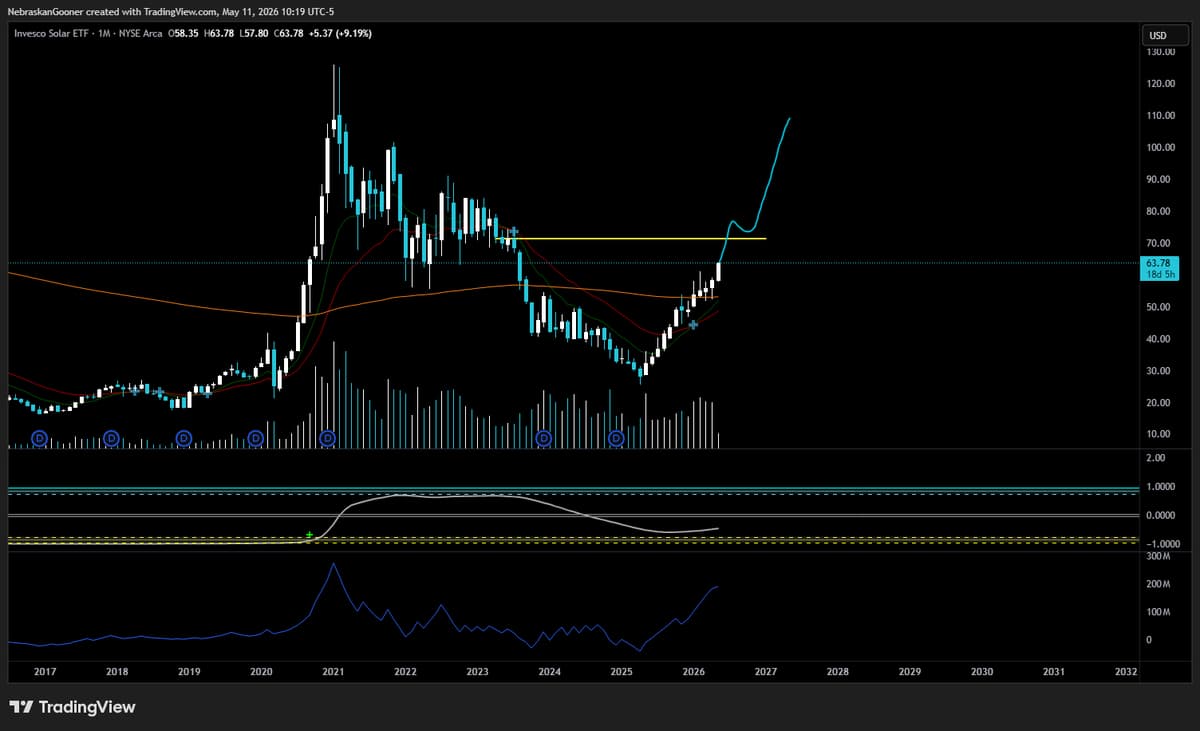
TAN's V-Shaped Recovery Points to Strong Upside
$TAN Crazy V recovery. Lots of green months in a row. If it can reclaim this horizontal then it should fly high https://t.co/LaYRCB0KK1

Cheap SPCE $3 Calls Signal Potential Frothiness
Virgin Galactic (SPCE) 8000 June $3 calls bought $0.38 to $0.42 May be a bit frothy when they start buying calls in SPCE
Short‑term Bullish, Risk‑on Signals Ignored by Clueless Critics
Heads up - actually been bullish, over a short time period, and the signals are all risk-on and purely quantitative. Bunch of clowns not understanding time frame or even reading the research.
WYFI Jumps 30%, Nears Double Since Recent Upgrade
$WYFI up another 30% today, nearly a double from write up less than month ago, had to cash shares out https://t.co/c7TjdPOHHC