Indicator of the Day (Video): Nasdaq – Breadth Thrust
Key Takeaways
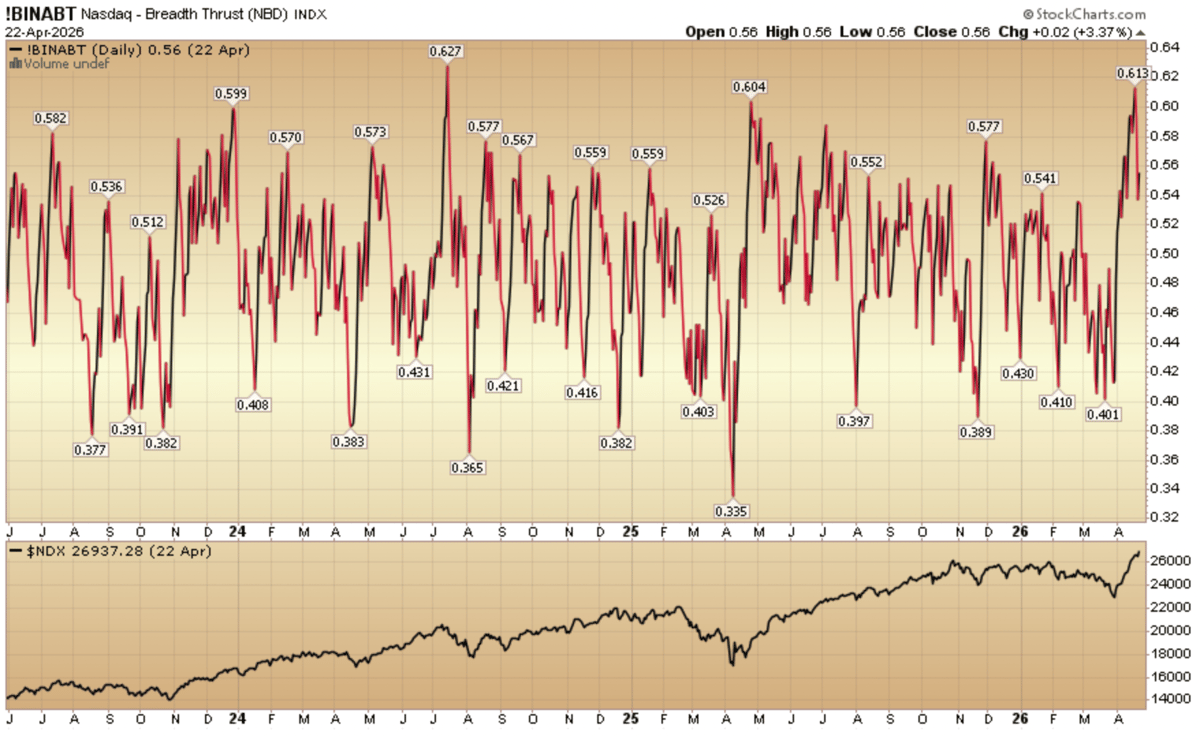
- •Breadth Thrust measures net advancing versus declining Nasdaq stocks
- •Indicator spikes when broad market participation outpaces price gains
- •Recent thrust suggests potential bullish momentum for the Nasdaq Composite
- •Traders watch NBD to anticipate trend reversals and sector strength
Pulse Analysis
The Nasdaq Breadth Thrust is a technical gauge that compares the number of advancing stocks to declining ones within the Nasdaq universe. Developed in the 1970s, the metric rises sharply when a broad base of securities moves higher, indicating that price gains are not confined to a handful of mega‑caps. Analysts value the indicator because it filters out price‑only noise, offering a clearer view of underlying market participation and the depth of a rally.
In the latest chart spanning August 2023 to April 2026, the NBD line diverges upward from the Nasdaq Composite, forming a classic "thrust" pattern. This divergence often precedes a multi‑month uptrend, as historically observed during the 1999‑2000 tech boom and the 2017‑2018 rally. The current thrust coincides with elevated earnings forecasts in the semiconductor and cloud‑computing sectors, reinforcing the notion that sector‑wide strength is driving the broader index higher.
For portfolio managers and active traders, the Breadth Thrust offers a timing tool for both entry and risk management. A sustained thrust can justify increasing exposure to growth‑oriented Nasdaq ETFs, while a flattening or reversal may warn of weakening momentum. Combining NBD signals with volume analysis and macroeconomic data can sharpen trade decisions, helping investors capture upside while mitigating the downside risk inherent in tech‑heavy market cycles.
Indicator of the Day (video): Nasdaq – Breadth Thrust
Comments
Want to join the conversation?