Indicator of the Day (Video): S&P 500 Percent Above 50-Day SMA
Key Takeaways
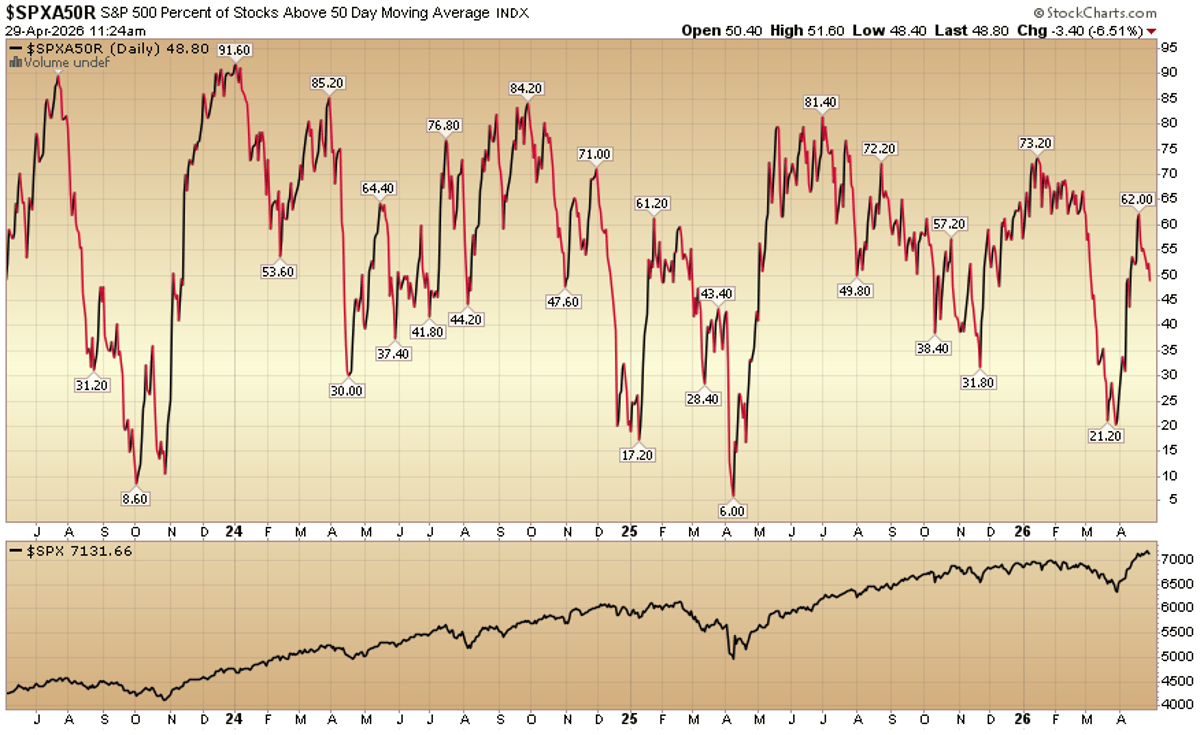
- •Indicator tracks % of S&P 500 stocks above 50‑day SMA.
- •Values above 70% historically signal strong market breadth.
- •Recent dip below 60% may warn of near‑term pullback.
- •Contrarian traders watch spikes as potential reversal cues.
- •Indicator’s trend mirrors broader macro cycles and earnings momentum.
Pulse Analysis
The S&P 500 Percent Above 50‑Day SMA is a breadth indicator that measures how many constituents are trading above a short‑term trend line. By comparing each stock’s price to its 50‑day simple moving average, the metric filters out noise and isolates genuine momentum. When a large share of the index’s components sit above this threshold, it suggests that bullish sentiment is widespread, whereas a drop indicates that fewer stocks are sustaining upward trends.
Historically, the indicator has exhibited clear thresholds: readings above 70% have coincided with sustained bull markets, while falls below 60% often foreshadow corrections. The recent chart, spanning Jan 2024‑Apr 2026, shows the metric climbing to a peak of roughly 73% in late 2025 before retreating to the low‑60s. This pattern aligns with the S&P 500’s own rally‑then‑pullback cycle, reflecting how earnings growth, monetary policy shifts, and geopolitical risk filtered through individual stock performance. Analysts interpret the current dip as a warning sign that the market’s underlying breadth is weakening, even if the headline index remains elevated.
For investors, the indicator serves as a tactical tool for timing exposure. Portfolio managers may reduce equity weightings or increase defensive positions when the metric breaches the 60% mark, while contrarians might seek buying opportunities on short‑term spikes that suggest temporary over‑optimism. Integrating this breadth signal with other technical and fundamental analyses can improve risk‑adjusted returns, especially in volatile environments where headline indices can be misleading. Monitoring the S&P 500 Percent Above 50‑Day SMA thus offers a nuanced view of market health beyond price alone.
Indicator of the Day (video): S&P 500 Percent Above 50-Day SMA
Comments
Want to join the conversation?