
Investing Visuals
Creator who visualizes quarterly results (e.g., Shopify Q4), posts EPS/revenue vs estimates and outlook, and shares prior earnings breakdowns (e.g., NET).
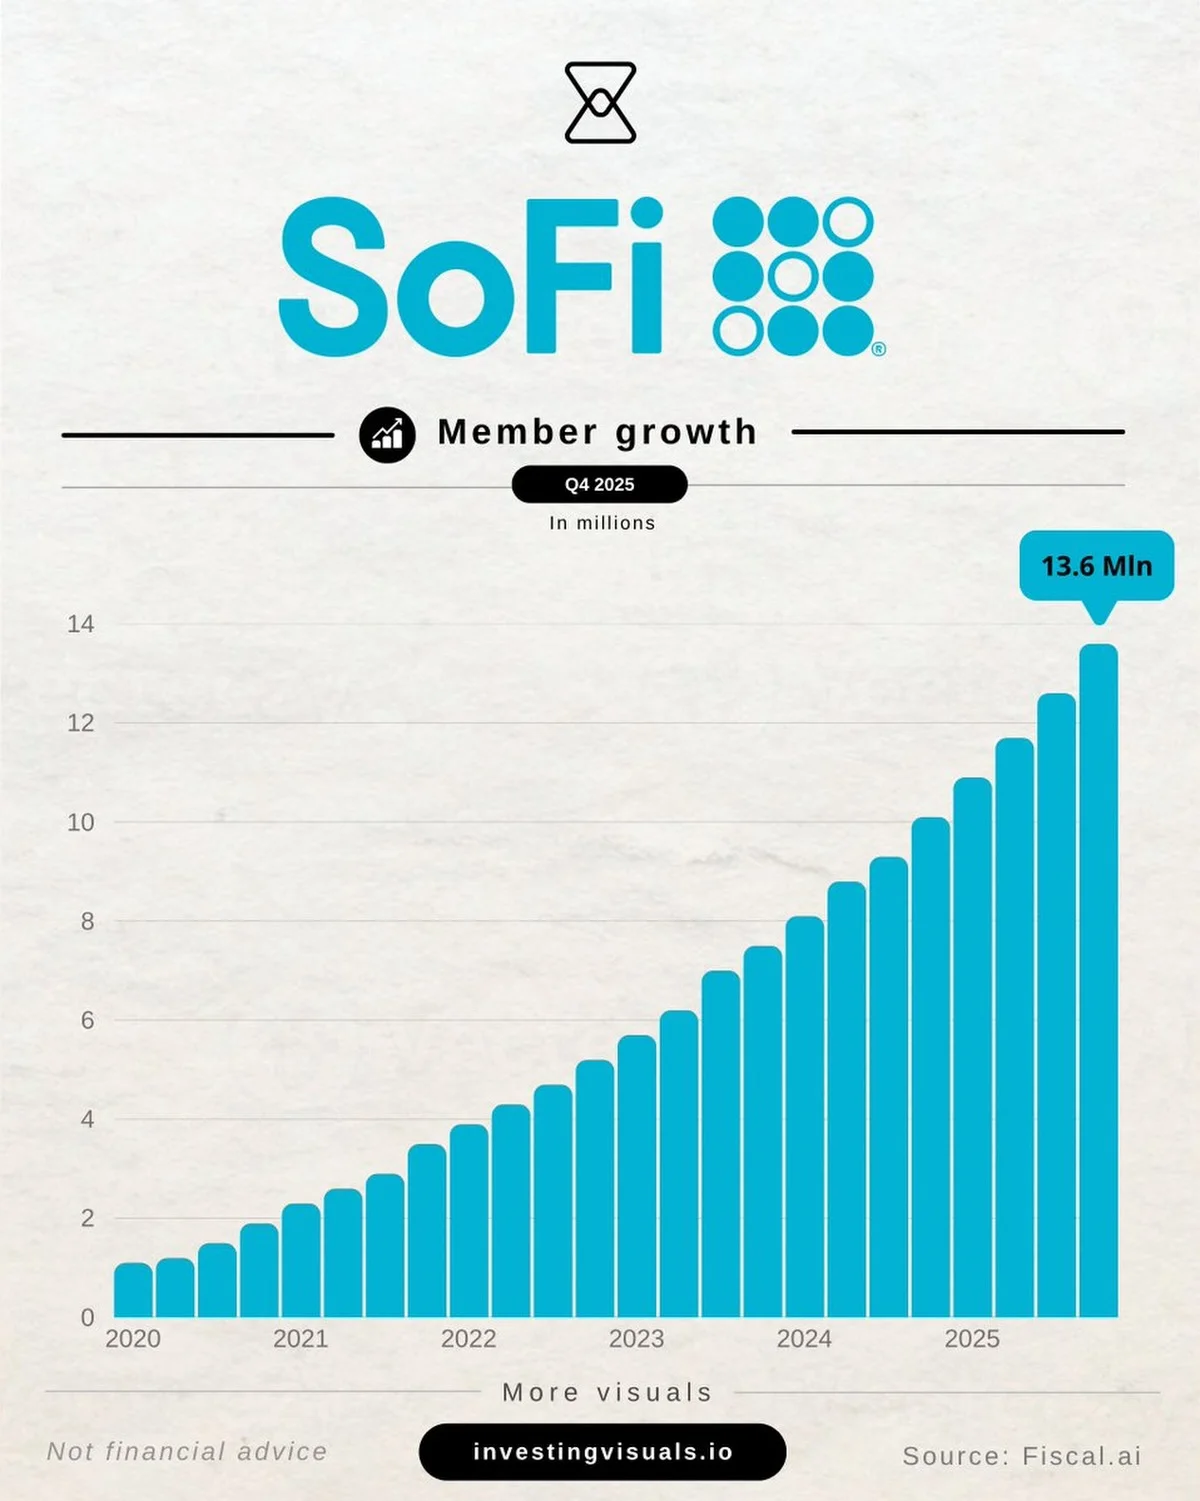
SOFI Shares Plunge 53% While Membership Soars
SOFI is down 🔻53% since November. Meanwhile, membership growth has shown no sign of slowing down.
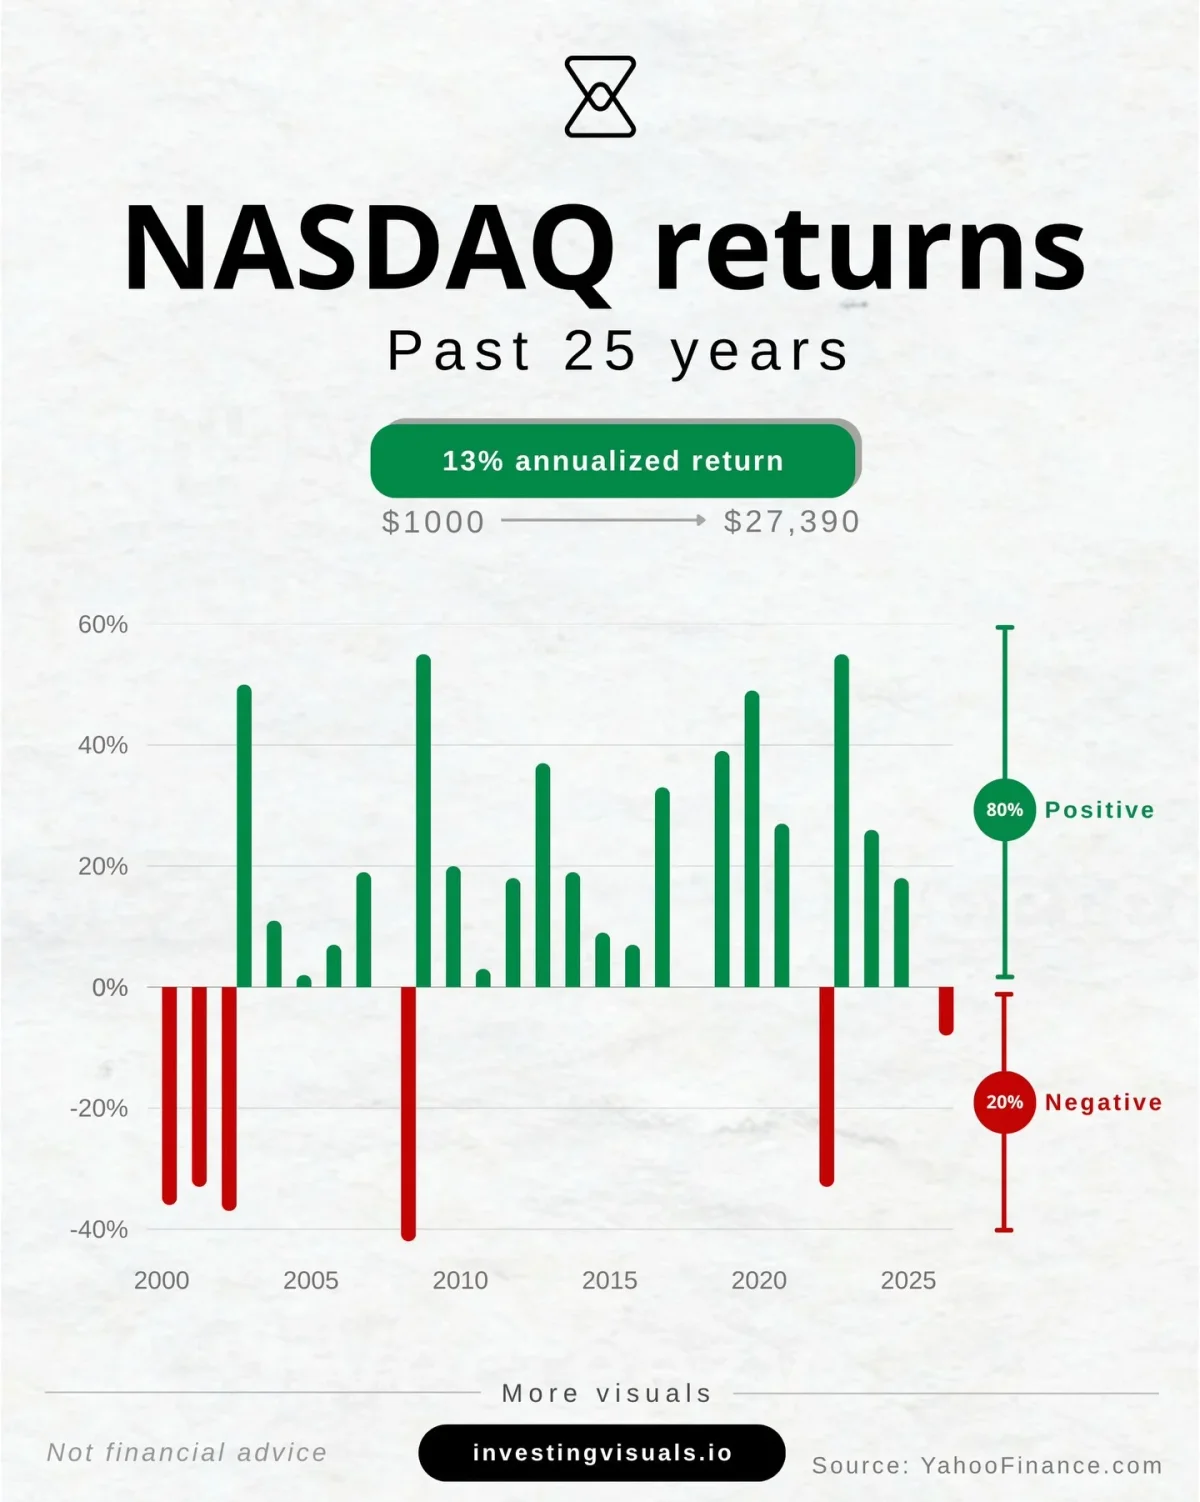
QQQ Turns $1K Into $27K Over Two Decades
QQQ returns since 2000, ranked from worst to best years: 🔴 2008: -42% 🔴 2002: -37% 🔴 2000: -36% 🔴 2001: -33% 🔴 2022: -33% 🔴 2026: -8% (YTD) 🟢 2018: 0% 🟢 2005: 2% 🟢 2011: 3% 🟢 2006: 7% 🟢 2016: 7% 🟢 2015: 9% 🟢 2004: 11% 🟢 2012: 18% 🟢...
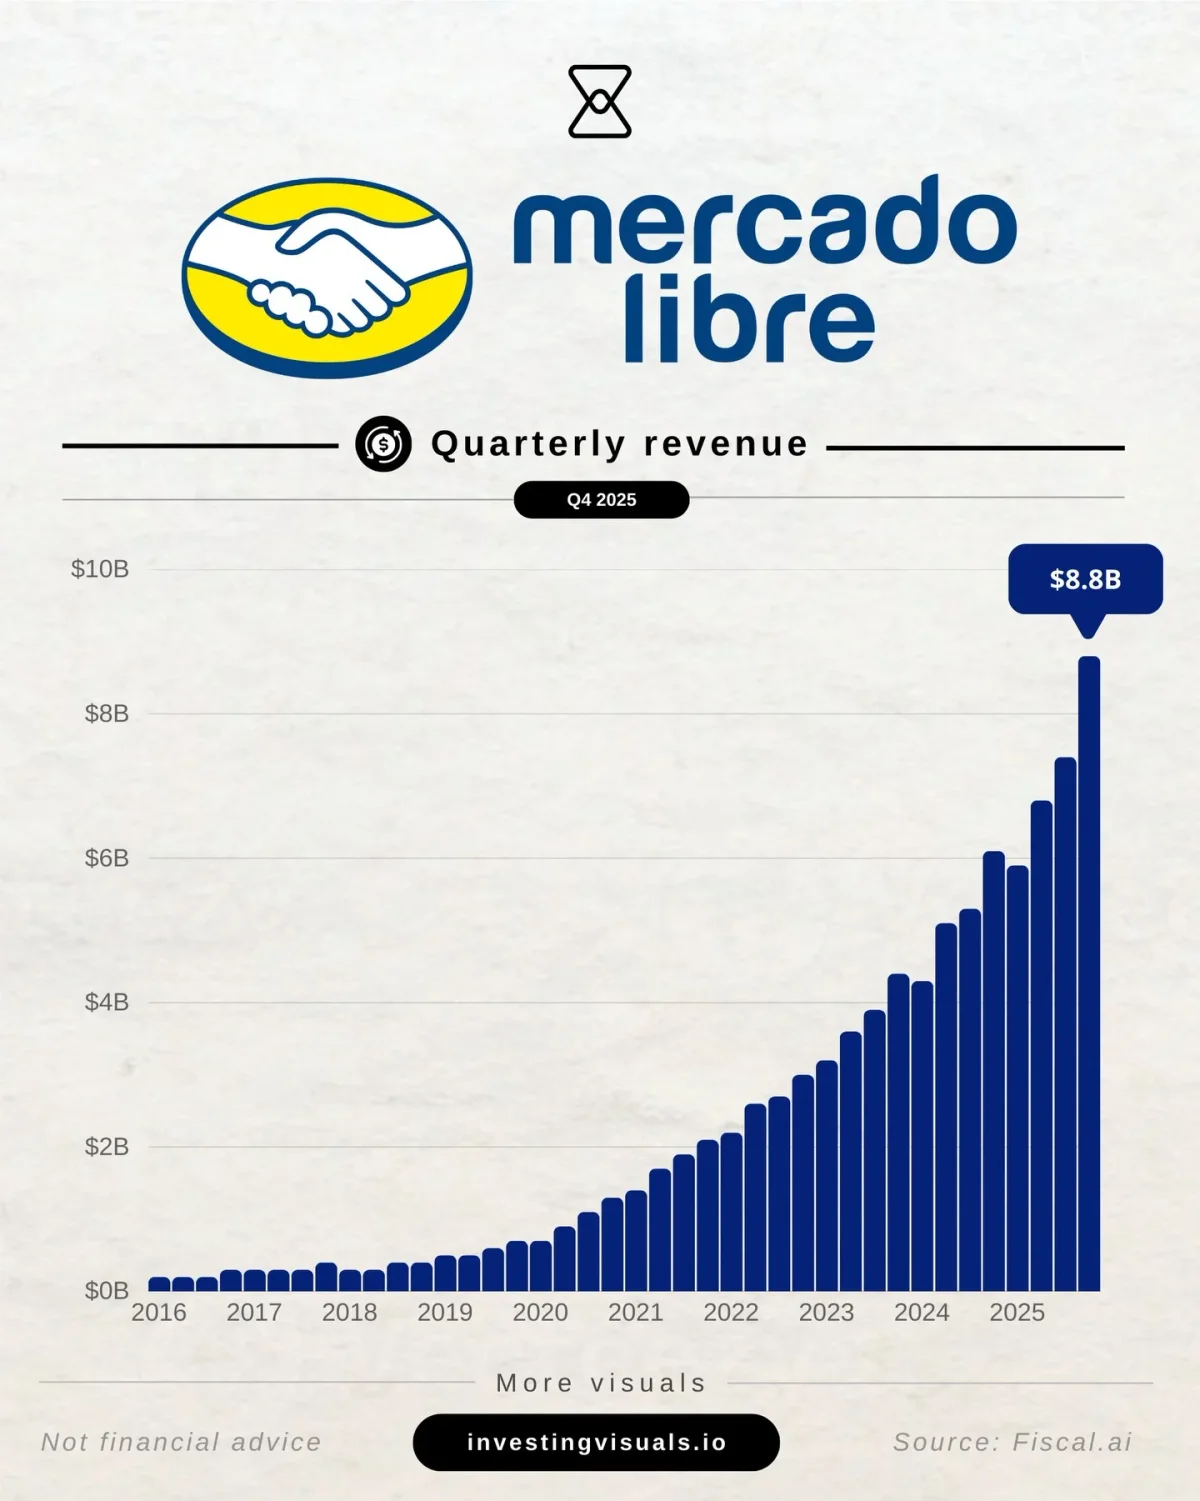
MELI Plunges 35% Despite Booming Growth Metrics
MELI is down 🔻35% from its 52-week high, meanwhile: • 25+ quarter of >30% revenue growth • 83 million unique active buyers (+24%) • Total payment volume of $83B (+42%) And now trading at its lowest valuation ever.

Data Center Bottlenecks Map Reveals Future AI Winners
This data center bottlenecks map is a crucial framework to understand future winners in the AI value chain. I’ve covered it extensively in this research article: https://www.investingvisuals.io/ai-data-center-bottlenecks-map/
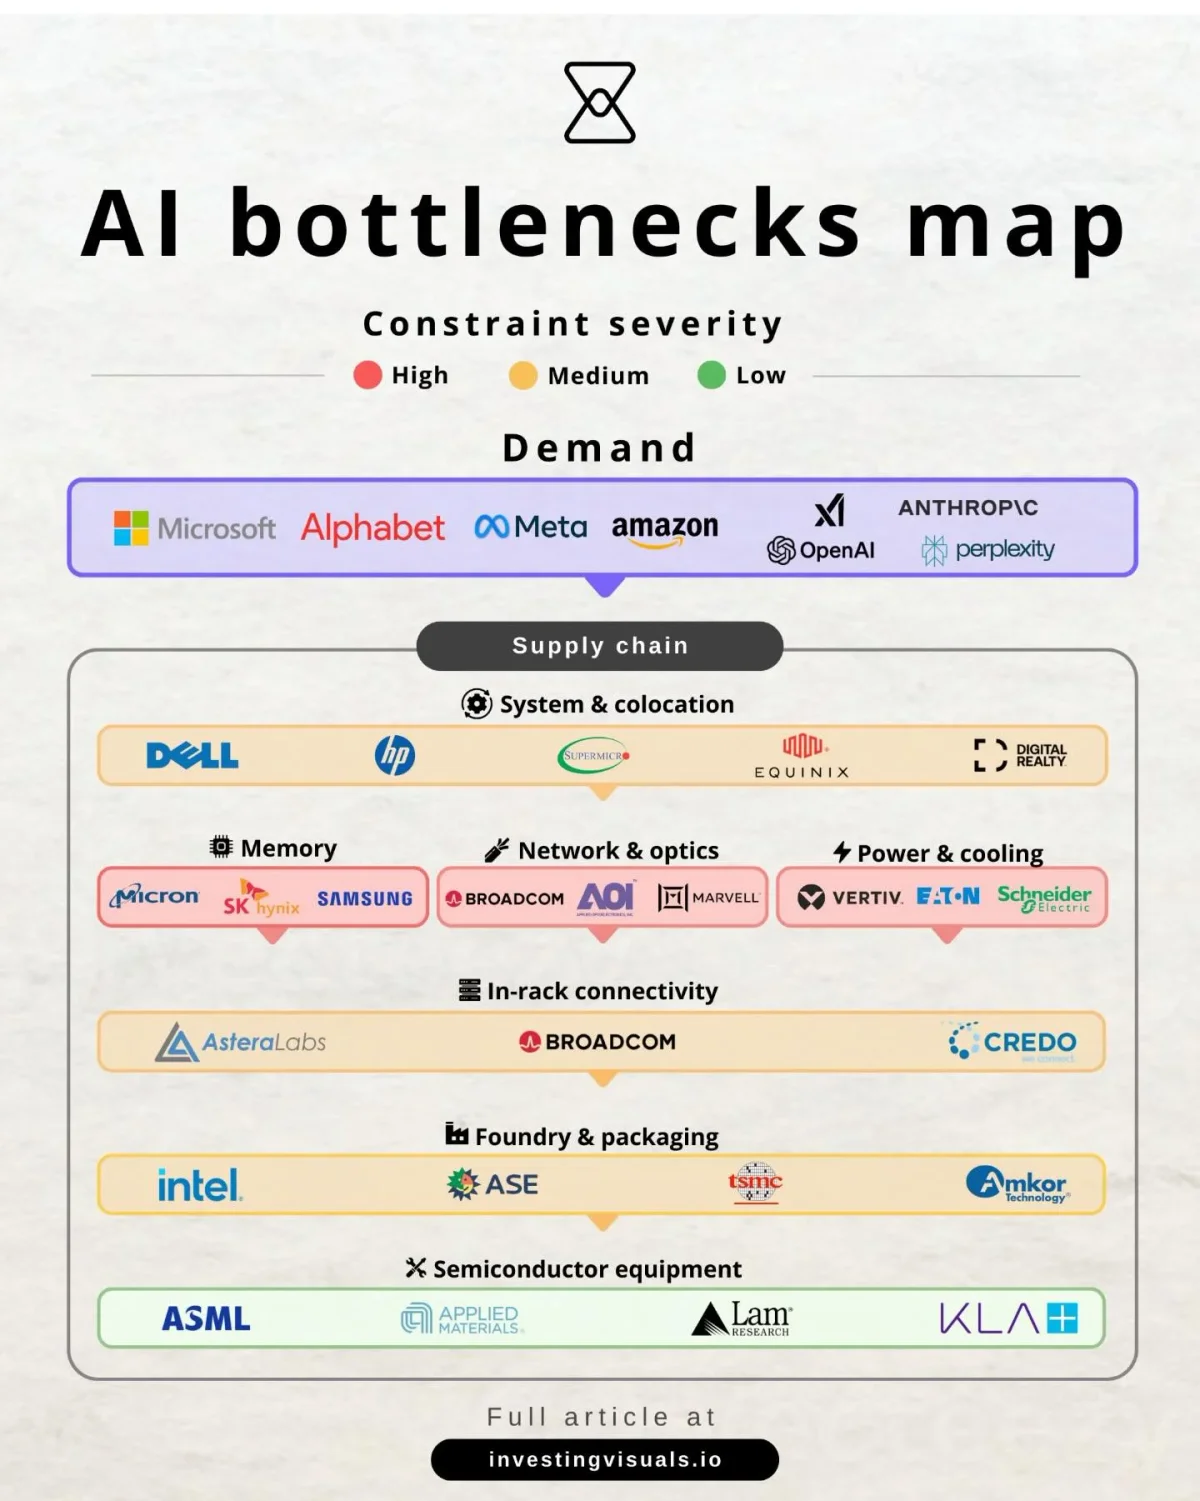
AI Data Center Bottlenecks Mapped Across Supply Chain
The AI data center bottlenecks map & key players: Demand: MSFT, GOOGL, META, AMZN, and foundational AI models. Layer 1 - Systems & colocation: DELL, HPQ, SMCI, EQIX, DLR Layer 2A - Memory: MU, HYNSE, SMSD Layer 2B - Networking & optics: AVGO, AOI,...

MELI Smashes Q4 Forecast with 42% TPV Surge
MELI posting a very strong Q4 2025: • Revenue $8.8B vs Est. $8.5B • TPV: $83.7B (+42% YoY) • GMV: $19.9B (+37% YoY) • Credit portfolio $12.5B
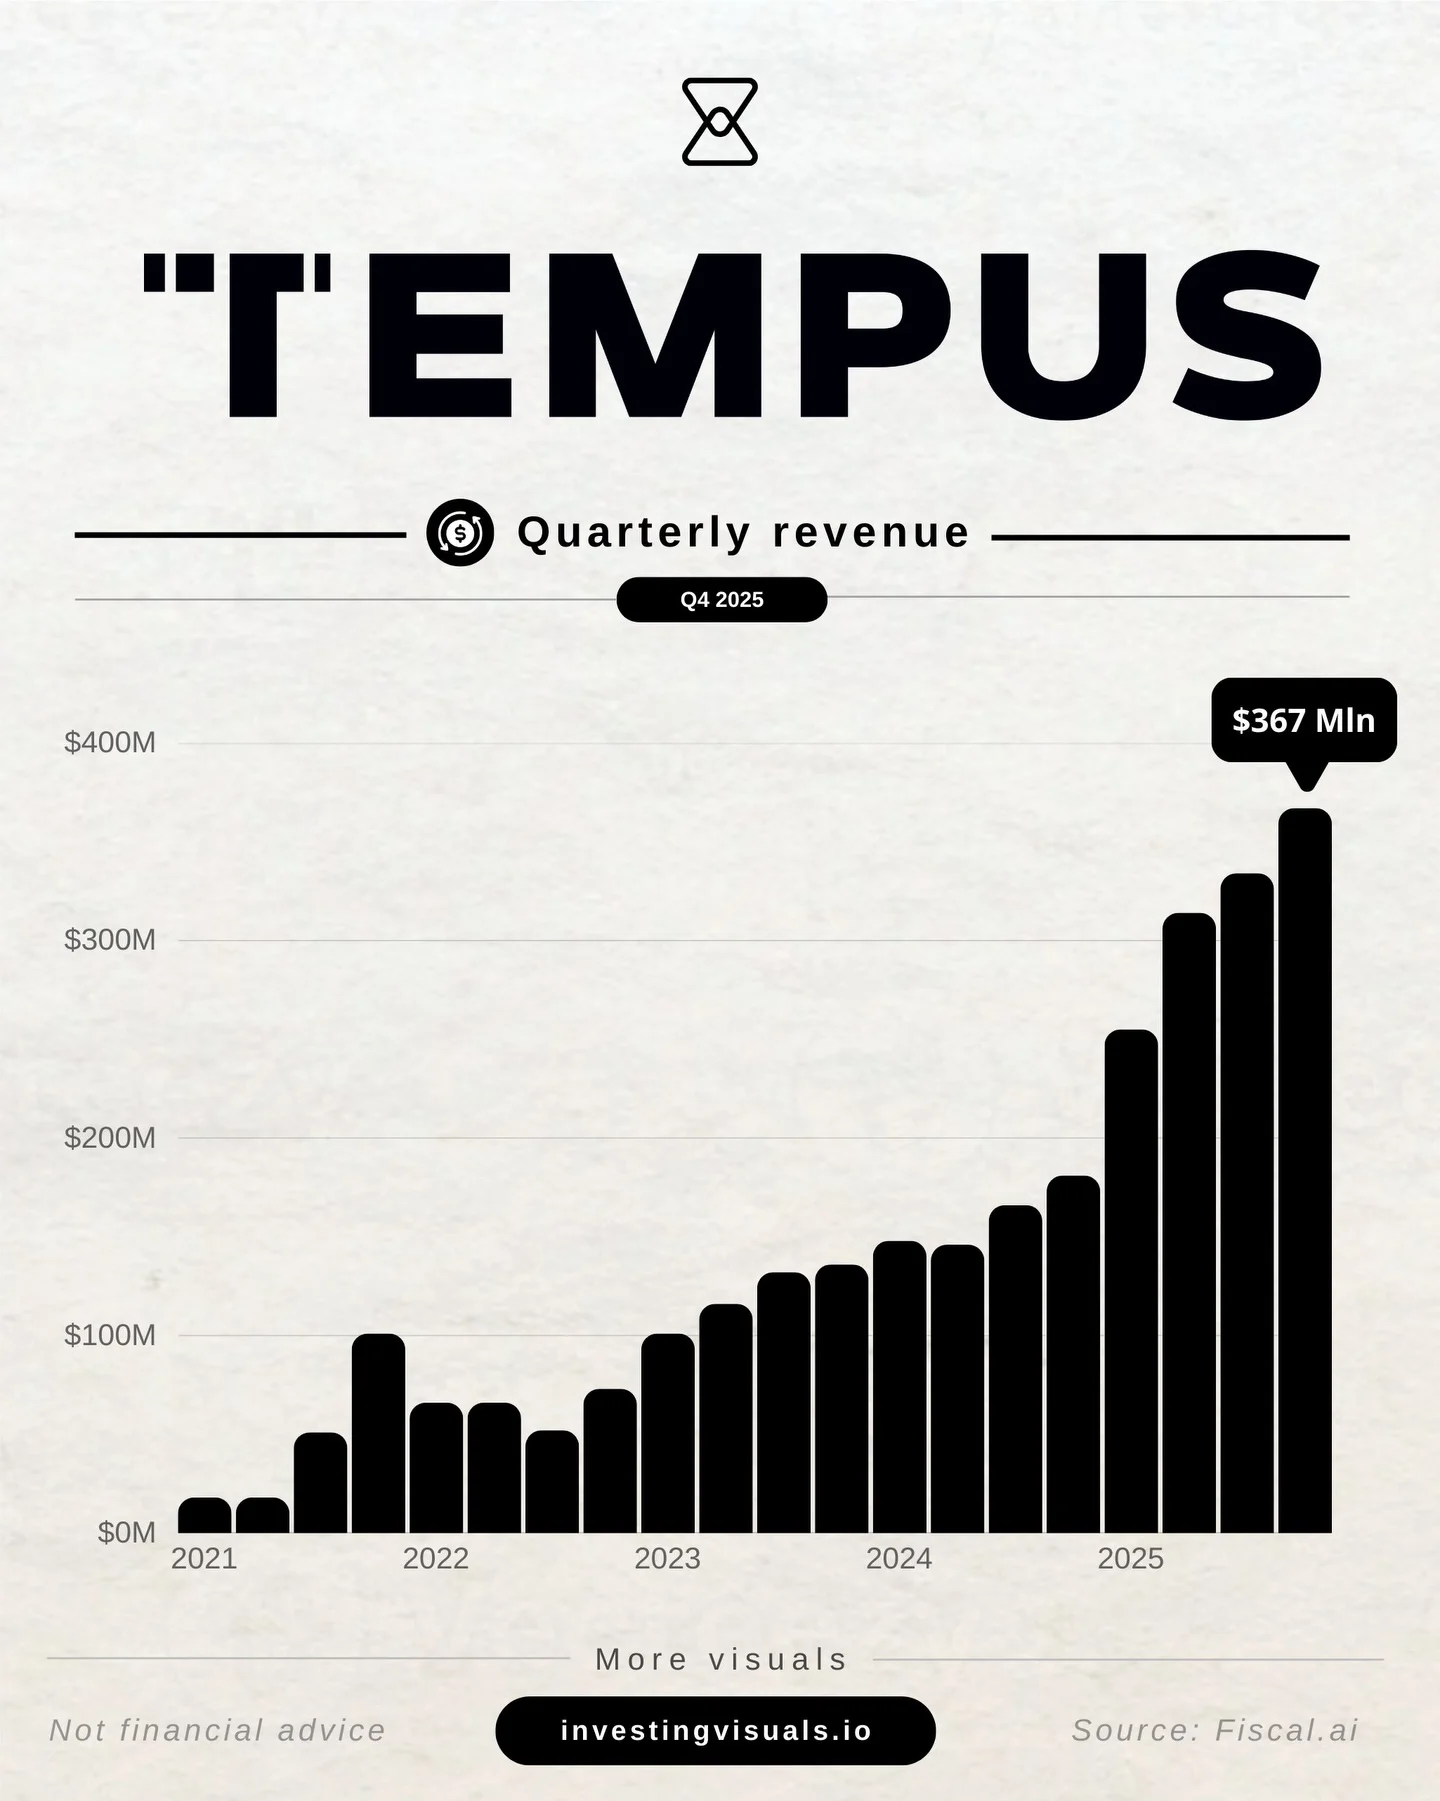
TEM Q4 Beats Revenue, Diagnostics Surge 122% YoY
TEM Q4 2025: • Revenue $367M vs Est. $363M • EPS ($0.04) vs Est. ($0.05) • Diagnostics Revenue: $267M (+122% YoY) FY26 Guidance • Revenue $1.59B vs Est. $1.58B
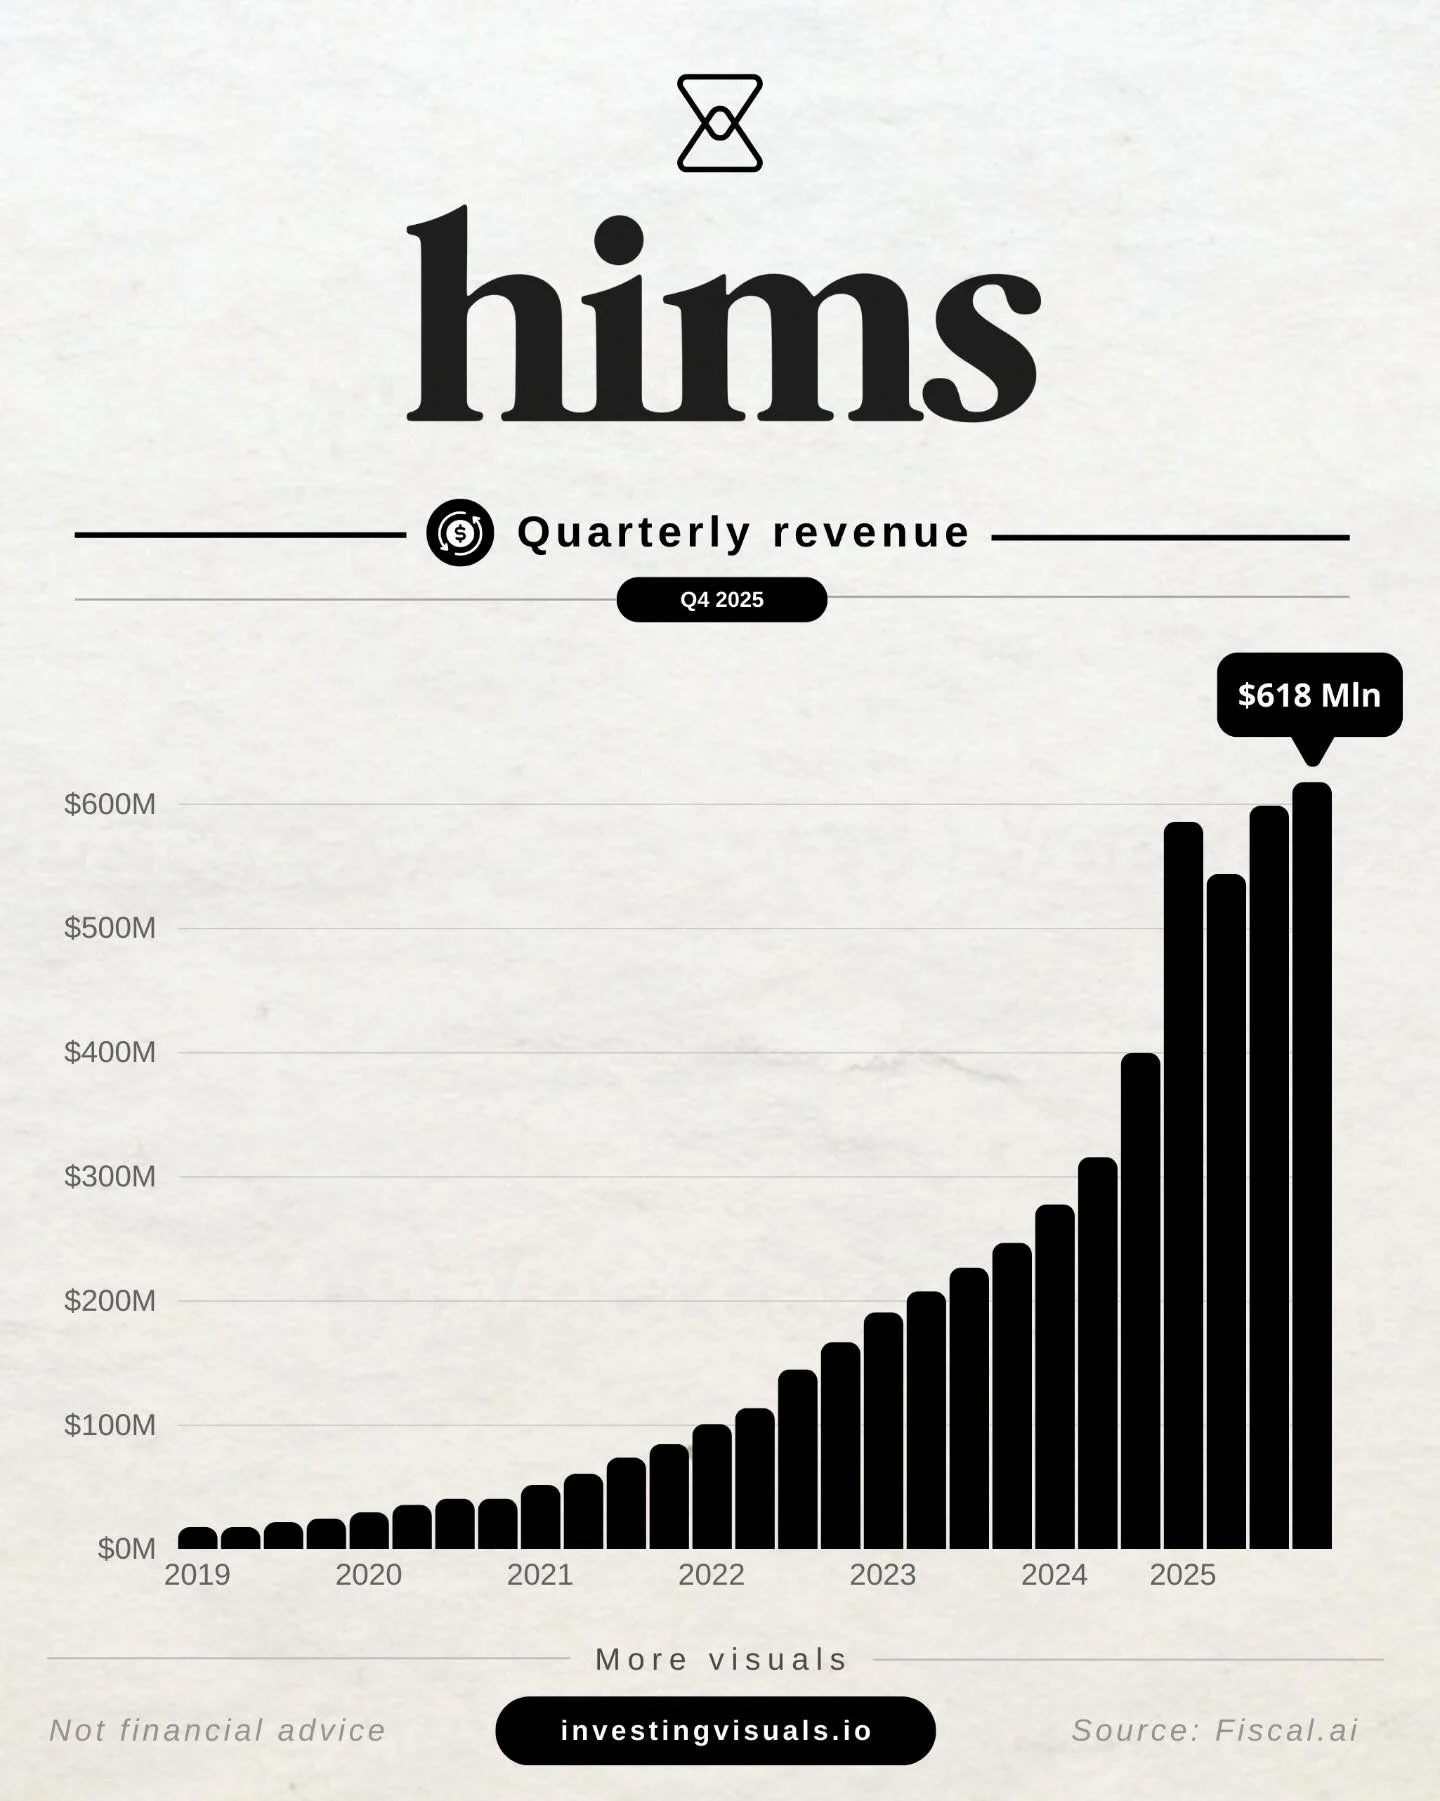
Hims Beats EPS, Guides Revenue Above Estimates
HIMS Q4 2025 earnings: • Revenue $618M vs $617M Est. • EPS $0.08 vs $0.05 Est. • Gross Margin: 72% vs 74% Est. • Subscribers: 2.5M (+13% Y/Y) FY26 Guidance • Revenue $2.8B vs $2.7B Est.
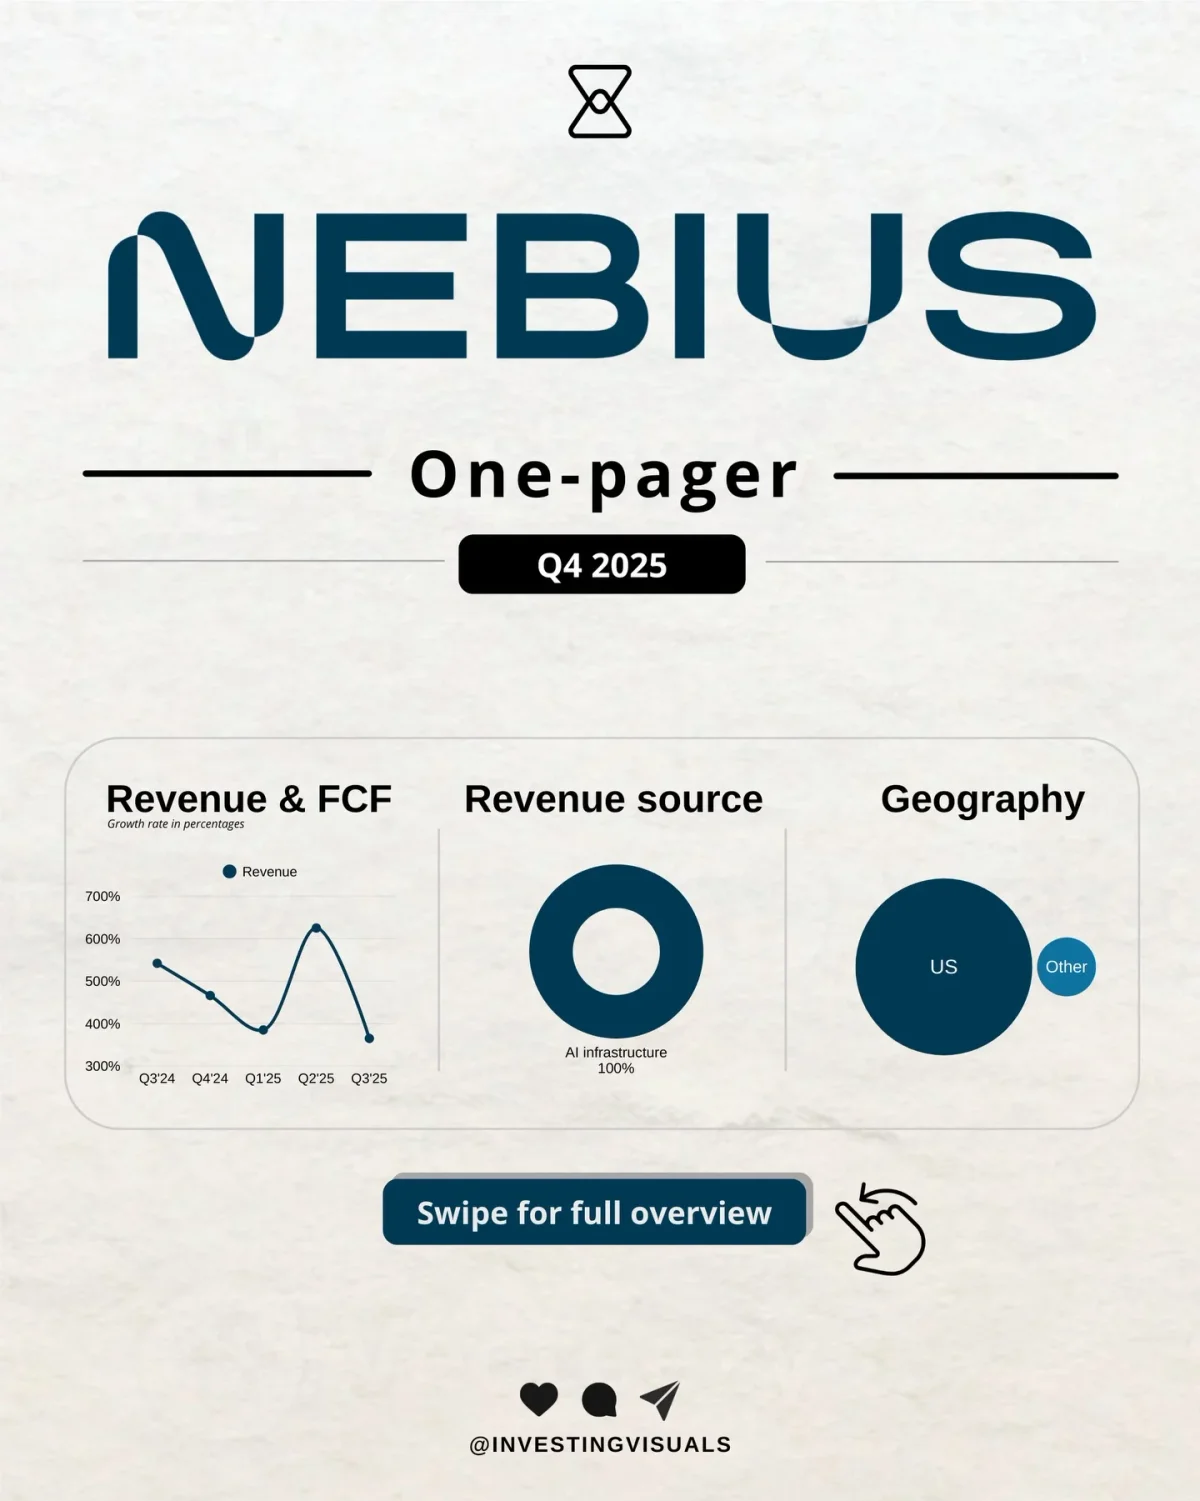
Nebius Q4 2025 Earnings Reveal AI Infrastructure Growth
Nebius, an AI infrastructure business, just released their Q4 2025 earnings. Here’s everything you need to know at a glance: