
Bitcoin Cycle Forecast: 2026 Low, 2029 $300‑500K Peak
Should Bitcoin continue with the most remarkable cyclic patterns of any market in the past 15 years, an investable low is scheduled for Sep/Oct 2026. That low might or might not penetrate the Feb 2026 low. The next high (should patterns continue) will be between $300k and $500k in Sep/Oct 2029 I will announce tradeable thrusts via Factor and @BitcoinLive1 https://t.co/Bq1PhjnRHa and https://t.co/S9kNCOIrWc

Interlocking H&S Top: Inverted Shoulder Highlights Potential Reversal
The chart on the right is one of my all time favorites because it features a possible H&S top wherein the right shoulder took the form of an inverted H&S formation. We identify such structure as "interlocking" H&S
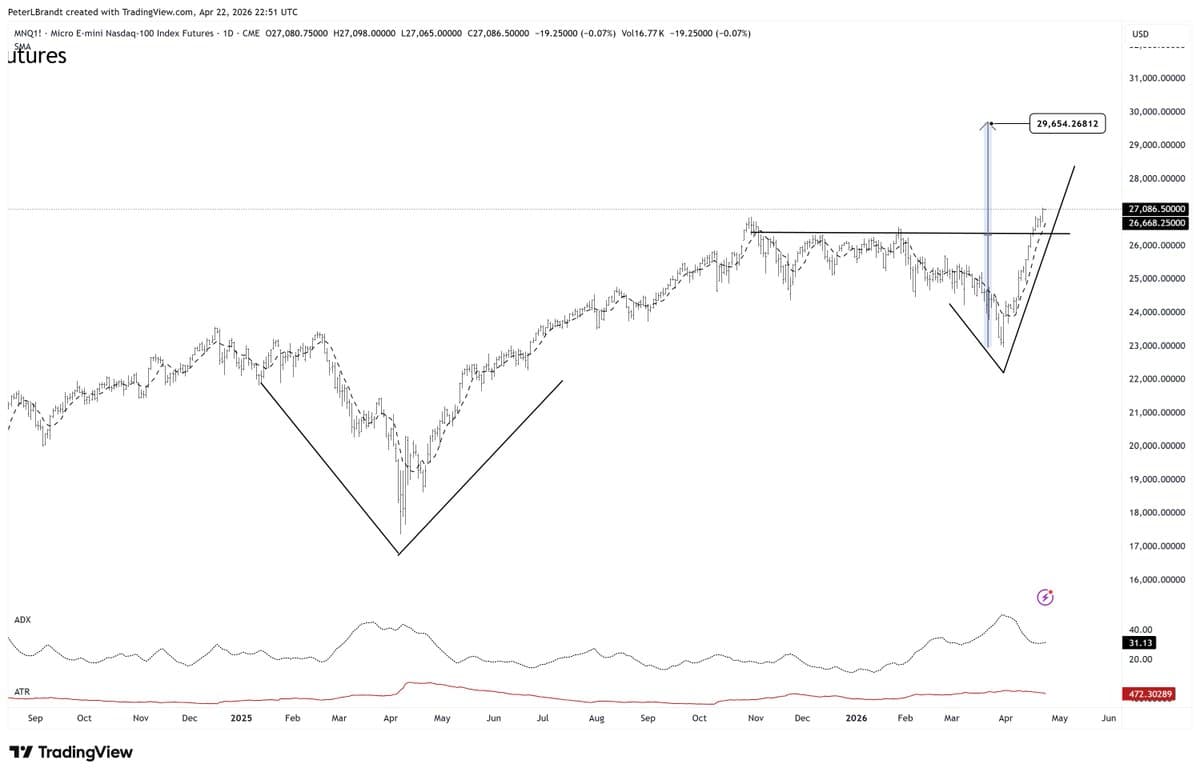
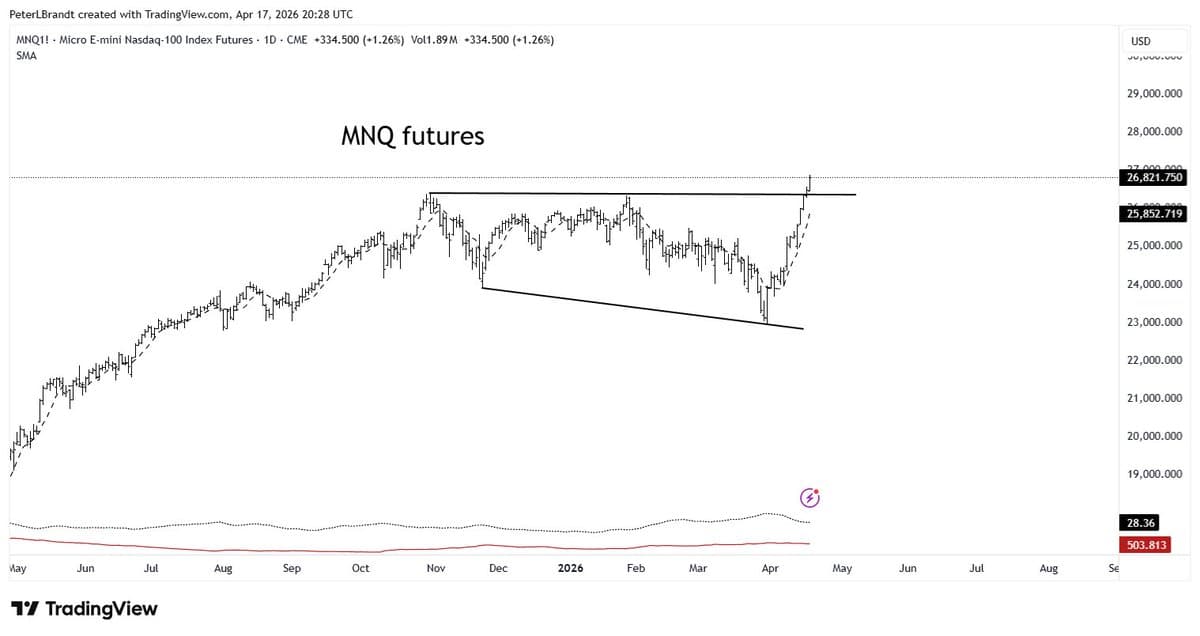
Second V‑Extended Bottom Signals NASDAQ Surge to 29,600
V-extended bottoms are very rare, but they do occur. In fact, this is the second "V"-extended bottom in the NASDAQ in the past year. Now, that is rare. It portends higher prices with an initial target of 29,600 $NQ_F https://t.co/2qSB0vKXhk
Excited to Collaborate on Futures Market Chart Analysis
I look forward to working with you to flesh out these concepts with futures market charts 👍👍👍👍👍
Mideast Tension Drives High‑leverage $1M ETF Futures Trade
This is an idea for traders with a nuanced understanding of etfs and futures - nter at your own risk Actual value of a trade I'm entering - value per $1M of notional capital with a risk of <35 basis points Trade...
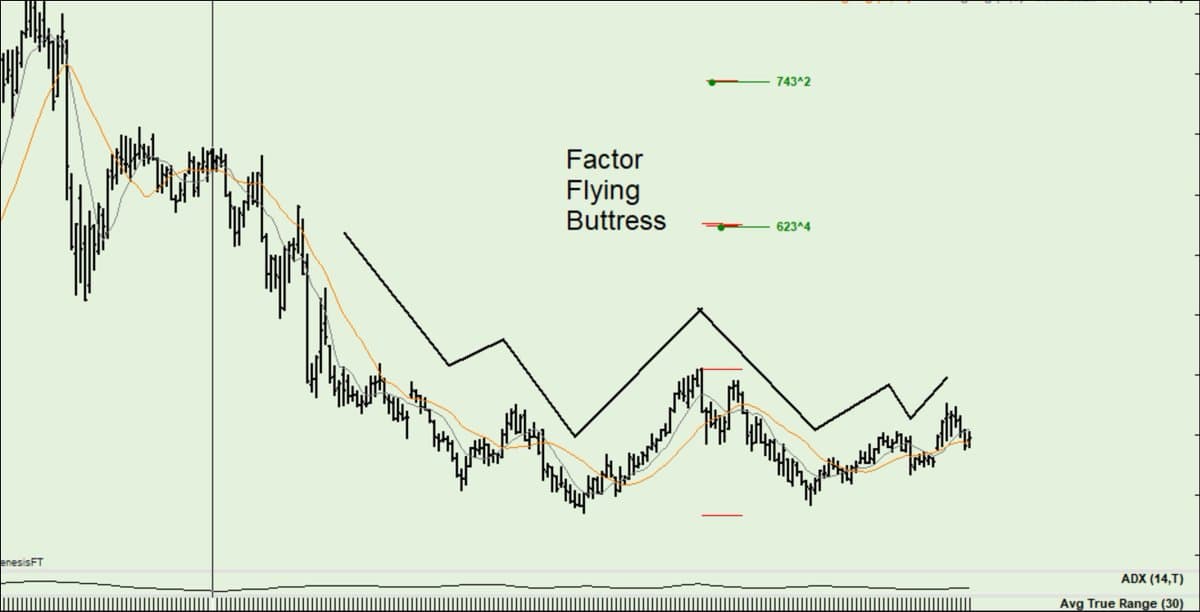
Risk $3,750 for $15,000: Is It Worth It?
This is a Factor Flying Fortress Pattern Over the next year or so the risk is $3,750 to make $15,000 Is this an acceptable R:r for you https://t.co/k0A11YhD7l
Right‑angled Broadening Triangle Bullish Above 25,400
It is called a right angled broadening triangle It is bullish unless price retreats back below 25,400 Read about it in Edwards and Magee, but NEVER in an edition more recent than the 5th. The newer editions have been co-opted and corrupted...
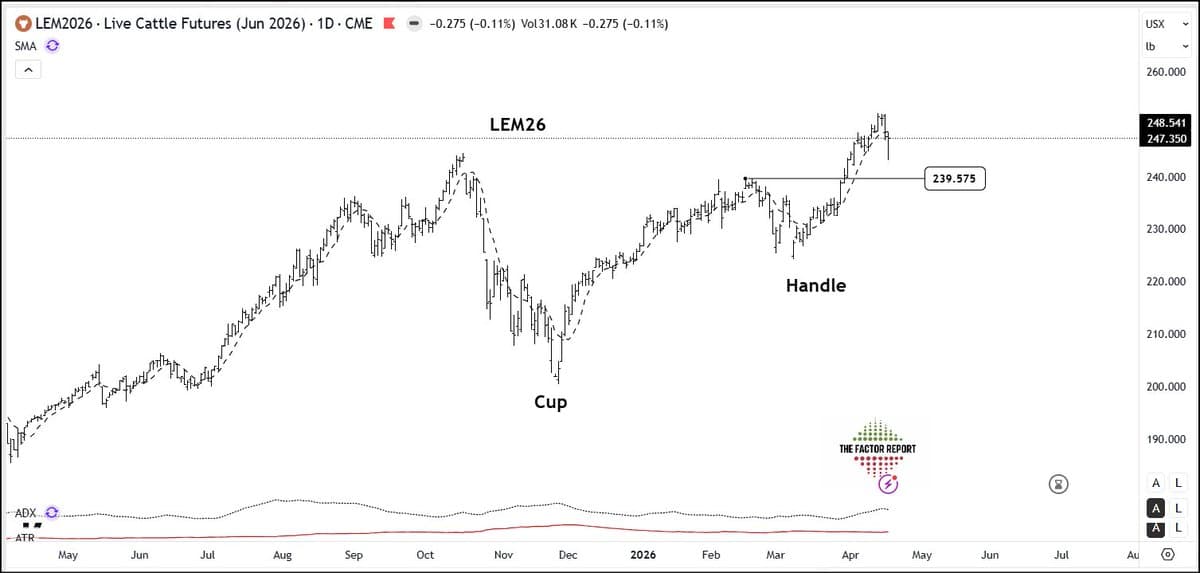
Stock Your Freezer for a Year‑Long BBQ Season
BBQ'd If you plan to do much grilling this year it might be time to stock up the freezer https://t.co/0tEBJVaYas
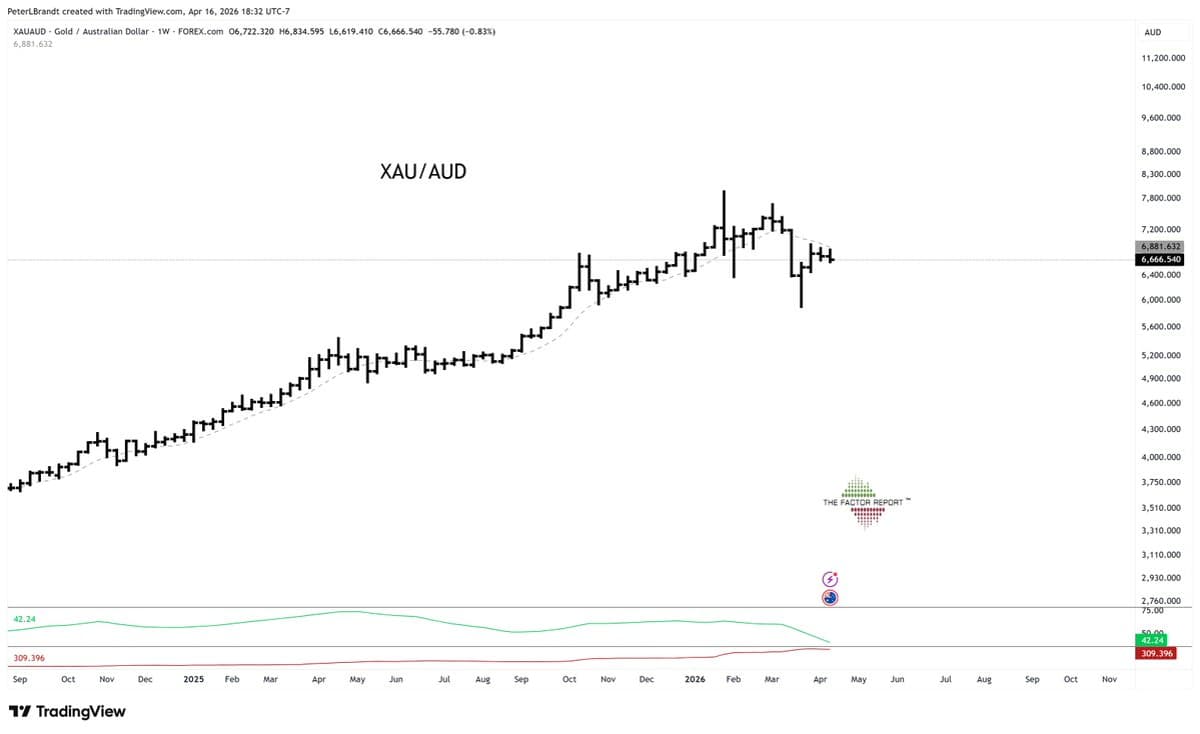
Aussie‑Dollar Gold Chart Predicts Next Big Move
The chart of Gold denominated in Aussie $ has led every move in Gold since 2002 and it is about to make another loud announcement for those who can read a chart $XAUAUD https://t.co/gDeM5nTRIY https://t.co/S5zs7skWeO

NVDA Forms Classic Head‑Shoulders, Target Set at Shoulder Height
$NVDA is a textbook example of the H&S pattern with a target now equal to the height of the H&S projected upwards from the right shoulder high. https://t.co/Fet2aA2lGX

NVDA H&S Failure Signals Bear Trap, 236 Target
A textbook example of the H&S failure is $NVDA. Here an 8-month H&S top was completed briefly on Mar 30 with NO follow through. This was the first point when a bear trap was detected. The target of a H&S...

One Line Suffices; Extra Lines Are Rookie Overkill
Hey aspiring chartists If you need to draw more than one line on a chart to find a trade you are in big trouble One is all that I ever really need for any given trade Anything more is rookie overkill https://t.co/vu4M7wmjMS

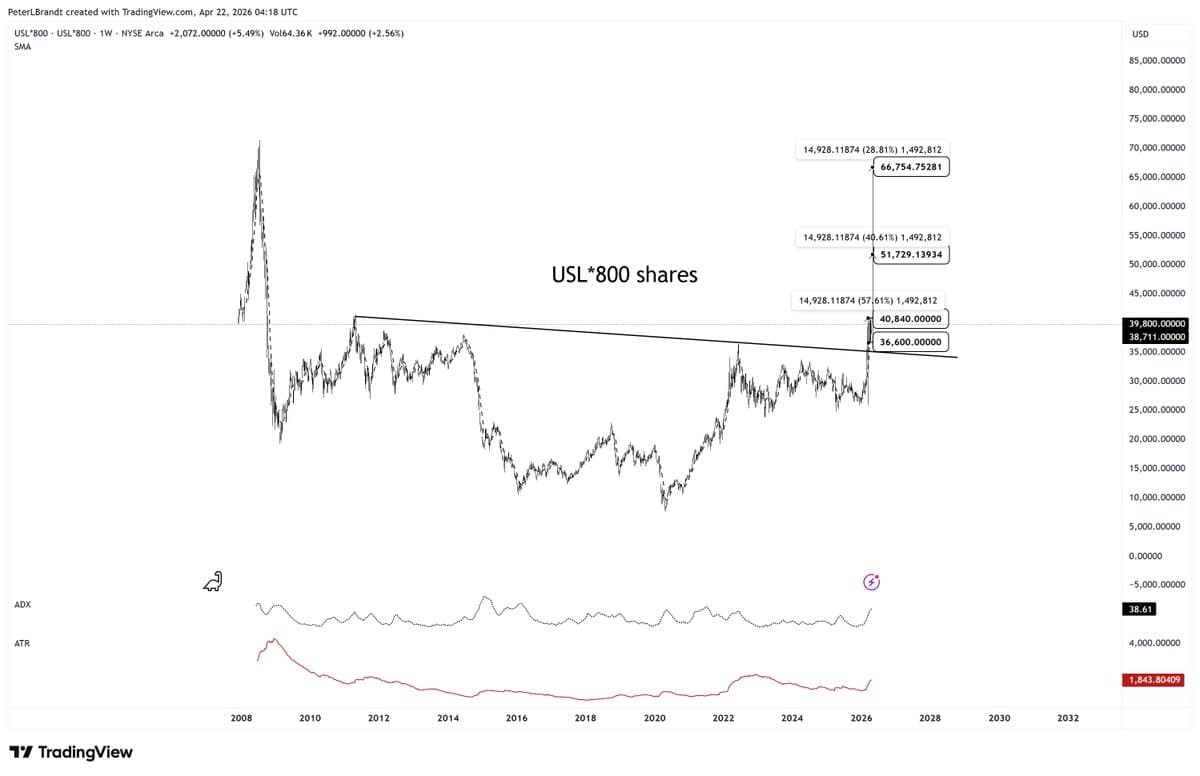
Factor Goes Long on Small‑Cap ETFs, Targets Higher Gains
The children have entered the parade. The Factor company account is long in this space. Much higher targets in mind. $SCHA $IWM Stay tuned. Follow the parade here: https://t.co/gDeM5nTRIY https://t.co/6CxE0wC8OT

Embrace Uncertainty: Don't Ignore Possibilities in Charting
Cheds, I never want to ignore a possibility. There are no certainties in charting. And, probability does not apply to individual slices of time. Not an ideal Compound Fulcrum. Let's follow the P&F work. See example of Copper from 50 years...

SMH Downside Targets Using Measured Moves, Not Fib
This is $SMH showing two downside targets I do NOT use Fib and never have I am a Edwards and Magee/Schabacker measured moves guy https://t.co/6LWeuk1wnA
Avoid Fighting the Fed; Focus on Systemic Resets
Personally I think you are right Tom. Never fight the Fed is a good policy. Of course the dominant factor in 2008 was mortgage bubble. Only possibility now would be connected with Dalio's Great Reset and related issues

Gold Likely to Hit Multi-Year Low, 75% Chance
Hey @PeterSchiff I am giving it a 75% probability that this week's low or maybe slightly lower will be the low for Gold for years to come https://t.co/tXbWvueWh7

Most Aspiring Traders Fail; Trade Real Futures Instead
OK, let me say it... 95% of you who think you will become this successful active trader driving a Lambo, drinking fine bourbon, taking pics with blonds on a private jet... ...will absolutely fail My advice to you -- PLEASE trade real futures...

Bitcoin Follows Classic Charting Rules Better than Most Markets
Note to cryptomaniacs I find it amusing when I read on X chatter that charting does not work on an asset like Bitcoin.🤣 Actually, Bitcoin obeys the rules of classical charting (Schabacker, Edwards/Magee) better than most markets What you think does not matter...

Limit Trades to Three Per Market, Trust Weekly Charts
Trading frequency - a commentary from a five decade veteran I follow about 40 global futures markets I enter each year figuring that I might three good signals in a given market over the course of 12 months -- maybe four. That's...
Profit Comes From Price Action, Not Fundamental Analysis
Fundamental analysis -- this is what I think You don't get any profit from fundamental analysis. You get profit from buying and selling. So, why pretend with the appearance when you can go right to the reality of price and analyze...

Silver's Head Shot Hints at Deeper Weakness
The price bar in Silver today is something I call a "head shot." Head shots are often a sign of volume overcoming demand and suggestive of further weakness. I am looking for a tradable bottom in the support zone (yellow) $SI_V...
Gold & Silver ETFs Bought Amid Low Overnight Market
Note to those who follow me who are not trolls The overnight markets were not nearly as volatile as many markets I have endured over the years Not tame -- but not roaring lions either Gold and Silver etfs were buys last night...

Buy Gold at Tier 4 After Peak, Use ETFs
This is a grid I have used to provide a framework for Gold for members of my private community. Channel Tier 4 was my buying range after market peaked at Tier 8 ETF for retirement accounts --- not futures yet https://t.co/DasqIqO0oT

Breakout Signals Buying Opportunity in Silver
Strong feeling this was the break to buy in precious metals For sure the break to stack $SI_F https://t.co/uLHE50DU5D

Current Market Patterns Mirror 1929, 2000 Crashes
Compare and contrast Often what happens after we see a: 1. Sustained bull trend 2. Spike down after trend 3. Rising wedge retest of top Just pointing it out Don't shoot the messenger Gold now, NASDAQ 2000, DJIA 1929 https://t.co/fFyn50f1Dt

Chart Not Yet Bearish, Trend Still Unclear
This is hardly the chart one could look at and say: "Wow, we are really in a bear trend" It may become a bear trend -- but it is NOT there yet $NQ_F

Trolls Panic as Silver Nears Half Its January Peak
Funny reading back through the comments from the trolls now in a panic with Silver almost at 50% of its Jan high What ever happened to the Silver supply shortage and the big premiums in China?

Platinum Now in Intermediate Bear Market; Risk of Full Rout
Platinum has now entered an intermediate bear market The problem with intermediate bear trends is that they can become complete routs https://t.co/MdjgBz11ky

Europe Faces $141 Brent Pump Prices Over Iran Sanctions
Hey Europe Get ready to spend big at the pump The chart suggests $141 for North Sea Brent But that is the price you pay for being idle on Iran due to your #TDS You would have supported Obama and What's His Name (he...

Infl
Crude Oil Adjusted for inflation the price of Crude Oil is cheap even at $94 Not inconceivable to think about $200 Crude $CL_F https://t.co/AA3Vu3G1AF

Bitcoin's
Comment on Bitcoin I am well aware that you cryptocultists cannot stand the idea of traders being flexible and not totally dogmatic like you, but Bitcoin is set up for me in two ways. The horn is constructive The flag is ugly Take your...

Equities Overpriced Amid 1970s‑Style Rate Surge
In case you have not noticed yet, we are reliving the 1970s with interest rates heading higher and commodity prices blasting off In the 1970s U.S. equities rattled back and forth in a 50% range U.S. equities are overpriced now -- but...

Gas Oil Retests Support, Poised for Further Upside
Gas Oil has retest support and should now push higher, although one more retest is possible https://t.co/NI5aQRpZPM
Overwhelmed by Extreme Bitcoin Bulls, Time to Block
Somehow I am on a bunch of threads with insane Bitcoin bulls. They are completely nuts. I need to do a lot of blocking

Key Chart Sparks Discussion Among Factor Community
This could be an important chart. Discussing it today with members of the Factor community at https://t.co/gDeM5nTRIY $FGBL1! https://t.co/4KCxWZ88fE
Credit @The_JDK99 for Bitcoin Parabolic Banana Code
BTW, I must give credit to @The_JDK99 for developing the coding I use to show the Bitcoin Parabolic Banana They are a must follow

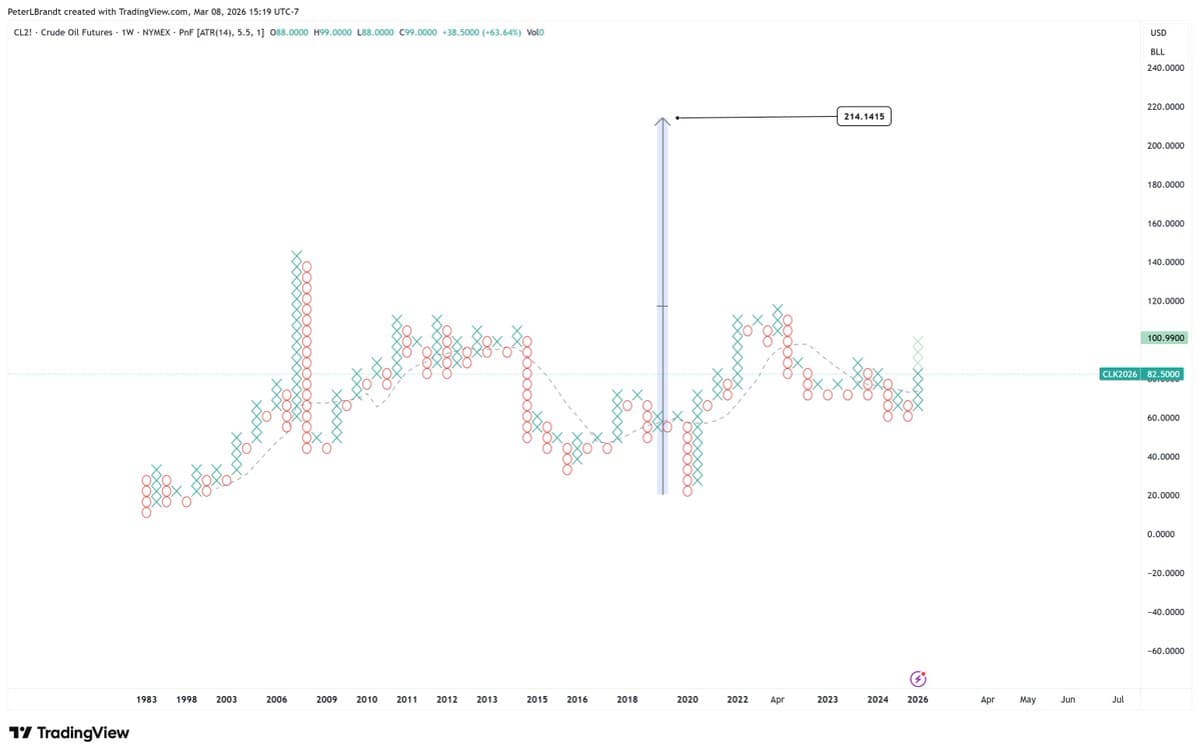
Inflation‑Adjusted Crude Oil Poised for $220 All‑Time High
Crude Oil adjusted for inflation is quite cheap An all-time high is very realistic -- that would put Crude above $220 per barrel Likely by the end of this decade $CL_F https://t.co/oQOmEtjGtH
Inverted Hammer Signals Bearish Continuation, Not Bullish
Good call Cheds. It’s hard keeping these bitcoin bulls, honest, but somebody has to do it.

Big Banana Signals Imminent Bitcoin Split
The Big Banana is forming a Little Banana -- and it indicates there is about to be a Banana Split $BTC🍓🍌🍨🫕 https://t.co/0bDCPU3tGP
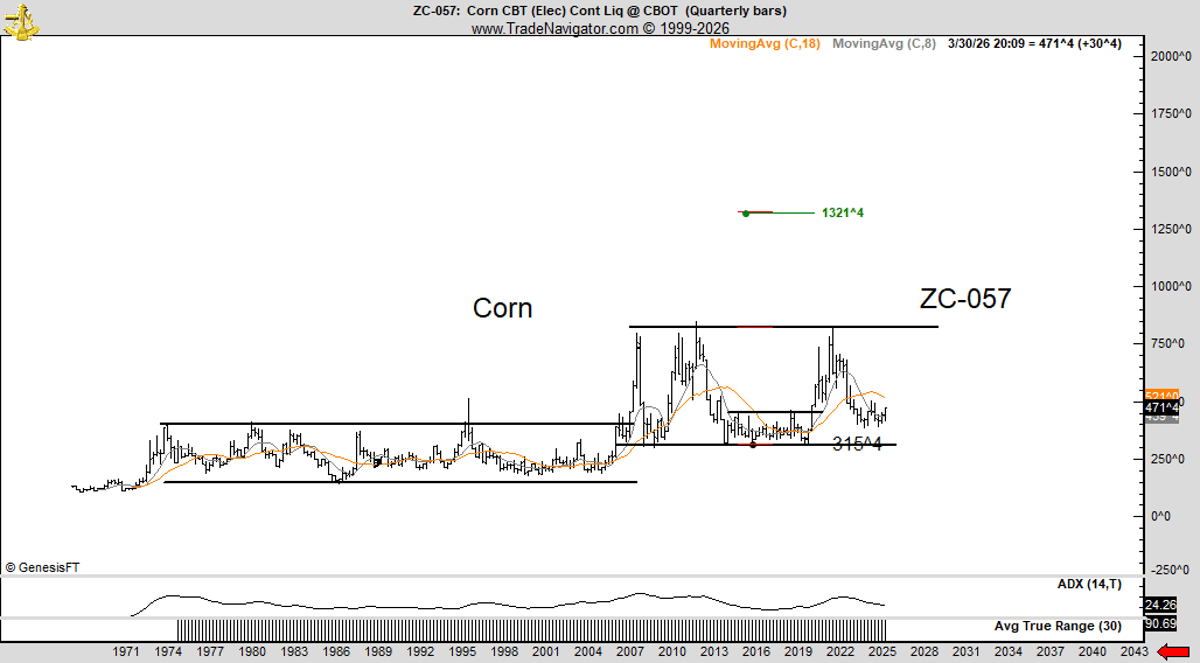
Corn Ethanol Future: $13 Corn, $27 Beans, Flex‑Fuel Viable
Corn will eventually trade at $13 Beans will eventually trade at $27 Maybe not this decade, but someday Corn ethanol is a fuel My truck (Nissan) is approved for flex-fuel (FFV) It can run on gas that is 80% corn ethanol $ZC_F $ZS_F https://t.co/CYZjGOzeLt

Unfilled S&P Gap
Left is a still unfilled gap in S&Ps from Jan 1, 2013 Will another gap in S&Ps become unfilled? Just asking for a friend. https://t.co/cNPv8XxpVb
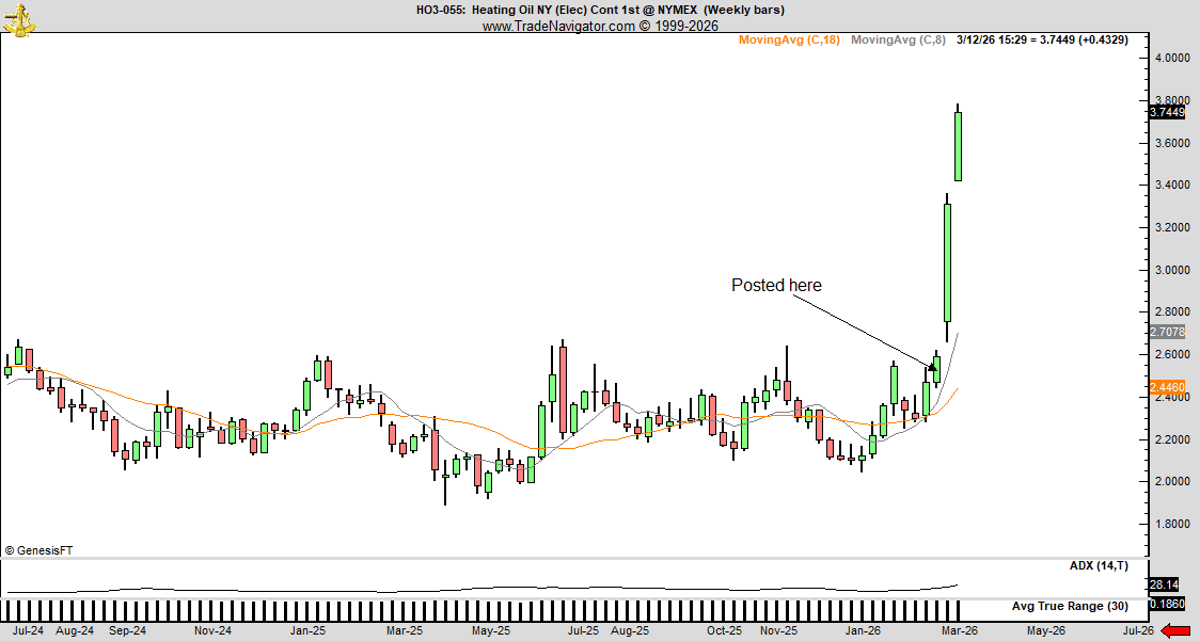
Rising Fuel Costs Trigger Supply Chain Margin Collapse
If you go back you will see that I did. This is the chart I alerted members to my private X service to three weeks ago https://t.co/ebO2QwWczT
Rising Crude Oil Threatens Airline Stocks This Week
If Crude Oil does what the chart indicates might be possible, then airlines are headed for a world of hurt. I would not want to be long airline stocks this coming week $CL_F For all you fancy-pants newbie chartists, this is called...
Measure Return on Risk Against Total Capital Only
WARNING ROR must ALWAYS be measured as the % return of an individual trade against TOTAL nominal capital Ppl who tout ROR as a percent return against margin or options cost or an individual stock or similar are JUST PLAIN FOOLS playing...
Ag Products Face Re‑pricing; Live Cattle Lead the Shift
I love this chart Shawn I also think ag products will enter a period of re-pricing. Live Moo Cows have already done so

Align Daily and Weekly Trends for Successful Trades
Market speculation All markets zig and zag -- most of the time randomly This zigging and zagging takes place on multiple time frames A market might be zigging and zagging downward on one time frame while zigging and zagging upwards on another time...

Potential Significant Change in Price Behavior Since October Top
I view this as potentially the significant change of price behavior since the top in Oct @BitcoinLive1 report forthcoming at https://t.co/B21biKQ8fC https://t.co/gHEXGfaC4x

January Effect Predicts a Strong USD All Year
Yes, the January Effect is my leading theory for this year -- strong USD throughout the rest of the year
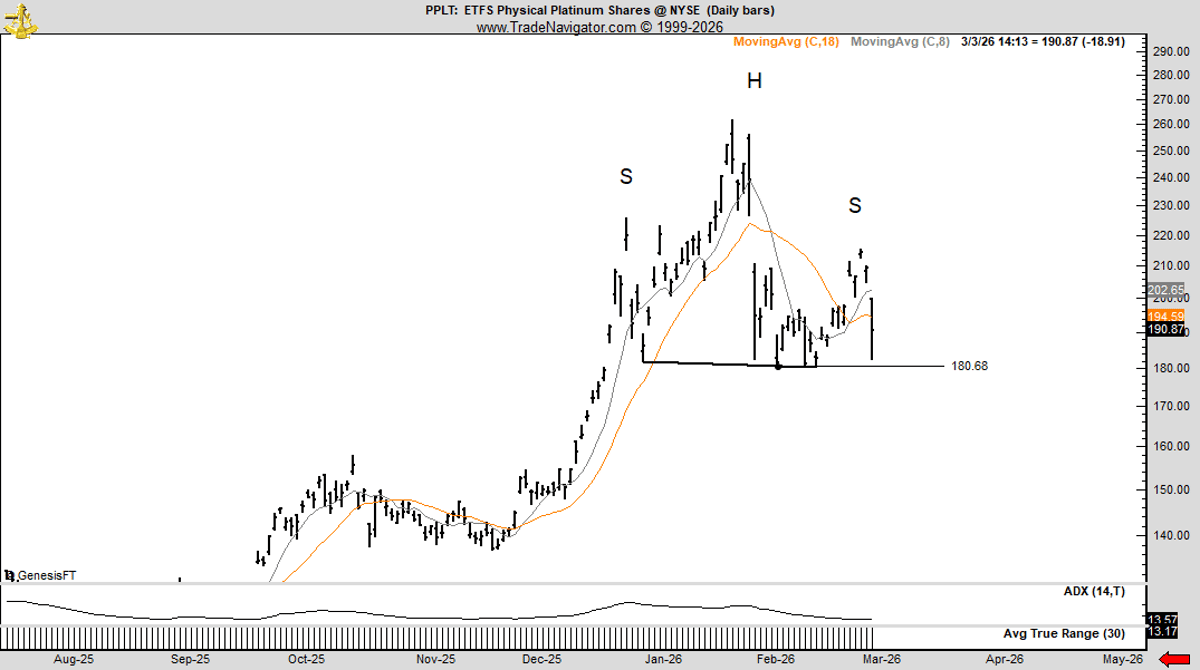
Platinum Chart Signals Impending Head‑and‑shoulders Reversal
Charts can always morph, but it looks to me that the Platinum party is about to be interrupted by a head and shoulders pattern. I am not allowing replies on this because I have no interest in reading what you...