
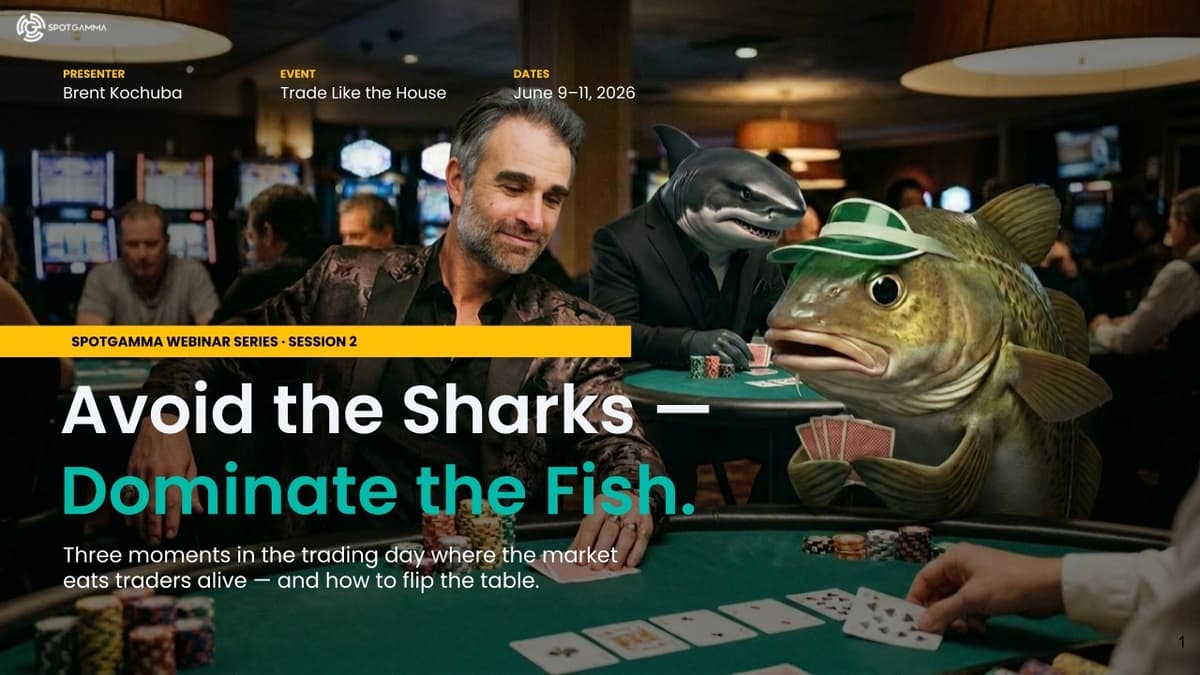
Avoid the Sharks, Dominate the Fish | SpotGamma
The SpotGamma video frames retail trading as a battle between "fish" and market‑making "sharks," urging traders to stop reacting to headlines and instead adopt a house‑style edge. By monitoring dealer positioning, gamma exposure, and open‑interest data, the host claims investors can anticipate when market makers will act and align their trades with that flow. Three critical windows dominate the daily market rhythm: the pre‑market news scramble, the high‑volume opening hour, and the risk‑cleaning close. Each period concentrates dealer activity, creating predictable volatility spikes that can be exploited with a pre‑defined plan rather than impulsive moves. The presenter repeatedly likens the approach to poker, noting that “the house doesn’t predict, it structures odds in its favor.” He cites Citadel’s multi‑billion‑dollar edge and shares SpotGamma’s own morning note, which maps zero‑DTE option concentrations around key S&P 500 levels such as 7390, 7420, and 7450. For retail participants, the message is clear: replace noisy news and generic indicators with concrete positioning data, schedule trades around the three shark‑feeding windows, and use SpotGamma’s analytics to set support/resistance targets. Doing so transforms the trader from prey into a participant who can profit from the same forces that traditionally benefit market makers.
May OPEX (Options Expiration) Live with Brent Kochuba | SpotGamma
Brent Kochuba said this is OPEX week and described a market shift from high equity correlation driven by Iran/oil fears to a risk-on, AI-led rally after strong earnings and a ceasefire narrative. Options scanners show calls rich versus puts in...
How SpotGamma Nailed an 18:1 Apple (AAPL) Intraday Trade
The video presents a detailed case study of an intraday Apple (AAPL) trade executed on April 11, illustrating how SpotGamma’s proprietary tools can be used to locate and plan high‑conviction positions. Using the Compass guided view, the trader identified Apple’s unusually high...

Wars, AI & Volatility, What’s Ahead? SpotGamma + Macro Expert Warren Pies
The interview with macro strategist Warren Pies explores why recent equity rallies—13‑day Nasdaq streak, 12% two‑week jump—may be less about geopolitical de‑escalation and more about structural market forces. Pies points to “momentum thrusts,” defined as 10‑day, 10% advances, and a “debasing”...
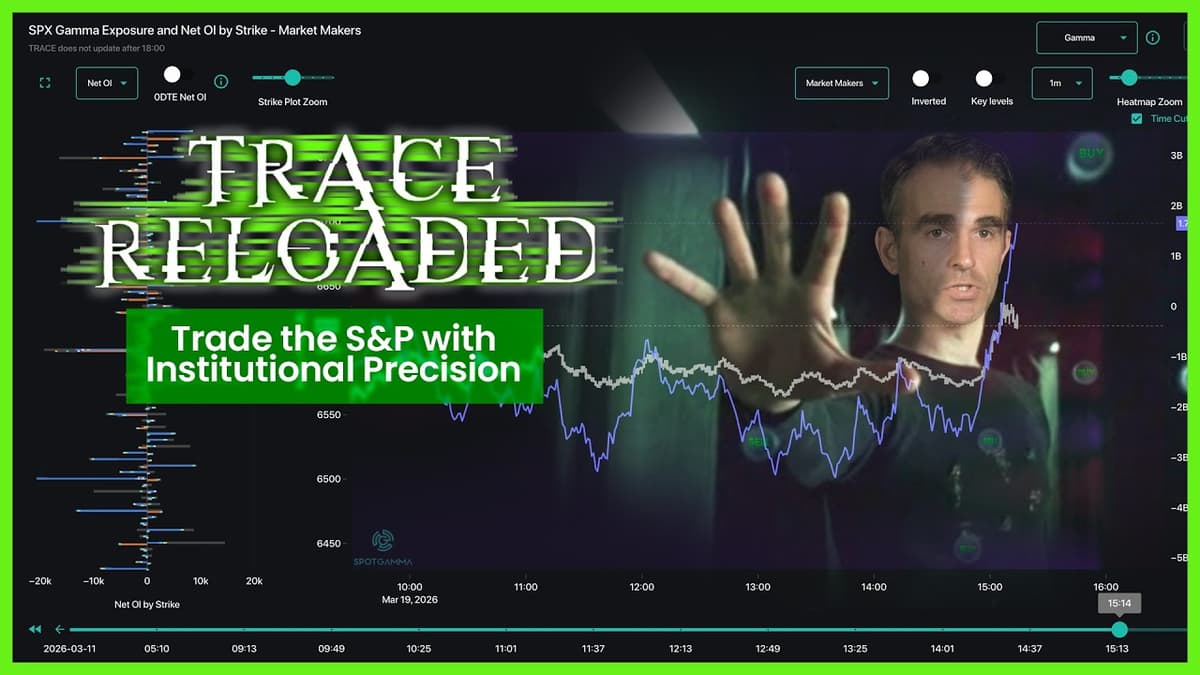
TRACE Reloaded - Trade the S&P with Institutional Precision | SpotGamma
SpotGamma unveiled Trace Reloaded, an upgraded version of its flagship gamma‑monitoring platform, promising minute‑by‑minute updates of S&P 500 options‑derived gamma (GEX). The rollout emphasizes real‑time heat‑maps that differentiate buying and selling pressure with intuitive red‑blue (or purple) color schemes, and...

Oil Down, GLD, SLV, BTC & Stocks Up: CFOF LIVE From Cboe
Crude oil prices slipped, opening the door for a risk‑on rally that lifted stocks, gold (GLD), silver (SLV) and Bitcoin. A panel of market strategists from Cboe discussed how lower energy costs are boosting equity momentum while still supporting precious‑metal...

Main Chart | TRACE Walkthru #3
The video walks users through Trace’s main chart, a real‑time heat map that translates S&P 500 options flow into visual signals. By layering three analytical lenses—gamma, delta pressure and charm—the platform aims to show where market pressure is building and how...

GEX Lens | TRACE Walkthru #2
The video walks users through the GEX Lens interface, emphasizing the left‑hand strike plot that visualizes options positioning for different market participants. By toggling between open interest, net OI, and the GEX lens, traders can see contract volumes or gamma...

TRACE Reloaded - Trade the S&P with Institutional Precision | SpotGamma
SpotGamma unveiled Trace Reloaded, an upgraded platform that visualizes S&P 500 options gamma (GEX) in real time. The tool updates every minute, delivering a color‑coded heat map that shows where market makers are buying or selling options. The new version adds...

Oil Down, GLD, SLV, BTC & Stocks Up: CFOF LIVE From Cboe
Oil prices slipped, sparking a risk‑on shift across markets. In response, gold (GLD), silver (SLV), Bitcoin and U.S. equities all posted gains. A panel of market strategists from SpotGamma, Market Rebellion, Investor’s Alley, Kurv Investments and Prosper Trading discussed the...

Options-Traders Delight as VIX Pops, SPX Stuck: CFOF LIVE From Cboe
A live Cboe panel highlighted a sharp VIX surge while the S&P 500 index stayed flat, creating a rare sandbox for options traders. Experts from SpotGamma, Market Rebellion, Nations Indexes and Prosper Trading Academy dissected how volatility is routinely overpricing...

Basic Delta Hedging Math
The video explains the mechanics of delta hedging using Nvidia as a case study, illustrating how market makers manage large option trades. When an investor purchases thousands of call options, the market maker becomes short the aggregate delta of those...
How SpotGamma Nailed the MSTR (Strategy) Breakdown for a 9:1 Trade
The video walks through a SpotGamma case study that leveraged proprietary gamma‑based tools to execute an intraday short on MicroStrategy (MSTR) on January 9. Doug Ples explains how he combined the Compass guided view, the put‑and‑call impact chart, and the real‑time...

Stocks Roll Over as Bears Gain Edge in Battle for SPX 6800
The S&P 500 index slipped below its recent highs as the market tested the 6,800‑point resistance level. Analysts on the Future of Finance panel highlighted a surge in bearish options flow, with put buying outpacing calls across key strikes. Large‑cap...

SELLOFF: Fade WW3 VIX? IL Gov Cand. Dabrowski on CFOF LIVE
The live segment of Chicago Future of Finance focused on the surge in market volatility as the VIX climbed above 28, driven by lingering geopolitical tensions and the prospect of a broader conflict. Host Oliver Rinnick introduced floor ETFs as...