
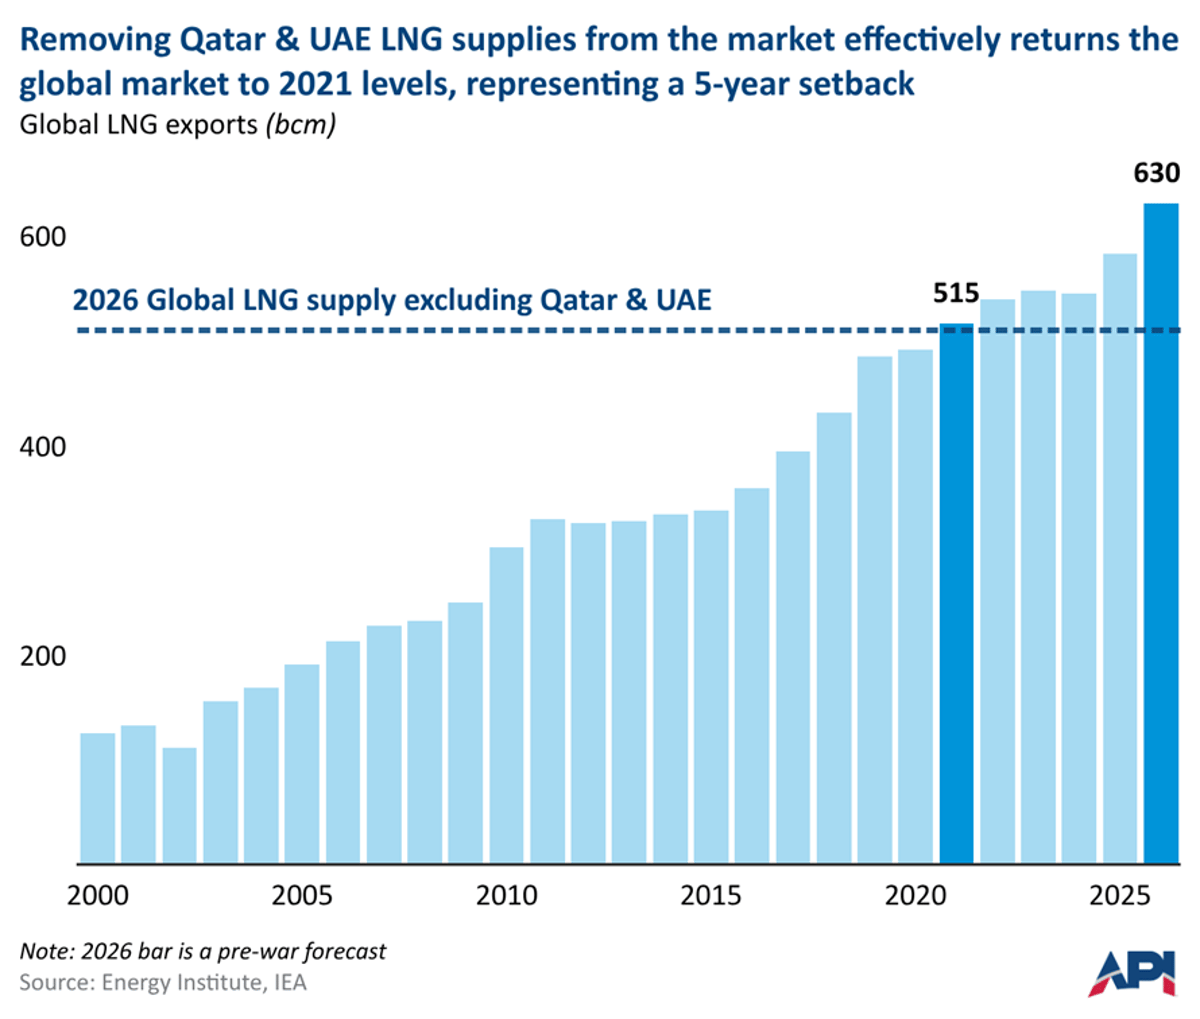
Cutting Qatar and UAE LNG Rewinds Market Five Years
Removing Qatar and UAE LNG supplies from the global market is like winding back the clock to the same supply levels as 2021, a 5-year setback. https://t.co/zj6XaND0zQ
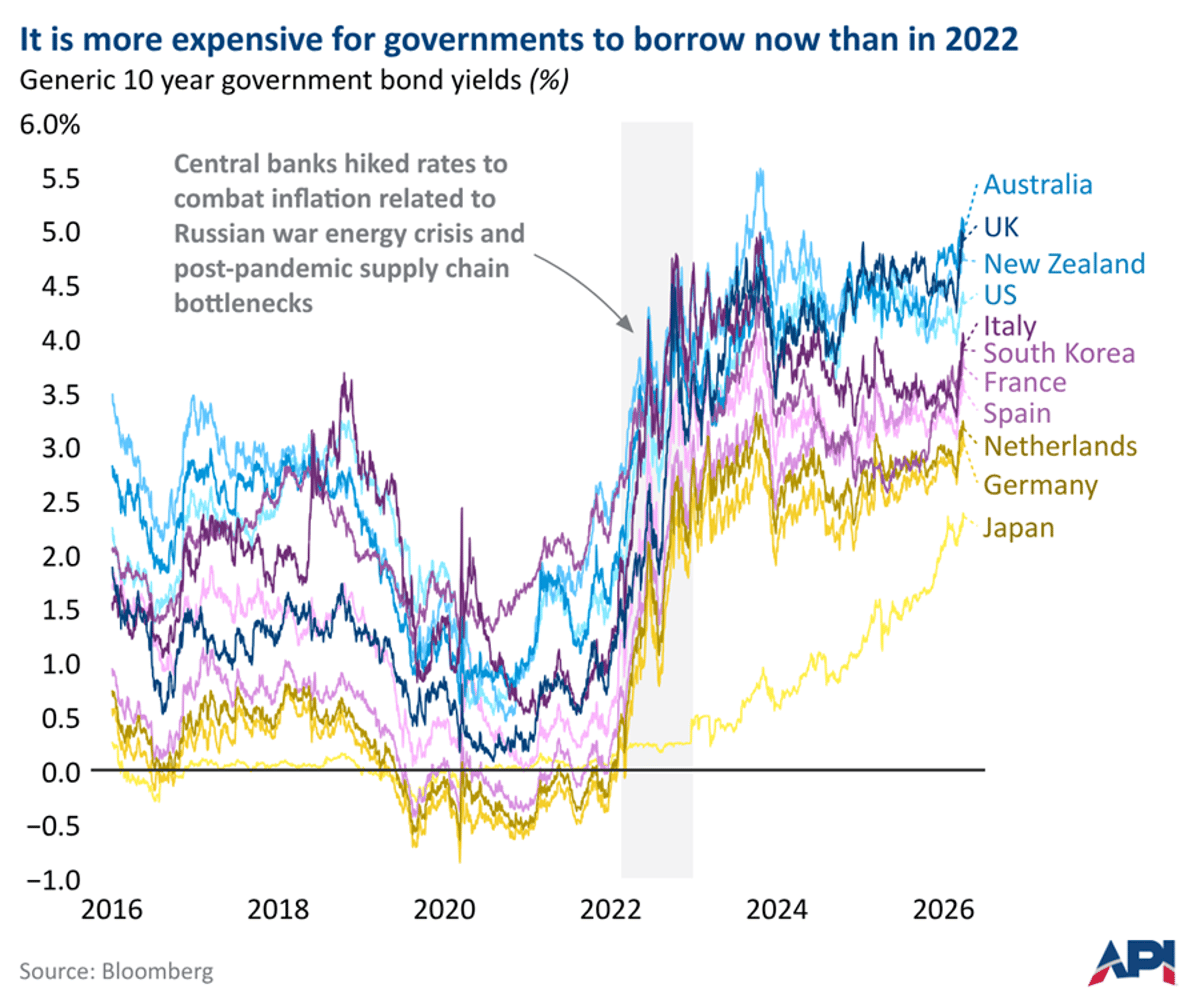
Governments Can't Borrow Their Way Out of Energy Crisis
One big and underappreciated difference between today's energy shock and the events of 2021-22 = Governments will not be able to borrow their way out of this one. Many governments borrowed heavily to fund subsidies, bailouts, and other measures to shield...

East Coast Gasoline Imports Dip; West Coast Imports Surge Early
East Coast vs. West Coast - Gasoline Imports Edition: Interesting trend developing in weekly data. The U.S. East Coast, typically the region that imports the most, has imports falling counter-seasonally. The West Coast, which has growing imports, has imports increasing...

Weekly Trade Data Noisy; Rely on Monthly Figures
Reminder: Weekly export/import data is very noisy. Not because of bad data, but more practical reasons. As weekly export data comes in, just remember to revert back to the more robust Monthly data once they are released. https://t.co/2YmazyDDYX

U.S. Petroleum Exports Hit Record, Reaching New Markets
U.S. weekly petroleum product exports surged to a record 7.9 mb/d for the week ending March 27, according to EIA. While weekly figures are volatile, multiple sources have reported U.S. product exports increasing to Asia, Africa and other areas. Trade...

Product Prices Reveal Story, Crude Oil Doesn't
What tells a clear story? Crude oil prices = No Product prices = Yes... https://t.co/Ltyf8VQx12

Dallas Fed Energy Survey: Tiny Executive Sample Reveals Key Insight
Dallas Fed Energy Survey for Q1 2026 is out. 2 Notes on this chart: - Only 34 executives responded - That second sentence in the description does all the work https://t.co/gAebgKUX4O

Airlines Brace for Jet Fuel Shortages, Not Price Spikes
Global airlines are preparing for "shortages", i.e. there simply is no jet fuel available. But they are talking about prices as a completely separate matter... Wow... https://t.co/FPxwGrm5c0

SPR Release Rate Outweighs Total Volume Impact
FLOWS before SPROS: While the announced volume of IEA coordinated SPR release is equal to a 4-week full Hormuz disruption. The SPR release RATE still means the supply losses compound over time. FYSA: Back in my days at DOE, the short-hand...

Efficiency Gains Won’t Solve Hormuz Oil Supply Crisis
I must be misunderstanding you. IF you're saying that today's Hormuz supply crisis could be, in part offset had refineries and the oil and gas industry invested more in efficiency. Which is, to be frank, laughable. So I'm assuming you're...

Brent‑WTI Spread Shifts Slowly; Short‑term Moves Are Noise
For those of you trying to figure out what's going on with the Brent-WTI spread. Let me point out an old gem that helps explain it. - Different delivery date windows - Different contract expiration dates - When things are volatile, individual...

Refinery Efficiency: Unique, Incremental Gains Over One‑Size Standards
Efficiency is considered a competitive advantage in all industries and is heavily invested in by the Oil and Gas Industry - especially in the refining and downstream sectors. Refinery engineers model and seek out incremental improvements constantly - there is...

Futures Curve Shows Prices, Not Predictions
I know I am piling on here, but a reminder to those of you just tuning into oil markets... The Futures Curve is NOT a forecast... https://t.co/gyYIbj3Xqa

U.S. Imports Heavy, Sulfur‑Rich Crude to Fit Refineries
Reminder: Not all crude oil is the same. The U.S. produces mostly lighter and less sulfurous crude oils, but imports heavier more sulfurous crude oils to better match what U.S. refineries are configured to process. https://t.co/NF6jnZrdrY

Get Real‑Time U.S. Oil & Gas Stats From API
If you are trying to get basic, up to date, statistics on the U.S. oil and gas industry - @APIenergy has you covered. Check out our "Industry Explained - Frequently Asked Data Questions" page. Interactive charts that answer regular questions...

API Energy Leaders Featured in AMPP Pipeline Report
@APIenergy 's very own Allyson Cutright and Jeff Barron are published in the latest edition of the Association for Materials Protection and Performance's U.S. Pipeline Industry Report. https://t.co/NWJzGkTyTp https://t.co/dIbQDzX74t

Scale × Duration Determines Energy Disruption Impact
“Scale x Duration” the formula you need to understand any energy supply disruption. In the case of Hormuz Scale: the scale is large, 16-20 million barrels per day of crude oil. Duration: ~10 days and counting?
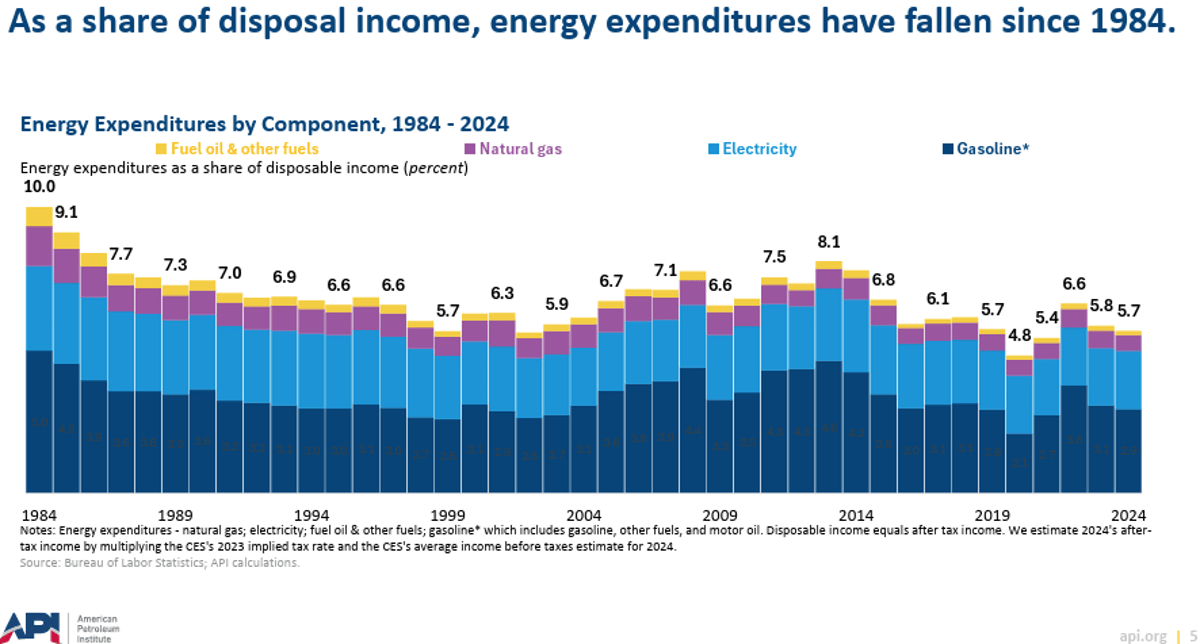
Real Energy Costs Have Declined Since 1960s
🚨New report from API 🚨: Energy & Inflation 2025 Highlights: - As a share of disposal income, energy expenditures have fallen since 1984 - In inflation adjusted terms, gasoline prices were lower in q4 2025 than in 1976 - Fuel costs have been declining...
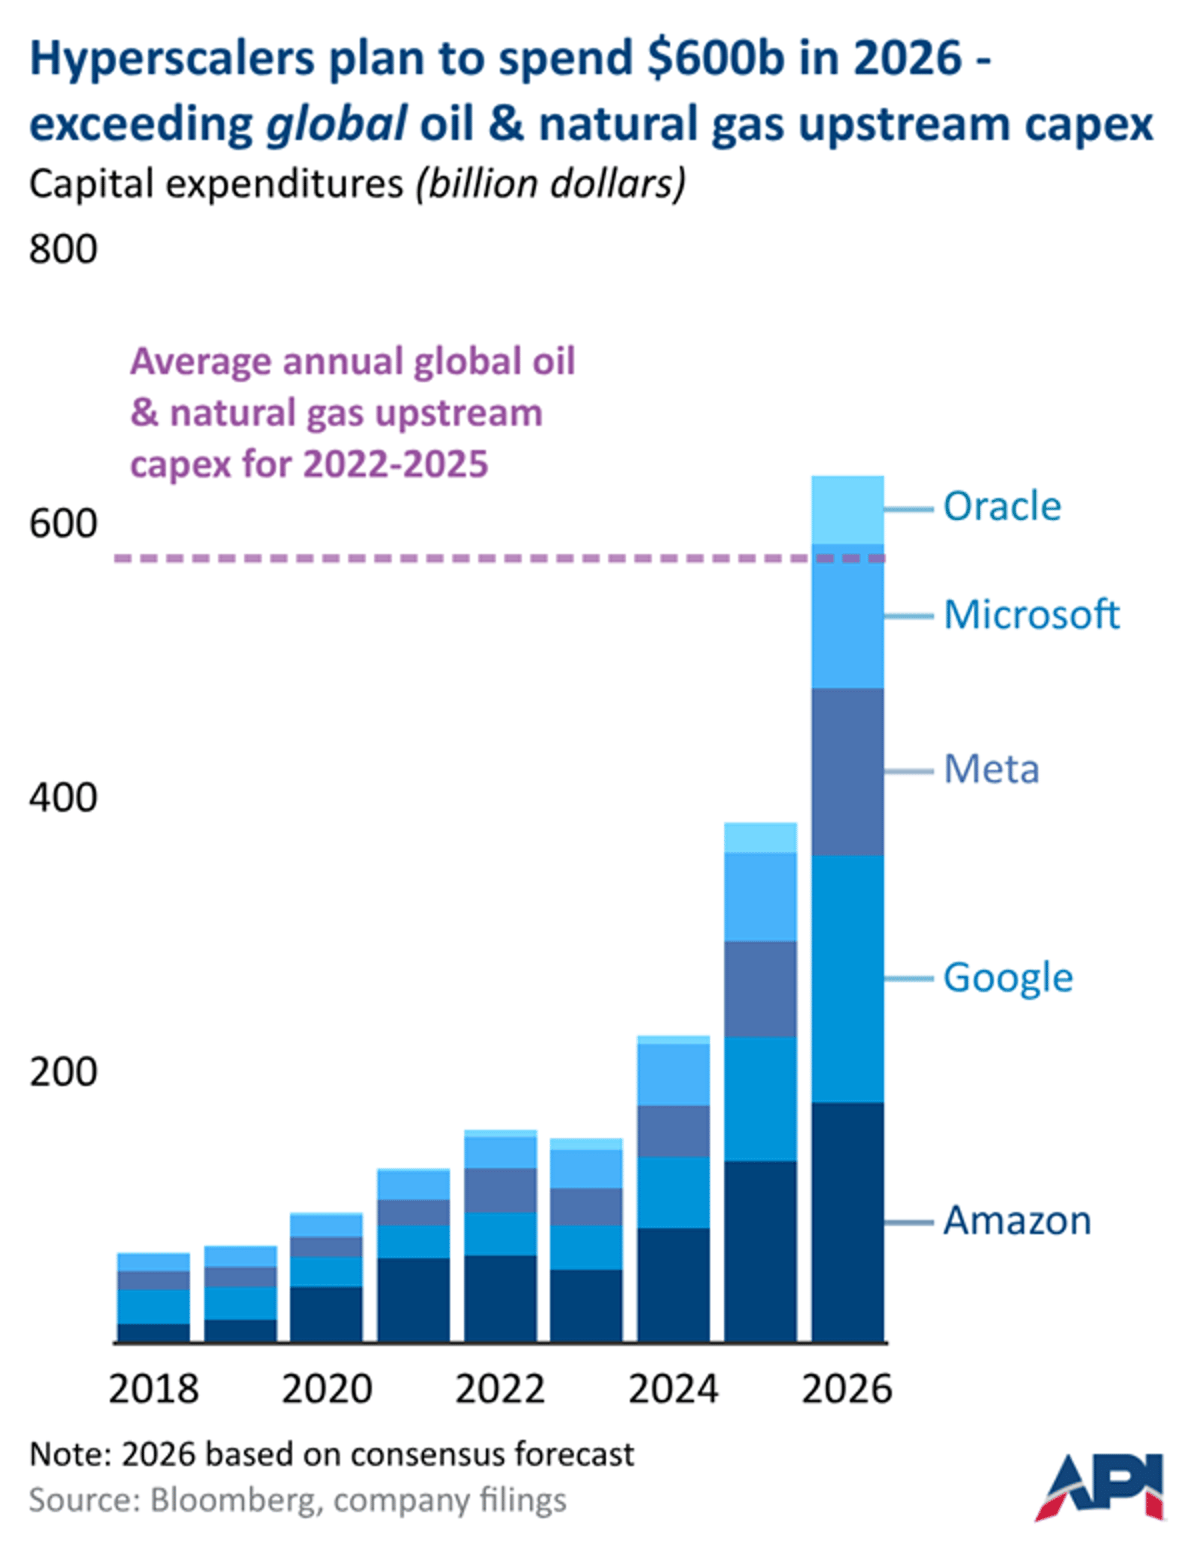
Five Tech Giants' 2026 Capex Beats Global Oil‑Gas Average
Something scary for Friday the 13th. The planned 2026 CAPEX budgets for just 5 big tech firms in 2026 is larger than the average GLOBAL oil & gas capex between 2022-2025. 🤯🤯🤯🤯 https://t.co/WfwKC00YCY

Gas Storage Boosts Reliability when Pipelines Fall Short
Natural gas storage is part of the reliability and resilience story too. When there’s insufficient long-distance pipeline capacity, access to storage is your next best bet. This is part of the solution too.🧵 https://t.co/o35G4ig5HU
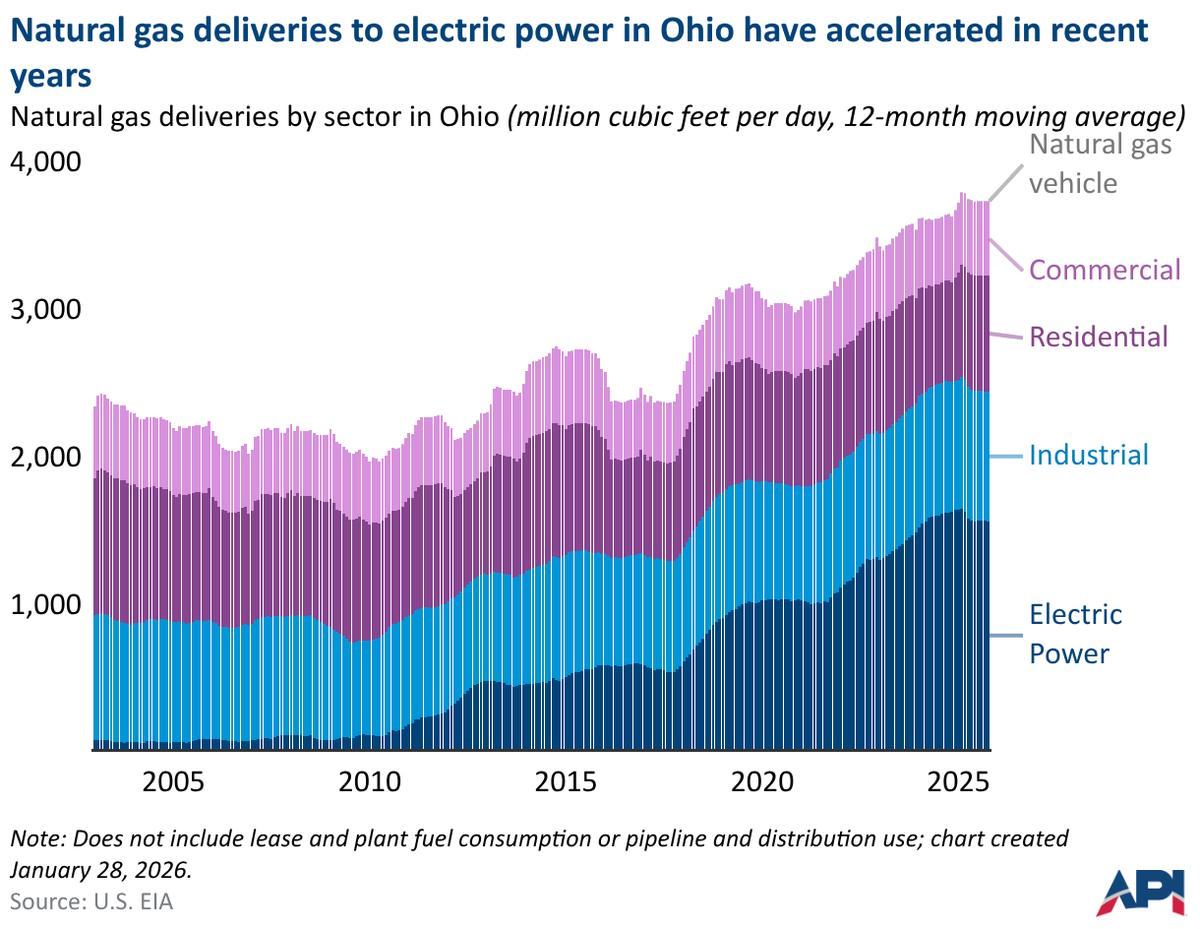
Ohio’s Data Centers Tighten Natural Gas Balance
The data center driven surge in Ohio's electricity consumption has contributed to tighter natural gas balances. For the 12-months ending in October, 2025, Ohio's natural gas consumption was 3.7 bcf/d, near an all-time high, driven largely by demand in the...
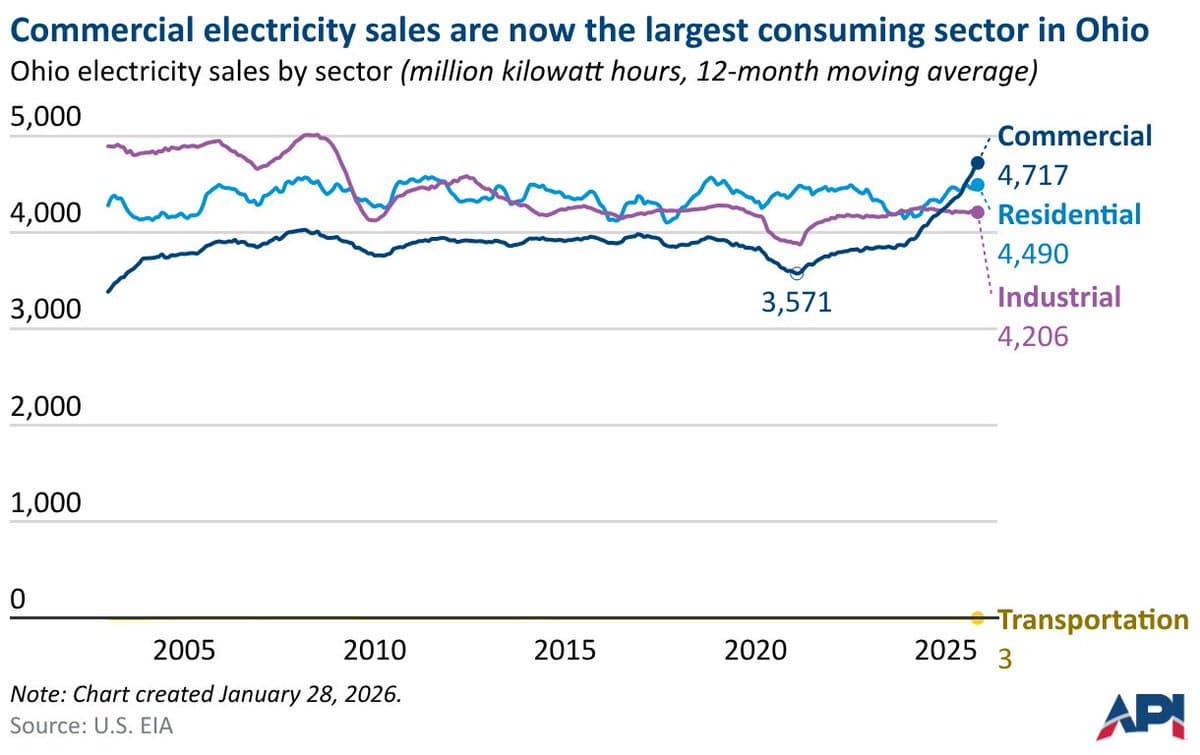
Ohio’s Commercial Power Use Overtakes Residential, Fueled by Data Centers
The commercial sector is now the largest electricity consumer in Ohio, driven by data center expansions. Commercial electricity sales surpassed residential sales for the first time on a twelve-month moving average basis in August 2025 and now account for 35%...
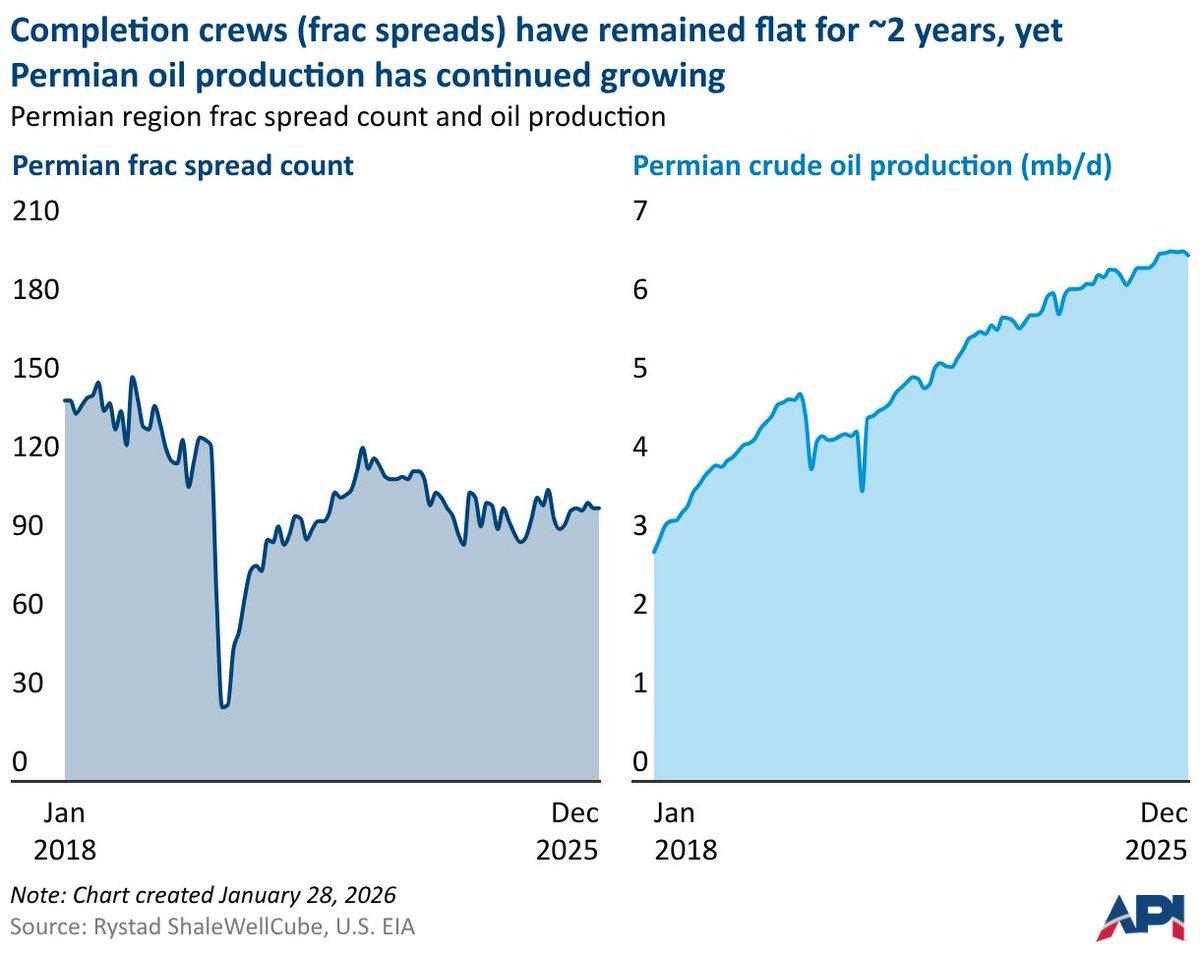
Permian Wells Surge 13% as Crews Work Smarter
The frac spread count measures the number of completion crews actively fracturing a well. In the Permian, the frac spread count averaged ~100 crews in 2025, 3% higher than the 2024 average. Yet operators completed a total of ~6,800 wells,...
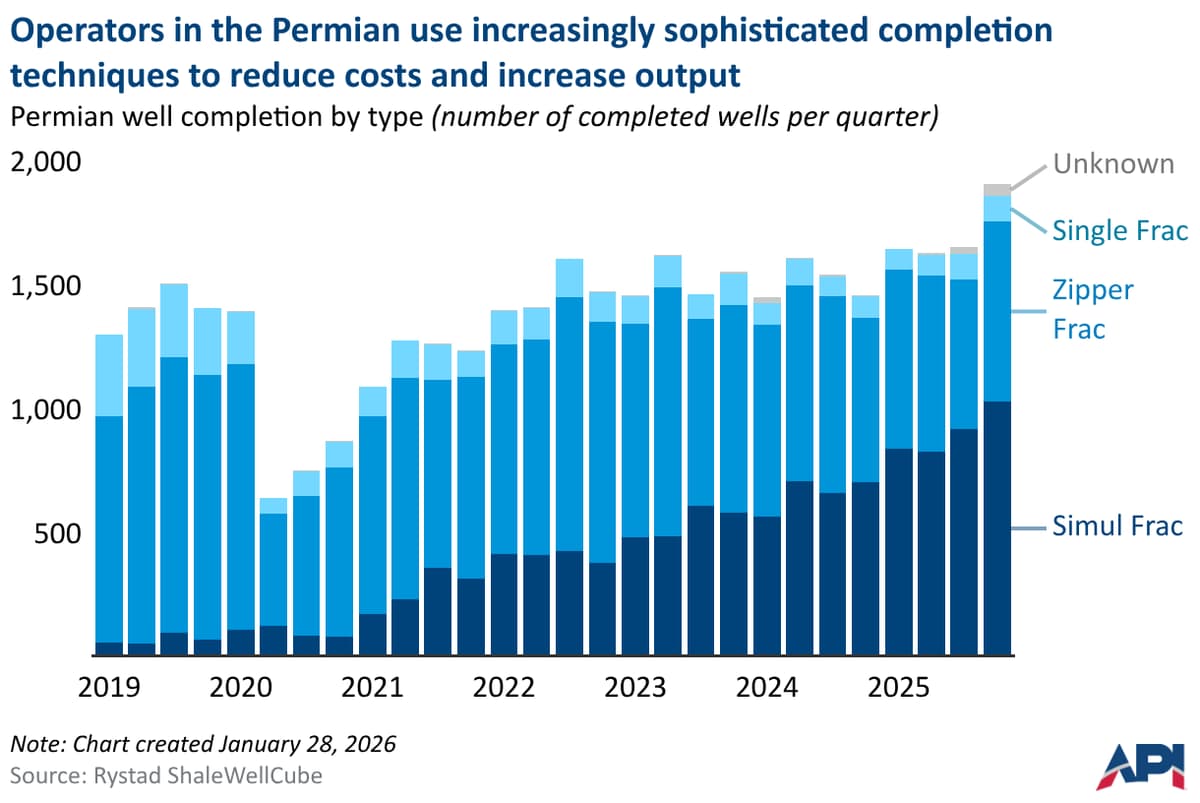
Permian Operators Complete 3,600 Wells via Simul Frac
U.S. operators in the Permian region of Texas and New Mexico completed ~3,600 wells in 2025 using simultaneous hydraulic fracturing (simul frac), a technique that minimizes completion crew time on well pad sites by completing two wells simultaneously. https://t.co/FxdE8jlBs7 Well completion occurs...