

Dow Near ATH Resistance, Bullish EMAs Hint Uptrend
#DOW doji Candle and Sideways. Resistance ATH 50513. Support 48708, 48000, 46978. RSI 58 not high. 13/21 day EMAs Bullish. Top Bollinger Band 50078. Midpoint Line 49682. Bottom Band 49293.

Brent Oil Eyes Resistance Near $115 Amid Bullish Signals
#BrentOil Comp Doji Candle but drifting up. Resistance $114.7. Support $100, $96.1, $86.1. RSI 59 not high. 13/21 day EMAs Bullish. Top Bollinger Band $112.2. Midpoint Line $105.8. Bottom Band $99.6.

FDA Greenlights Enhertu for Early HER2‑positive Breast Cancer
#AZN Enhertu approved by US FDA both before and after surgery for treating patients with HER2-positive early breast cancer.

PRN Looks Cheap, but No Dividend; Skip It
#PRN decent Update with margins improving. Net Cash £344m (up). ShareScope has fwd p/e 10.8 falling to 10.3; strip cash out looks really cheap. No Dividend with focus on M&A. I don't hold.

FTSE250 Shows Strong Down Candle Amid Sideways Trend
#FTSE250 big Down Candle but in Sideways move. Support 22087, 21492, 21000. Resistance 23000, 23231. RSI 52.5 bit off Neutral. 13/21 day EMAs Bullish. Top Bollinger Band 23035. Midpoint Line 22585. Bottom Band 22135.

DAX Doji Near 50
#DAX doji Candle just above 50 day MA Line 23757. Support 23482, 23000. Resistance 24513, 25152. RSI 50 Neutral. 13/21 day EMAs Bullish. Top Bollinger Band 24904. Midpoint Line 24272. Bottom Band 23664.

RST Meets Expectations, Valuation Improves, but Still Not Owned
#RST "in line with expectations". Looks like recovery ongoing under previous CEO. ShareScope has fwd p/e 10.3 falling to 9.2 and fwd Divvy 2.9% rising to 3.3%; not expensive. I don't hold.

OTB Rebounds 16% as Guidance Reinstated Amid Strong Bookings
#OTB hit 16% with revenue subdued due to Middle East drama. However, after previously withdrawing FY guidance, they have now reiterated it. Booking volumes are strong and lots of strategic improvements in the business, including AI getting embedded.

FTSE Small‑Cap Stalls Near Resistance, Bullish EMAs Hold
#FTSEsmallcap doji Candle and Sideways. Resistance 7937, 8042. Support 7604, 7321, 7283. RSI 62.5 not high. 13/21 day EMAs Bullish. Top Bollinger Band 7841. Midpoint Line 7708. Bottom Band 7572.

AIM Shows Modest Rise; Watch 837 Resistance
#AIM All Share small Up Candle. Resistance 837. Support 800, 785, 741, 726. RSI 66.5 getting high but not Overbought. Top Bollinger Band 827. Midpoint Line 803. Bottom Band 778.

FTSE100 Stagnates Near 10,500 Resistance, Bearish Trend
#FTSE100 doji Candle and Sideways 8 days. Resistance 10500, 10683, ATH 10935. Support 10185, 10000, 9670. RSI 44 bit off Neutral. 13/21 day EMAs Bearish. Top Bollinger Band 10446. Midpoint Line 10304. Bottom Band 10160.

Br
#BrentOil Comp Doji Candle and been in z Sideways Range 6 weeks ish. Resistance $115.1. Support $100, $96.1, $86.1. RSI 56 near Neutral. 13/21 day EMAs Bullish. Top Bollinger Band $116. Midpoint Line $107.1. Bottom Band $98.

RNWH's PWR-X Acquisition Boosts Dividend, Lowers P/E
#RNWH bought PWR-X Ltd for £1.1m, which does "specialist cable jointing services". ShareScope showing fwd p/e 12.9 falling to 12 and fwd Divvy 2.3% rising to 2.4%; decent Uptrend and worth looking at. I don't hold.

GRI Secures £540m Facility Extension, Saves £1m Annually
#GRI got an extension on £540m of "core banking facilities" to 2033 and at a lower cost, saving £1m per year in finance costs.

UTG Boosts Buyback to £165m Using Property Sale
#UTG incresed Buyback programme to £165m from previous £100m. Increase really possible due to proceeds from selling St Pancras Way property.
Relying on One Man for Off‑Balance Defence Debt
That may well be the case, but he's the ideal man for off-balance sheet debt funding for Defence. What could possibly go wrong?

S&P 500 Hits New ATH Amid Overbought Momentum
#SP500 small Up Candle and New ATH 7401. Support 7174, 7046, 6790. RSI 73.5 Overbought but not silly. Up Candle on Weekly. Top Bollinger Band 7428. Midpoint Line 7244. Bottom Band 7066.

Dow Near All‑Time High, Doji Signals Cautious Bullishness
#DOW doji Candle up near ATH 50512. Support 48708, 48000, 46978. RSI 61 not high. 13/21 day EMAs Bullish. Doji on Weekly and Sideways. Top Bollinger Band 50014. Midpoint Line 49367. Bottom Band 48725.
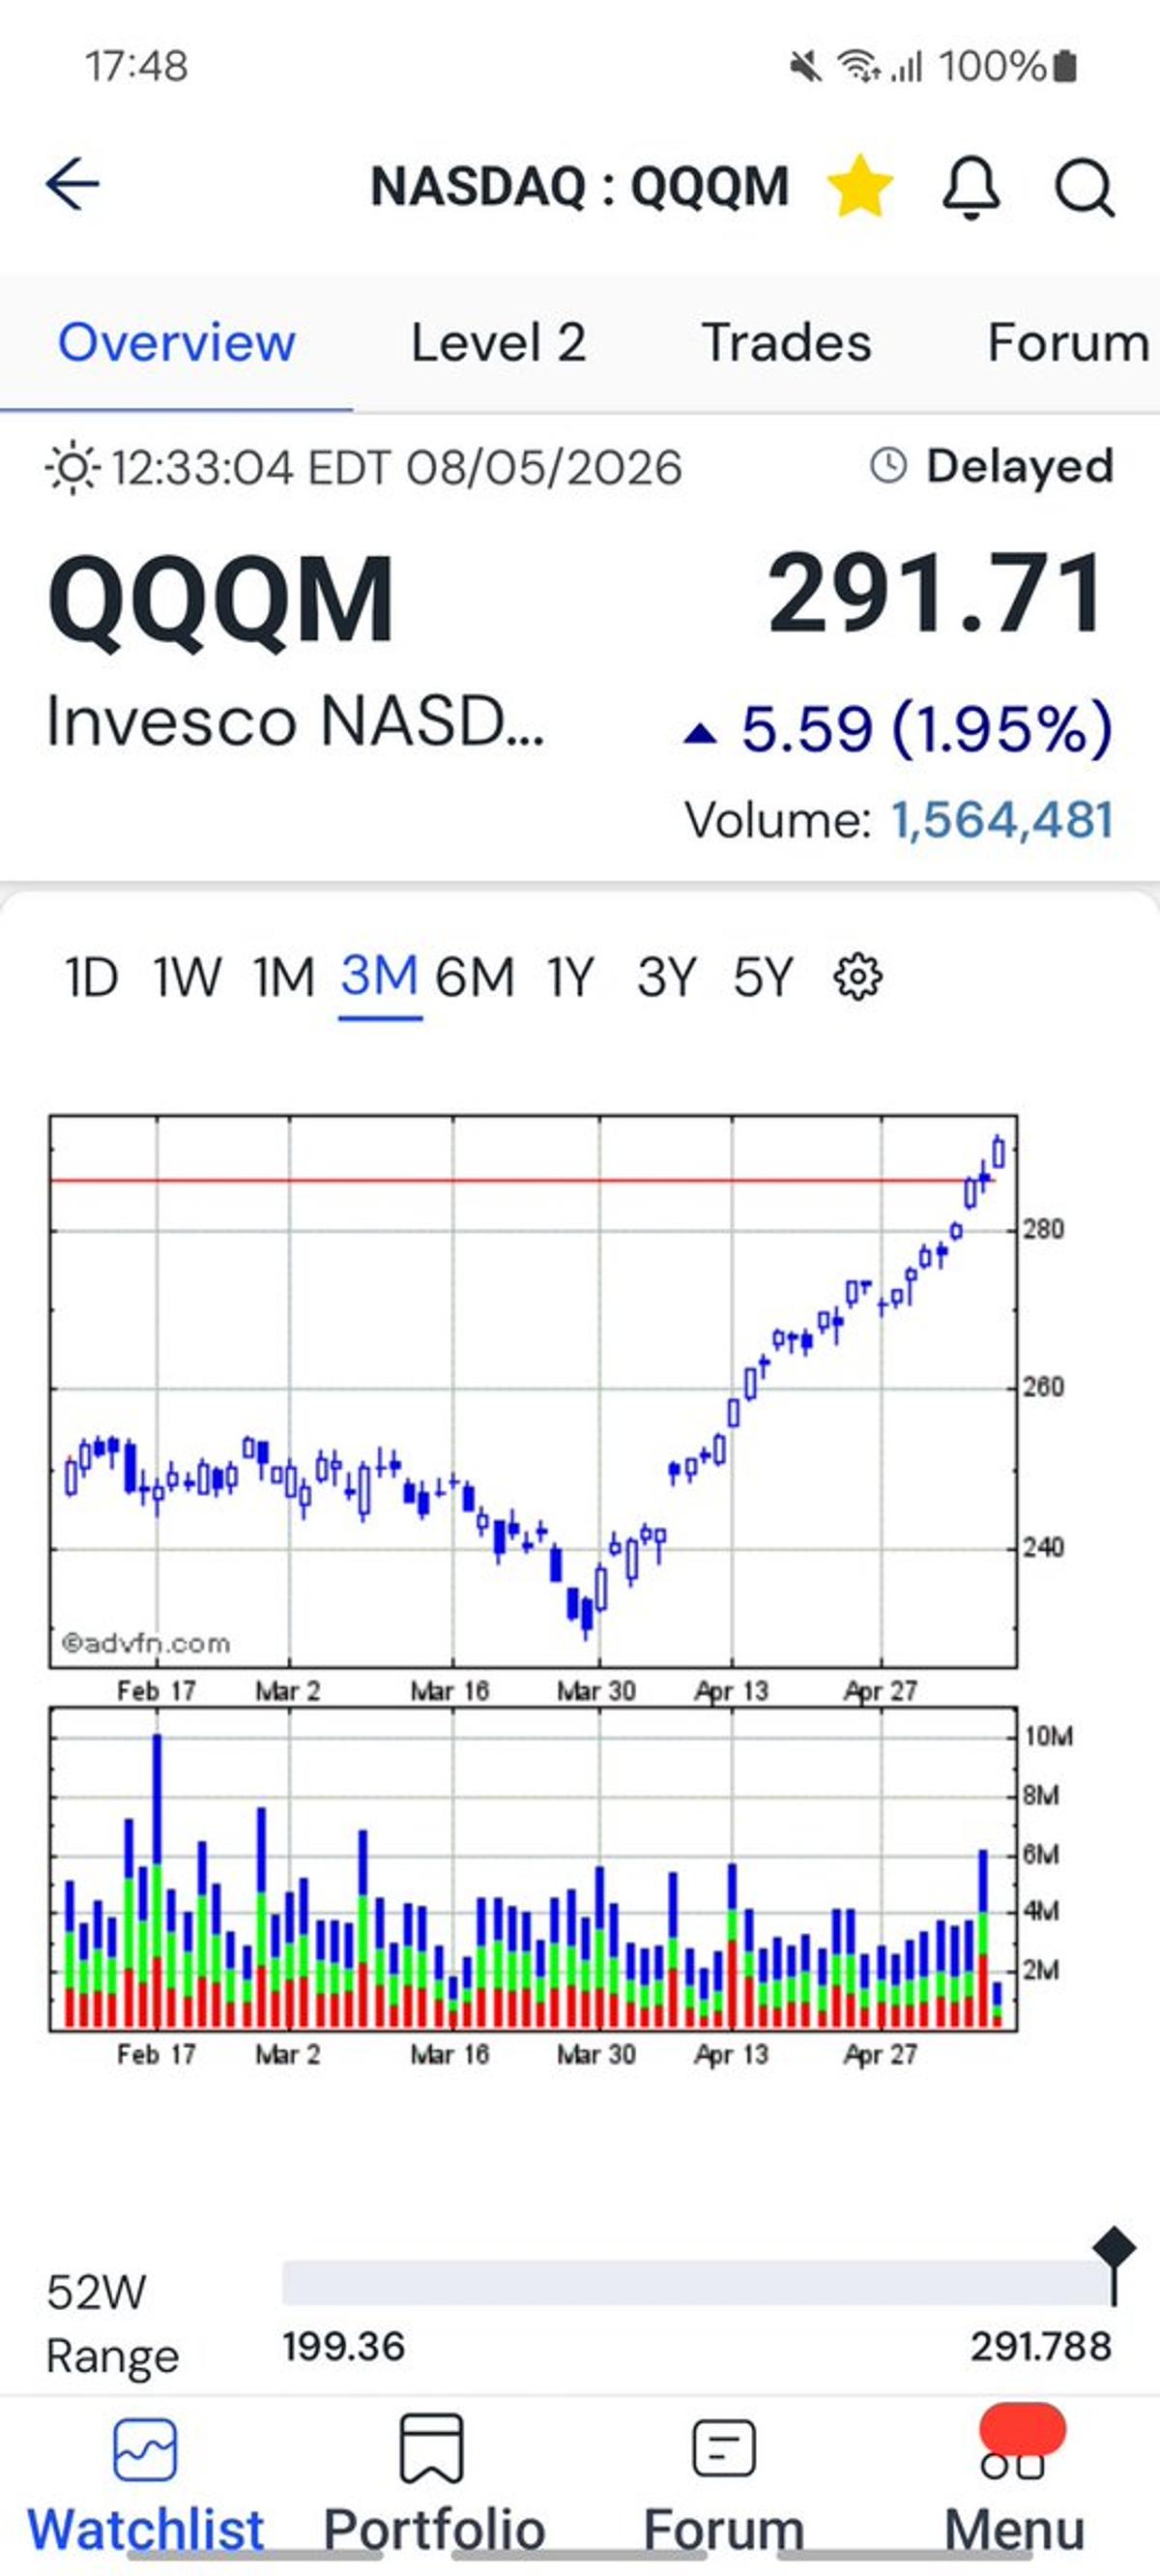
Nasdaq's Rally Overbought; Consolidation Likely Ahead
The #Nasdaq Comp has had an incredible run up. The Daily RSI must be quite Overbought now, so some Consolidation is needed: https://t.co/4MNQzoSEwO
RMV Holds Guidance Amid AI Fears, Dividend Rises
#RMV "in line" and reiterates FY guidance. ShareScope has fwd p/e 14 falling to 12.7 and fwd Divvy 2.7% rising to 2.9%; I guess this has been mainly hit by AI fears but it remains the portal of choice for...

JNEO Lands $1.2M MBTA Order, yet Remains Undervalued
#JNEO won a $1.2m Purchase Order for the Massachusetts Bay Transportation Authority in Boston. ShareScope only showing fwd p/e 12.7; strip out cash and it's quite a low rating. I don't hold.

Landlords Must Send Tenant Info Sheet by May 31
*** LANDLORDS TAKE NOTE *** As I understand it following from the Renters' Rights Act you have until 31st May to send an 'Information Sheet' to your Tenants. Details at https://t.co/8JMkohGH87

CNA Acquires Severn Gas Plant for £370M,
#CNA bought the Severn Combined-Cycle Gas Turbine power station for £370m. Built in 2010 and expected to deliver annual EBITDA of £30 - £60 million from 2027, and accretive to EPS from first FY after completion.

Shell Prioritizes Higher Dividends Over Buybacks
Interesting #SHEL has changed emphasis regarding Shareholder Returns with more Dividend and a bit less Buyback. Makes sense after the decent Share Price rises. ShareScope showing fwd Dividend Yield 3.4% rising to 3.6% (and Buybacks on top).

BA's Val
#BA. Good start to 2026 and reiterates Guidance. ShareScope has fwd p/e 25.2 falling to 22.2 and fwd Divvy 1.9% rising to 2.1% (plus a tiny Buyback); not 'cheap' but Defence is obviously a warm area.

Watch the Pound; Its Drop Signals Game Over
The thing to watch is the £ When that starts dropping significantly, the game is up.

RFX Profit Upgrade Lifts P/E, Cuts Dividend Yield
#RFX upgraded FY profit guidance. ShareScope showing fwd p/e 7.2 RISING to 10.2 and fwd Divvy 6% FALLING to 4.2% BEFORE 9% jump today. Highly dependent on Gold Price. I don't hold.

RSW Turns Around: Lower P/E, Higher Dividend
Good Update from #RSW and they seem to have really turned the business around. ShareScope showing fwd p/e 29.9 falling to 27.1 and fwd Divvy 1.7% rising to 1.9%; that's a high rating so it will need to keep delivering...
HSW Looks Cheap if Iran Hit Avoided, Risks Remain
#HSW AGM Update says no material impact on revenue from Iran conflict but does say Europe offsetting softer Asia. ShareScope showing fwd p/e 8.8 falling to 7.1 and fwd Divvy 2.9% rising to 3.9%. If they escape a hit from...

FTSE250 Stagnates with Doji, Bullish EMAs Hint Upward
#FTSE250 doji Candle and Sideways. Support 22134, 21557, 21000. Resistance 23000, 23231, 23844. RSI 51 Neutral. 13/21 day EMAs Bullish. Top Bollinger Band 23054. Midpoint Line 22594. Bottom Band 22117.

DAX Nears Breakout After Two Weeks Sideways
#DAX Up Candle but pretty much Sideways 2 weeks. Needs Breakout 24792. Support 23715, 23482, 23000. RSI 54 bit off Neutral. 13/21 day EMAs Bullish. Top Bollinger Band 24422. Midpoint Line 24148. Bottom Band 23865.

RBN Raises £730k, Cuts Debt; Low Cap, Illiquid
#RBN selling a property and getting £730,000 to help lower debt. ShareScope has fwd p/e 10.2 falling to 8.2 and fwd Divvy 4.8% each of next 2 years. It's low Mkt Cap at £21m and illiquid. I don't hold.

Vodafone Buys Remaining 49% For
#VOD paying CK Hutchison £4.3bn to acquire the 49% of VodafoneThree it didn't already own, and to now have 100% ownership. Will increase debt by 0.4 times Net Debt to Adjusted Earnings.

FTSE Small‑Cap Near Resistance, Bullish EMA Signals
#FTSEsmallcap small Up Candle, arguably a doji. Resistance 7815, 8041. Support 7604, 7519, 7283. On verge MACD Bear Cross but may skim off. RSI 55 bit off Neutral. 13/21 day EMAs Bullish. Doji on Weekly and Sideways. Up Candle on...

AIM Shares Stuck Sideways Amid Mixed Signals
#AIM All Share Doji Candle and Sideways. Resistance 813, 837. Support 785, 763, 741, 726. On verge MACD Bear Cross (but may skim off). RSI 58 not high. 13/21 day EMAs Bullish. Doji on Weekly and Sideways. Big up Candle...

Nasdaq Hits New ATH, Bullish Momentum Persists
#Nasdaq Comp small Up Candle, arguably a doji and New ATH 25223; Bullish behaviour. Support 24199, 23331, 22529. RSI 71 Overbought but can go higher. Doji on Weekly. Big Up Candle on monthly.

Brent Oil Holds Near Support, Bullish EMA Trend Persists
#BrentOil Comp small Down Candle, arguably a doji and Sideways. Resistance $114.7, $124.5, $133.1. Support $100, $86.1. RSI 62 not high. 13/21 day EMAs Bullish. Up Candle on Weekly. Small Up Candle on monthly but well off the Low.

PSON Shows Improving Valuation and Dividend Despite AI Risks
#PSON been in a pretty rough state for years, but recent updates do seem more promising, despite AI potential to disrupt. SharePad has fwd p/e 15.6 falling to 13.9 and fwd Divvy 2.5% rising to 2.7%. I don't hold.

MONY Appears Cheap: Lower P/E, Higher Dividend
#MONY Update reads OK and no evidence of AI causing problems. ShareScope has fwd p/e 9.5 falling to 8.9 and fwd Divvy 7.5% rising to 7.7% and Buybacks on top. Could be cheap really. I don't hold.

RNWH's Edwards Dive Deal Boosts Earnings, Slightly Better Valuation
#RNWH buying Edwards Diving Services and says "will be immediately earnings enhancing". ShareScope has fwd p/e 12.5 falling to 11.7 and fwd Divvy 2.4% rising to 2.5%; no steal but reasonable. I don't hold.

GLEN Margins Set to Expand as Metal Prices Rise
#GLEN says production pretty much in line but suggesting rises in metals prices could widen margins, despite higher input costs. ShareScope has fwd p/e 13.4 RISING to 13.5 and fwd Divvy 2.6% each of next 2 years; very difficult to...

FTSE100 Bears Target 9,670 Support Amid Neutral RSI
#FTSE100 Down Candle. Support 10000, 9670, 9423. Resistance 10500, 10687, ATH 10935. RSI 44 bit off Neutral. Doing 13/21 day EMA Bear Cross. Top Bollinger Band 10728. Midpoint Line 10452. Bottom Band 10180.

S&P 500 Stalls Near 7,180 Resistance, Sideways Trend
#SP500 doji Candle and Sideways. Resistance ATH 7178. Support 7000, 6740, 6500. RSI 65 not high. Top Bollinger Band 7196. Midpoint Line 7118. Bottom Band 7040.
Dow Faces Bearish Cross Near Key Support Levels
#DOW small Down Candle. Support 48192, 47506, 46978. Resistance 49848, ATH 50512. Near MACD Bear Cross. RSI 58.5 not high. 13/21 day EMAs Bullish. Top Bollinger Band 49720. Midpoint Line 49160. Bottom Band 48662.

Soft Results, yet Cash Rises and Dividend Increases
#W7L results a bit soft. Net Cash £17.3m (up). Increased Dividend to 13p for the year (7.4% on 175p). Brand Architekts integration appears to be going well. Products into new Retailers in many countries. Signs of recovery in April...
Assura Integration on Track, Dividend Yield Near 8%
#PHP AGM Update reads fine; doesn't seem long since the last update. Assura integration ahead of schedule. ShareScope showing fwd Dividend Yield 7.8% rising to 8%; still a big Yield on a very stable business.

ShareScope's Falling P/E and Rising Dividend Signal Potential
#CBOX decent Update. Ambala integration seems to be going OK. ShareScope has fwd p/e 13.3 falling to 11.5 and fwd Divvy 5.7% rising to 6.2%; nice payout and growth potential. I don't hold.

ELCO Beats Forecasts, Valuation Improves, Yet Un
#ELCO Revenue, Adj PBT, Cash "ahead of expectations". Net Cash £16.3m (up). ShareScope has fwd p/e 21.8 falling to 17.5 and fwd Divvy 0.9% rising to 1%, BEFORE news today, 5% rise, and strip out cash. Interesting. I don't hold.
AstraZeneca's Bretzi Inhaler Cleared for Asthma in Teens
#AZN Bretzi inhaler approved by US FDA for treating patients 12 years old and upwards for Asthma, following the KALOS and LOGOS Phase III trials. Previously got COPD approval.

Guidance Dip Amid Competition, yet Growth Persists
#TEP reason for lower end of guidance a mixture of competitive Energy and Broadband markets, Insurance slow to recover, higher churn. On flipside, decent customer growth, decent partner growth and looking at ways to boost earnings per customer.