Where Is Money Flowing Today?
Key Takeaways
- •Tech sector leads with strongest intraday gains
- •Consumer discretionary stocks post solid price appreciation
- •Energy and utilities underperform across the board
- •Small‑cap stocks face broad selling pressure
- •Growth‑oriented mega‑caps attract most buying interest
Pulse Analysis
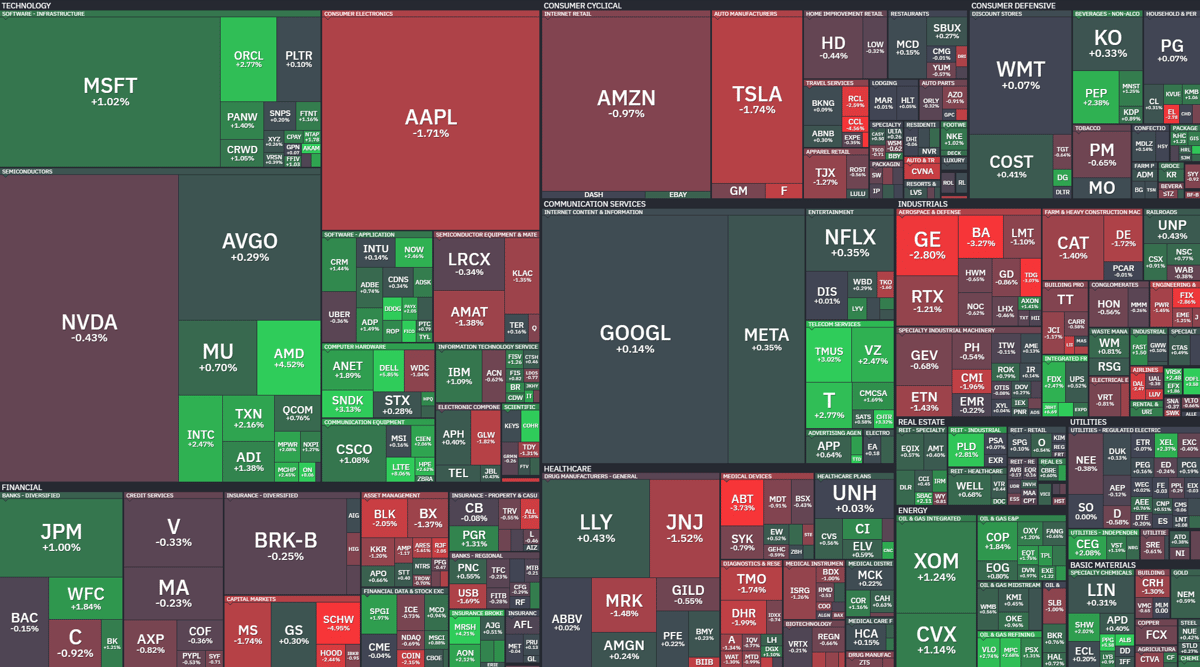
Tracking intraday money flow has become a cornerstone of modern portfolio management. Platforms like Finviz aggregate real‑time volume and price data into heatmaps that instantly reveal which sectors are attracting capital. By visualizing buying pressure, investors can spot emerging trends before they become evident in traditional metrics, allowing for more agile positioning in a fast‑moving market.
Today's heatmap tells a clear story: technology and consumer discretionary stocks dominate the upside, buoyed by strong earnings forecasts and resilient consumer demand. Mega‑caps such as Apple, Microsoft and Amazon are posting double‑digit gains, while energy, utilities and many small‑cap names are experiencing notable declines. This divergence reflects a broader rotation from defensive, commodity‑linked assets toward growth‑oriented equities as investors chase higher returns amid lingering inflation concerns.
For market participants, the implications are twofold. First, allocating more exposure to the leading sectors can enhance short‑term performance, but it also raises concentration risk that must be managed through diversification or hedging. Second, the persistent weakness in energy and utilities may present opportunistic entry points for contrarian investors with a longer horizon. Ultimately, staying attuned to money‑flow signals equips traders and fund managers with a tactical edge, helping them navigate volatility while capitalizing on sector momentum.
Where is money flowing today?
Comments
Want to join the conversation?