
New Ways to Agentically Build and Edit Dashboards
Sentry has launched a beta feature that lets users create and edit dashboards through an AI‑powered agent chat, replacing the older Insights pages with fully customizable, clonable dashboards. The new capability is free for organizations with AI features enabled and integrates with the Sentry CLI, allowing dashboard management from the terminal. Dashboards now include revision history, enabling easy rollback of changes. These tools aim to cut the time needed to build observability views from hours to seconds.

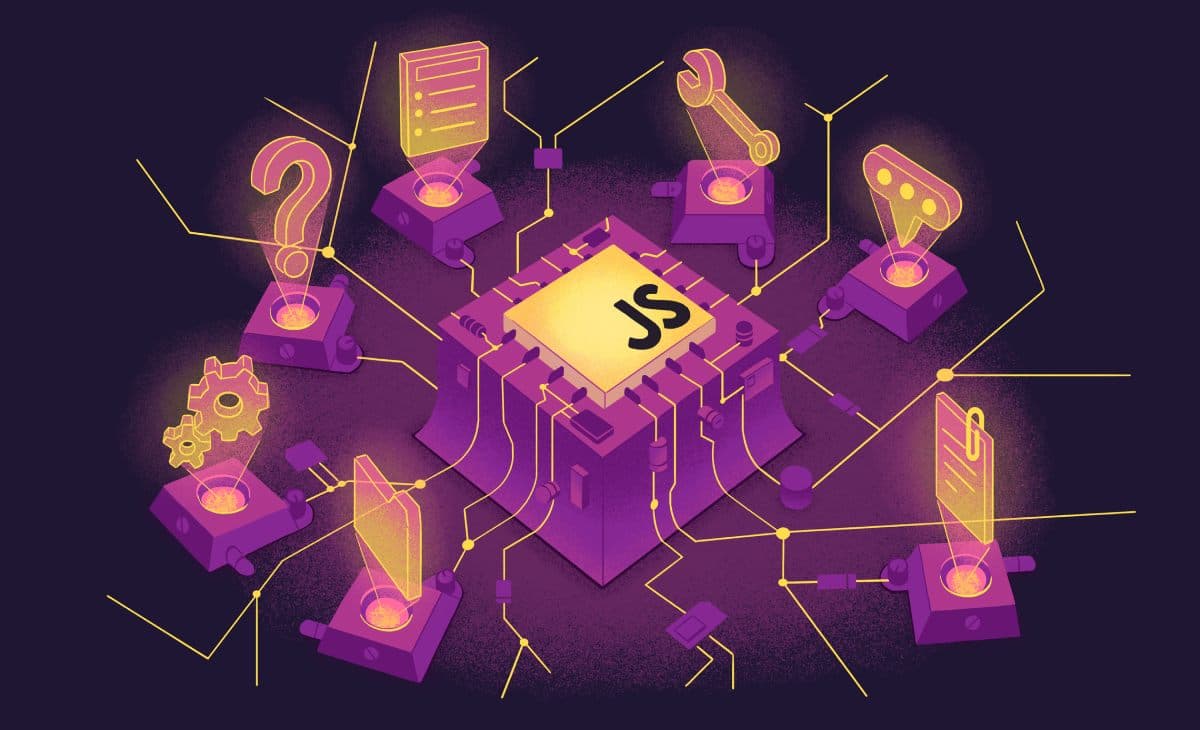
Fixing JavaScript Observability, One Library at a Time
Over the past weeks Sentry has led a cross‑ecosystem push to replace fragile monkey‑patching in JavaScript APM tools with Node’s built‑in TracingChannel API. By having libraries publish structured events on tracing channels, APMs can subscribe without import‑in‑the‑middle hacks, eliminating ESM...

Improved Debugging for Expo Apps with the React Native SDK
Expo apps generate roughly 75% of the React Native events Sentry receives, prompting the company to upgrade its React Native SDK for better debugging and performance monitoring. The new release automatically enriches every event with OTA update metadata, tags emergency...

Introducing Application Metrics: Track the Signal, See the Spike, Jump to the Trace
Sentry has launched Application Metrics, a feature that records full‑event data—including high‑cardinality attributes like user ID, region, and project—directly from the SDK. Unlike traditional infrastructure metrics that aggregate away context, these events stay linked to trace IDs, letting engineers jump...
Two Commands to Sentry: Now on Stripe Projects
Stripe has integrated Sentry as a service within its new Stripe Projects CLI, allowing developers to provision a fully configured Sentry project with just two commands. The workflow eliminates signup, DSN copy‑pasting, and separate billing by routing all charges through...
Sentry's Integration with Perforce Is Now Generally Available
Sentry announced that its Perforce P4 integration is now generally available for all organizations. The new connector links Sentry directly to Perforce depots, enabling stack‑trace linking, commit tracking, suspect‑commit detection and suggested assignees. It also adds on‑demand source‑context, pulling code...

Introducing Seer Agent: The Answer Is Already in Sentry. Now You Can Ask for It.
Sentry has launched Seer Agent, an AI‑driven debugging assistant now in open beta. The tool lets engineers describe symptoms and automatically traverses Sentry’s trace‑connected telemetry to pinpoint root causes, as demonstrated when it identified a region‑specific rate‑limit outage in minutes....

Two Years without Cookies on the Site, Here's Where We Ended Up
Two years after stripping all advertising cookies, Sentry re‑engineered its growth engine around brand awareness, allocating roughly 70% of its budget to channels that build visibility rather than direct response. The company invested in high‑impact placements such as a multi‑year...
No More Monkey-Patching: Better Observability with Tracing Channels
Node.js is introducing Diagnostics and Tracing Channels to let libraries emit their own telemetry, eliminating the need for external monkey‑patching. Traditional APM instrumentation relies on fragile runtime patches that break with ES Modules, forcing developers to use complex import hooks....

Debugging Multi-Agent AI: When the Failure Is in the Space Between Agents
A developer built a three‑agent research system—Advocate, Skeptic, and Synthesizer—to debate technical decisions. The Synthesizer’s analyses became biased because the Skeptic’s web‑search tool returned weak, single‑result data, while the Advocate produced richly cited briefs. The imbalance caused the Synthesizer to...

Grave Improvements: Native Crash Postmortems via Android Tombstones
Sentry’s Android SDK version 8.30.0 now reads native crash tombstones via the ApplicationExitInfo API on Android 12 and newer. By pulling the platform‑generated debuggerd output, the SDK delivers full‑thread stack traces, Java/Kotlin frame symbolication, and register context without bundling the libunwindstack fork....

AI Agent Observability: The Developer's Guide to Agent Monitoring
AI agents require observability that goes beyond traditional APM metrics, capturing every LLM call, tool execution, and sub‑agent handoff. The OpenTelemetry `gen_ai` semantic conventions provide a standardized span model—`gen_ai.request`, `gen_ai.invoke_agent`, and `gen_ai.execute_tool`—enabling structured tracing and unified dashboards. Sentry’s auto‑instrumentation supports...

Send Your Existing OpenTelemetry Traces to Sentry
Sentry has launched an open‑beta OTLP endpoint that lets you forward existing OpenTelemetry traces to Sentry with just two environment variables, eliminating the need to rewrite instrumentation. The guide walks through configuring a Node.js Express service, generating a trace, and...

Next.js Observability Gaps and How to Close Them
Next.js offers powerful server‑side rendering, file‑based routing, and edge runtimes, but its three‑runtime architecture creates blind spots in production monitoring. Errors from server actions are stripped of detail, hydration mismatches surface with cryptic messages, and ORM database calls remain invisible...

Seer Fixes Seer: How Seer Pointed Us Toward a Bug and Helped Fix an Outage
On February 21, 2026 Sentry’s AI‑powered Seer service suffered an 80‑90% failure rate in its EU Issue Summary API after a Google Cloud Vertex AI Gemini outage triggered a bug in Seer’s region‑fallback logic. The bug blocklisted the provisioned‑throughput region europe‑west1,...