Monitor Databricks with Grafana Cloud for Instant Visibility Into Your Workloads
Why It Matters
It gives enterprises instant visibility into cost and performance, enabling faster issue detection and more disciplined spend management across data workloads.
Key Takeaways
- •Grafana Cloud adds native Databricks integration with prebuilt dashboards.
- •FinOps, SRE, and analytics teams get tailored cost, reliability, and query metrics.
- •14 out‑of‑the‑box alerts detect spend spikes, job failures, and query latency.
- •Integration uses Grafana Alloy and open‑source exporter, no custom exporters needed.
- •Setup requires four Databricks credentials and takes ~10 minutes.
Pulse Analysis
Databricks has become a cornerstone for modern data engineering, machine‑learning pipelines, and analytics, but its operational opacity often leaves teams scrambling for cost and performance insights. Traditional monitoring approaches rely on custom exporters or manual query builds, adding latency and complexity. Grafana Cloud’s new Databricks integration closes this gap by pulling key system‑table metrics directly into Grafana, delivering a unified view that spans billing, job health, pipeline freshness, and SQL query performance. This native bridge simplifies observability, letting organizations treat data workloads with the same rigor as any other cloud service.
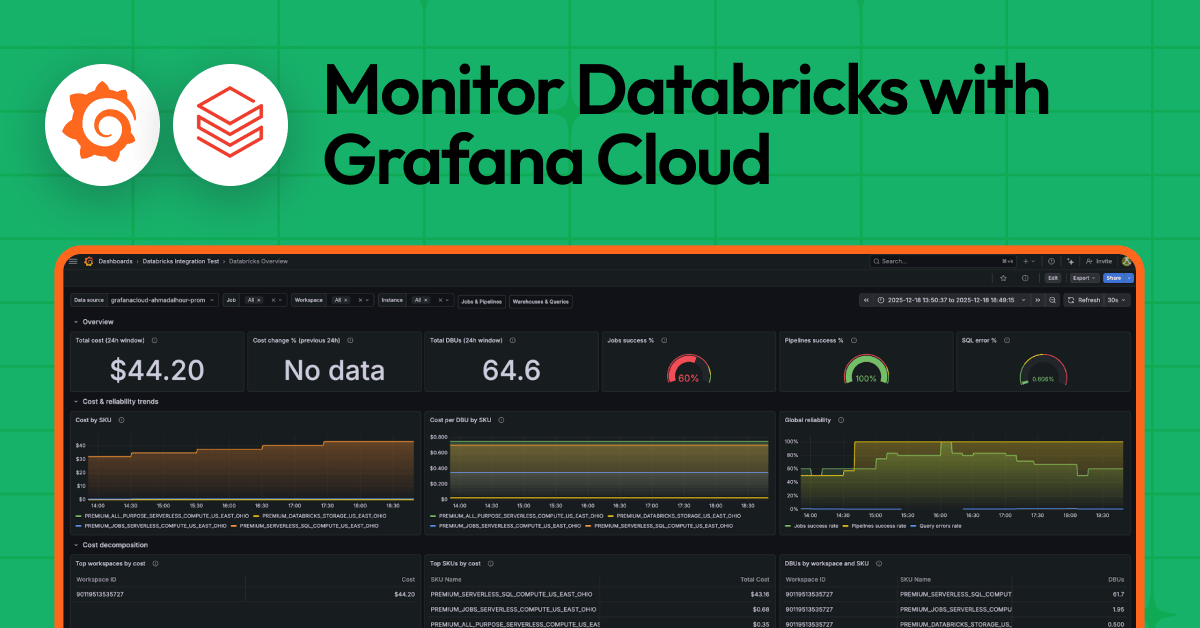
The integration ships with three purpose‑built dashboards—an executive overview, a jobs‑and‑pipelines monitor, and a warehouse‑query performance panel—each pre‑populated with essential metrics such as DBU consumption, success rates, latency percentiles, and error counts. Coupled with 14 out‑of‑the‑box alert rules, teams can automatically flag cost spikes, rising failure rates, or degrading query latency before they impact downstream users. By segmenting alerts for FinOps, SRE, and analytics personas, Grafana ensures the right stakeholders receive actionable signals, reducing noise and accelerating remediation.
Under the hood, Grafana Alloy runs the open‑source databricks‑prometheus‑exporter, querying Databricks system tables without the need for separate exporter services. Setup requires only four Databricks credentials—hostname, warehouse HTTP path, client ID, and secret—and can be completed in roughly ten minutes. While billing data carries a 24‑48‑hour lag and scrape intervals default to ten minutes, the trade‑off is a low‑maintenance, scalable monitoring stack that integrates seamlessly with existing Grafana observability workflows. This positions Grafana Cloud as a strategic layer for organizations seeking to tighten cost control and reliability across their data platforms.
Monitor Databricks with Grafana Cloud for instant visibility into your workloads
Comments
Want to join the conversation?
Loading comments...