What Is the UCS Satellite Database, and Why Is It Important?
•March 10, 2026
0
Why It Matters
The database provides the most structured public view of satellite ownership and purpose, informing debates on space traffic, debris mitigation, and the commercialisation of orbit. Its depth makes it indispensable for analysts who need more than raw tracking data.
Key Takeaways
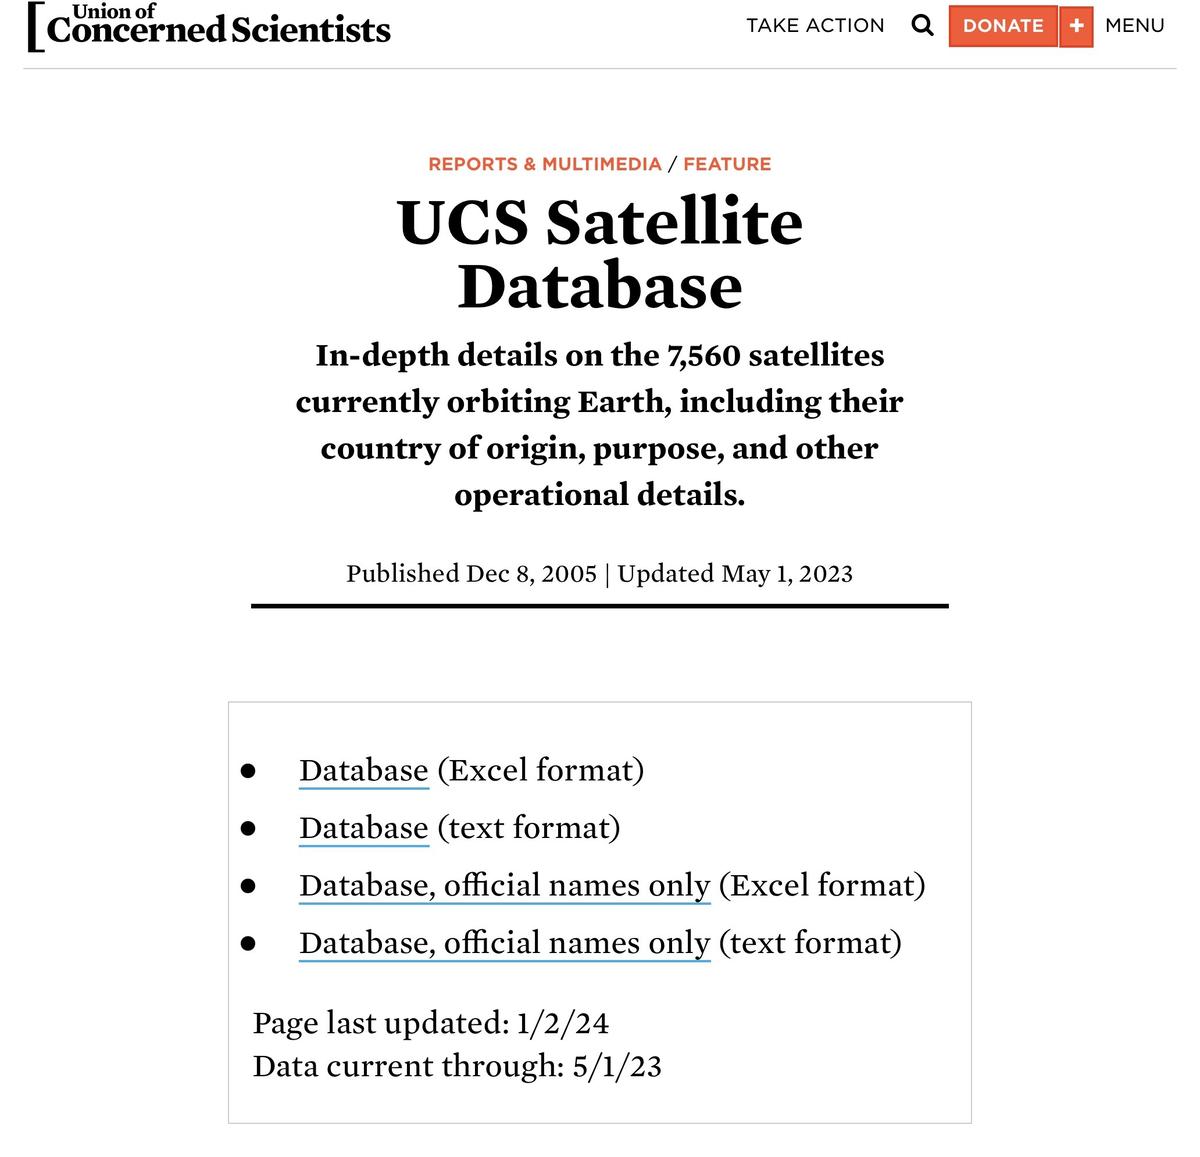
- •7,560 active satellites cataloged through May 2023.
- •Data includes 28 technical and operational fields per satellite.
- •U.S. accounts for ~70% of cataloged satellites.
- •Commercial constellations dominate LEO growth in the dataset.
- •Human‑curated classification causes lag but ensures consistency.
Pulse Analysis
The UCS Satellite Database fills a niche that pure tracking services cannot. By attaching ownership, operator, and mission descriptors to each object, it transforms a raw count of spacecraft into a nuanced portrait of the global space economy. Researchers can instantly answer questions about national capabilities, commercial market share, or the balance between Earth‑observation and communications payloads, without the labor‑intensive data‑cleaning that other sources demand.
For policymakers and industry leaders, the database’s historical depth is especially valuable. Comparing the 2005 baseline of 810 active satellites with the 2023 snapshot of 7,560 highlights the explosive growth of low‑Earth‑orbit constellations and the United States’ dominant role. Those trends feed directly into discussions on spectrum allocation, launch‑service demand, and the urgency of space‑traffic‑management frameworks. While the dataset lags behind real‑time feeds, its curated classifications provide a reliable foundation for impact assessments and risk modelling.
Educators and journalists also benefit from the UCS resource. The 28‑field schema, available in both Excel and plain‑text formats, enables classroom projects and investigative reporting that would otherwise require costly subscriptions or custom data pipelines. By pairing the UCS snapshot with up‑to‑date tracking feeds such as Space‑Track or CelesTrak, analysts can achieve a hybrid view: the historical, interpretive context of UCS plus the live positional accuracy of operational catalogs. This synergy underscores why the UCS Satellite Database remains a critical public asset in 2026.
What Is the UCS Satellite Database, and Why Is It Important?
0
Comments
Want to join the conversation?
Loading comments...