Key Takeaways
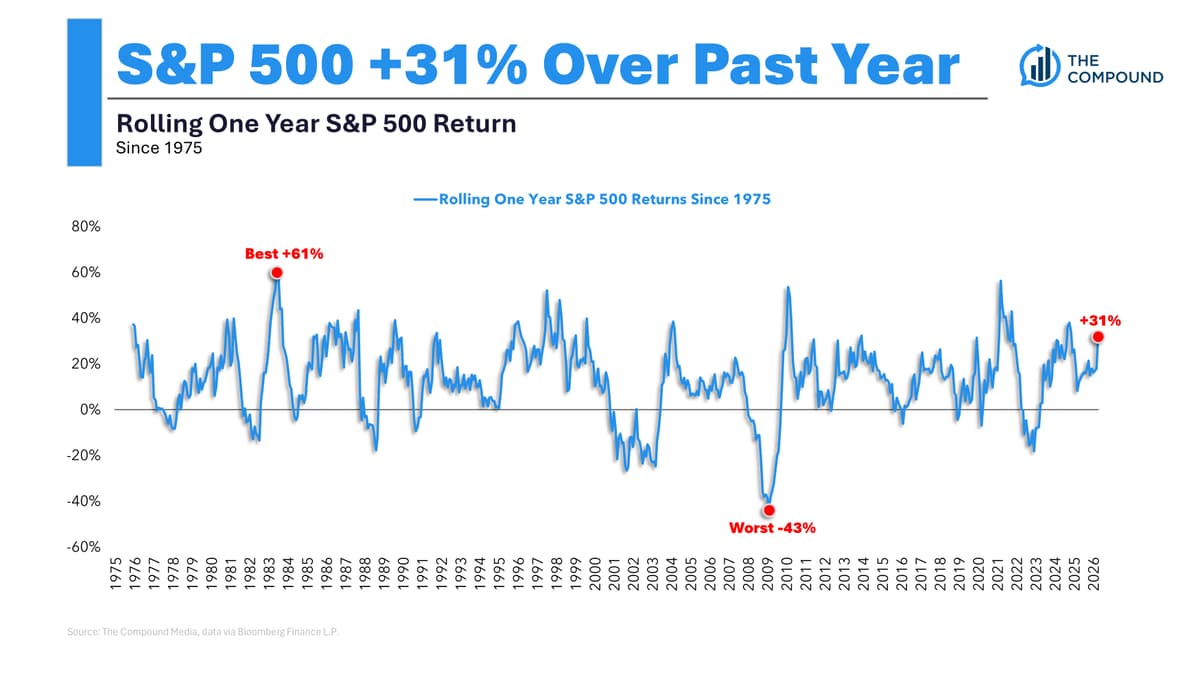
- •31% 12‑month return ranks 88th percentile since 1975
- •Best 12‑month gain was 61% in early 1980s
- •Worst 12‑month loss was –43% during 2008 crisis
- •Returns ≥40% occurred 22 times; ≥50% only 7 times
- •Next‑year return after 30%+ gain averages 11.1%
Pulse Analysis
Long‑term equity investing remains a lesson in compounding power. Starting in 1975, a modest $10,000 placed in the S&P 500 would be worth roughly $4.2 million today, illustrating how steady market growth can transform wealth. This backdrop makes the recent 31% annual surge stand out, yet it is part of a broader distribution of outcomes that investors should evaluate against historical benchmarks.
Rolling 12‑month returns reveal that the 31% gain sits near the top of the historical spectrum, ranking in the 88th percentile. The market’s most dramatic rally—61% in the early 1980s—followed a period of high inflation and aggressive Federal Reserve tightening, while the deepest decline, a 43% drop, coincided with the 2008 financial crisis. Returns of 40% or more have materialized 22 times, and only seven instances have exceeded the 50% threshold, underscoring the rarity of such performance spikes.
Predicting the next 12 months after a big up year remains notoriously tricky. Data show that after a 30%+ rise, the subsequent year’s average return falls to about 11.1%, suggesting that momentum can wane quickly. Investors should therefore temper expectations of a continued melt‑up, consider diversification, and focus on fundamentals rather than short‑term price swings. Understanding these patterns helps balance optimism with prudent risk management in a market that can swing from extreme gains to steep losses.
50 Years of Stock Market Returns
Comments
Want to join the conversation?