
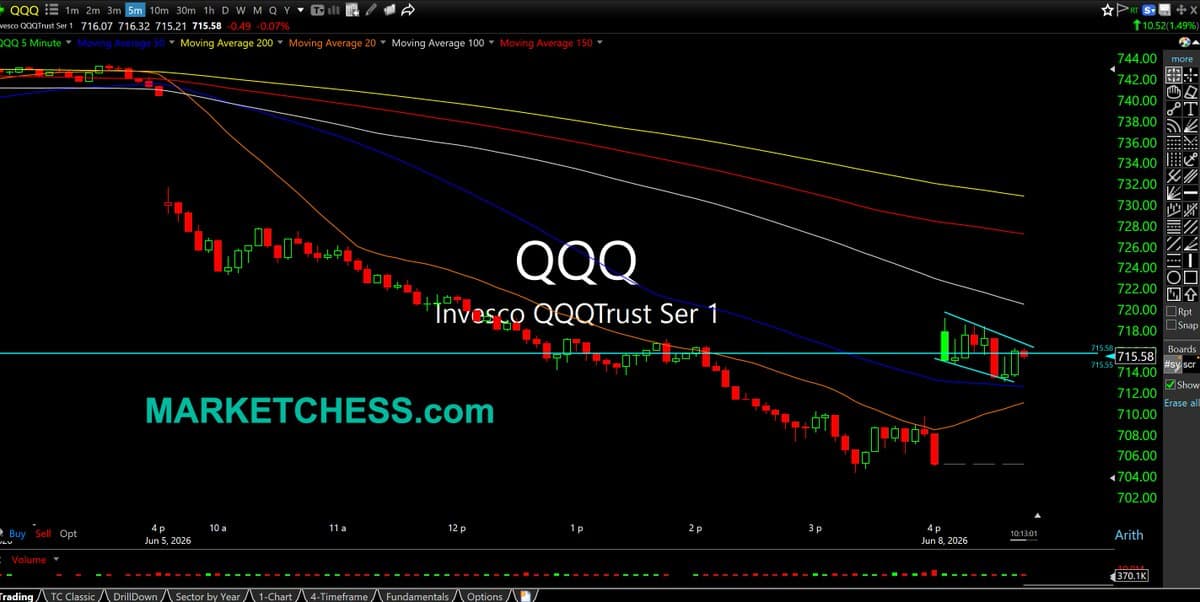
Nasdaq Rallies, Then Stalls Ahead of CPI
$QQQ 5-Minute Chart. Nasdaq pops to Friday mid-afternoon levels before the end of day swoon. Initial test to see if selling into strength before CPI on Wed.. https://t.co/squHQimLCj
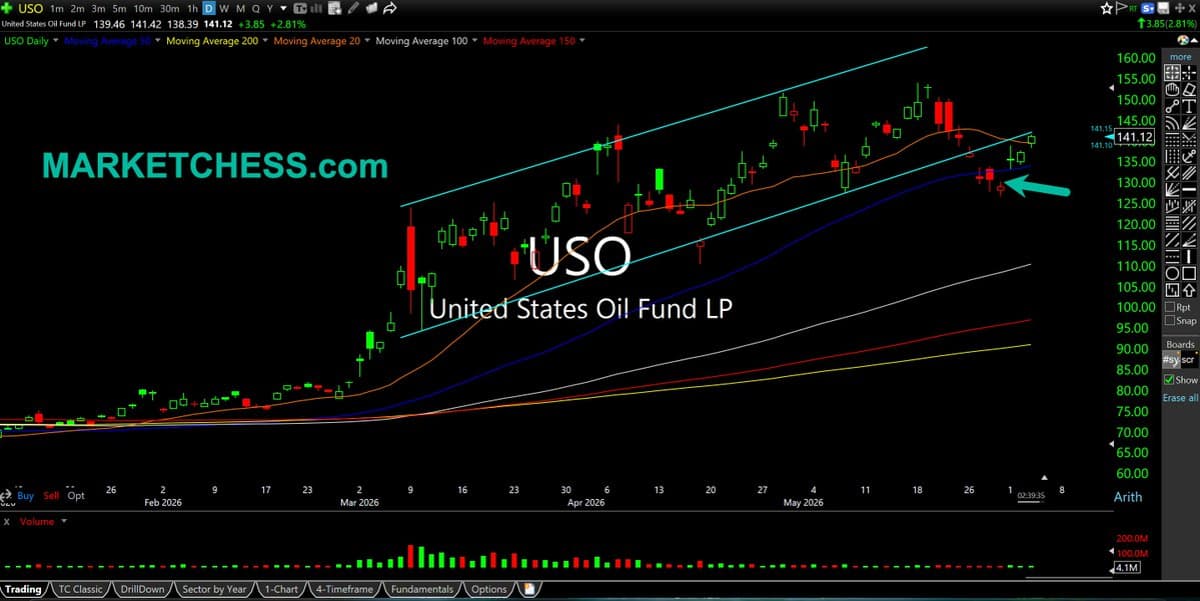
Oil Prices Rebound Amid Middle East Escalations, Potential Squeeze
$USO Daily. Oil on comeback trail as escalations rise in Middle East amid no deal. If this was a bear trap/false breakdown, should provide the squeeze to fuel the next leg higher into shortages https://t.co/LLMTwR9t1J
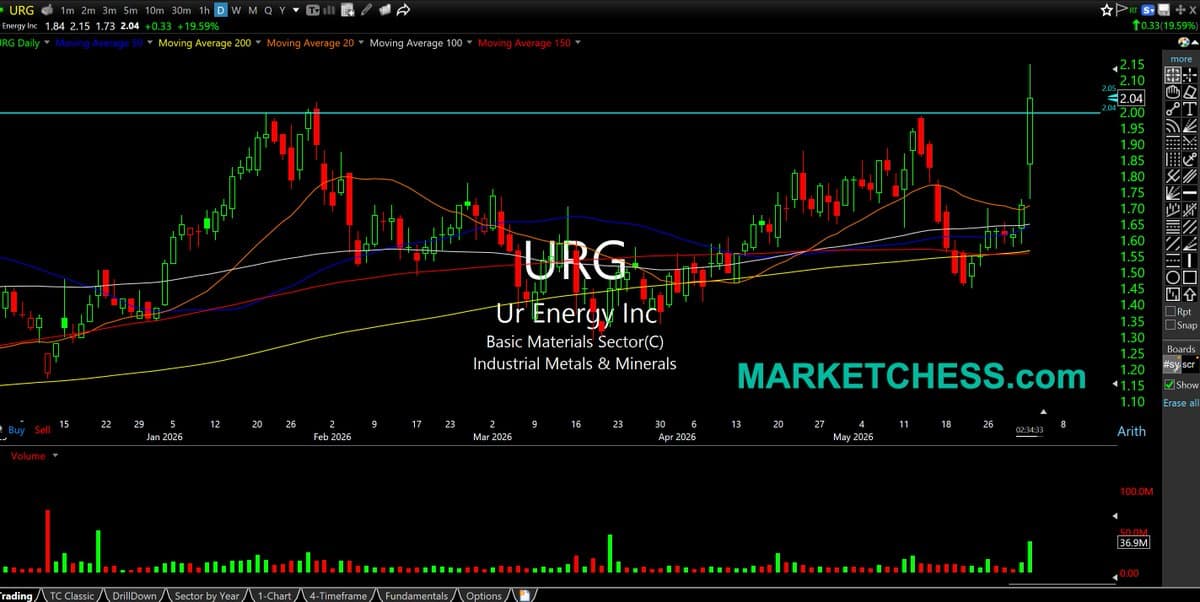
Uranium Stocks Surge as U.S. Enrichment Capacity Expands
$URG Daily. Ur Energy up big on news they will significantly expand uranium enrichment capacity in the U.S.. Other uranium miners rallying in sympathy. Sector been quiet but waking up https://t.co/aDH2W8ZIiJ
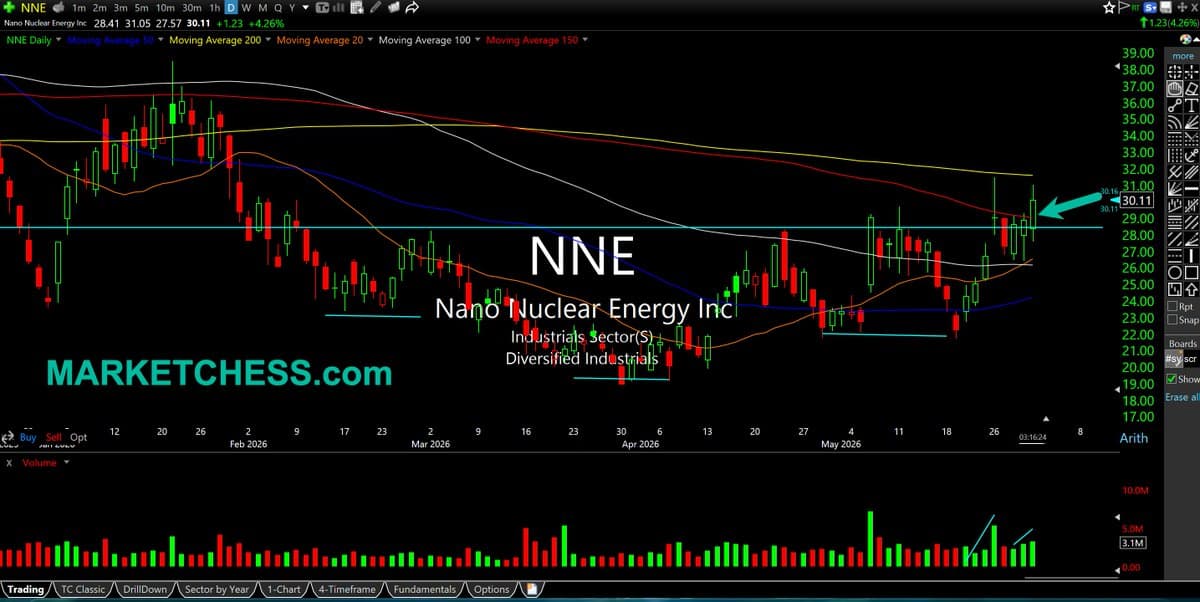
NNE Bullish Volume Signals Inverse Head‑Shoulder Breakout
$NNE Daily. Bullish buy volume pattern (bottom pane) the last few weeks from nuclear play as it tries to clear inverse head & shoulders bottom setup for upside breakout. https://t.co/T228ZF9XEo
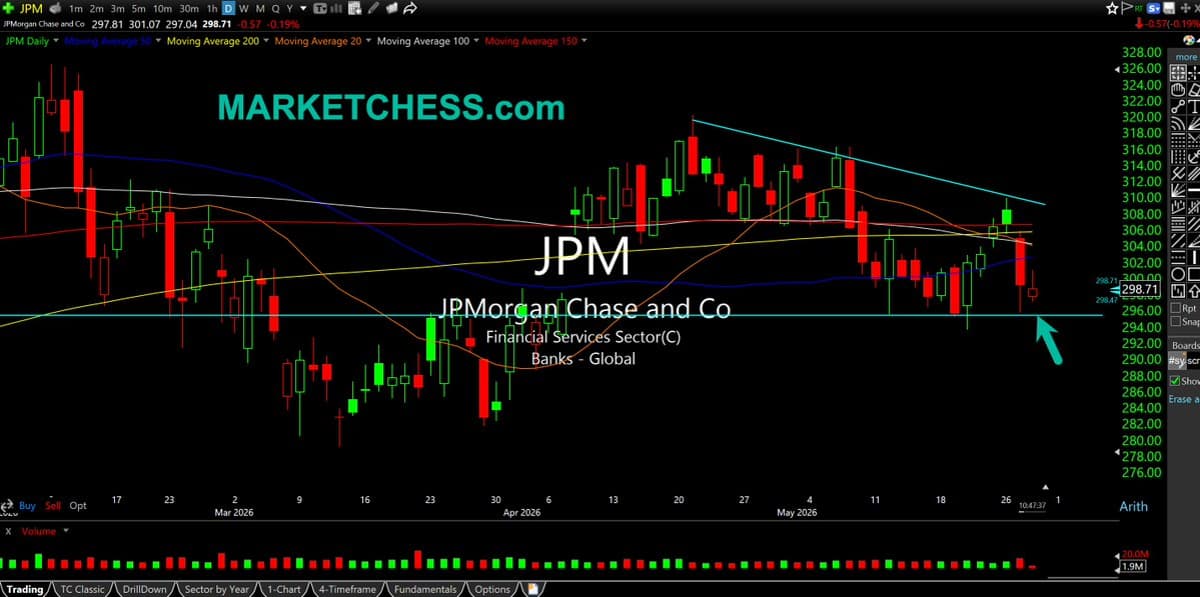
Big Banks Falter: Chase Rejects 200‑Day Trend
$JPM Daily. Big banks quietly weak again, with tons of distractions elsewhere. Chase continues to be suspiciously weak too, rejected at 200-day moving average. High profile CEO. Leading sector down? https://t.co/3kymXO5VLY
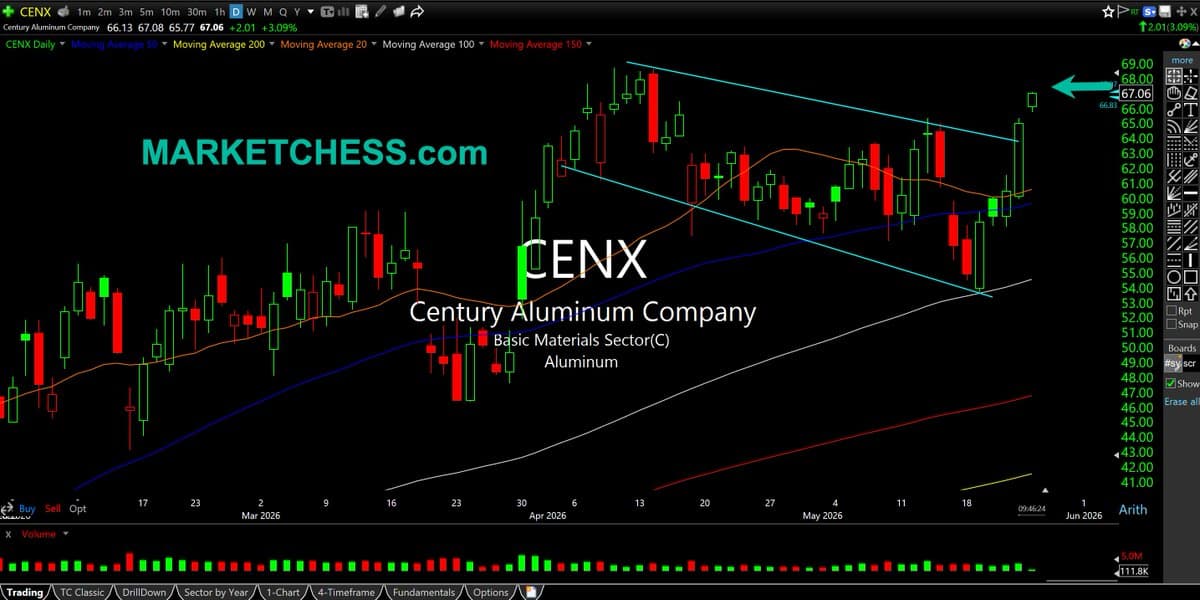
Century Set for Spring Breakout After Consolidation
$CENX Daily. Aluminum plays out of the gate nicely. Two-month consolidation for Century here, threatening fresh breakout in a strong sector this spring. https://t.co/GyLgvy8FHp
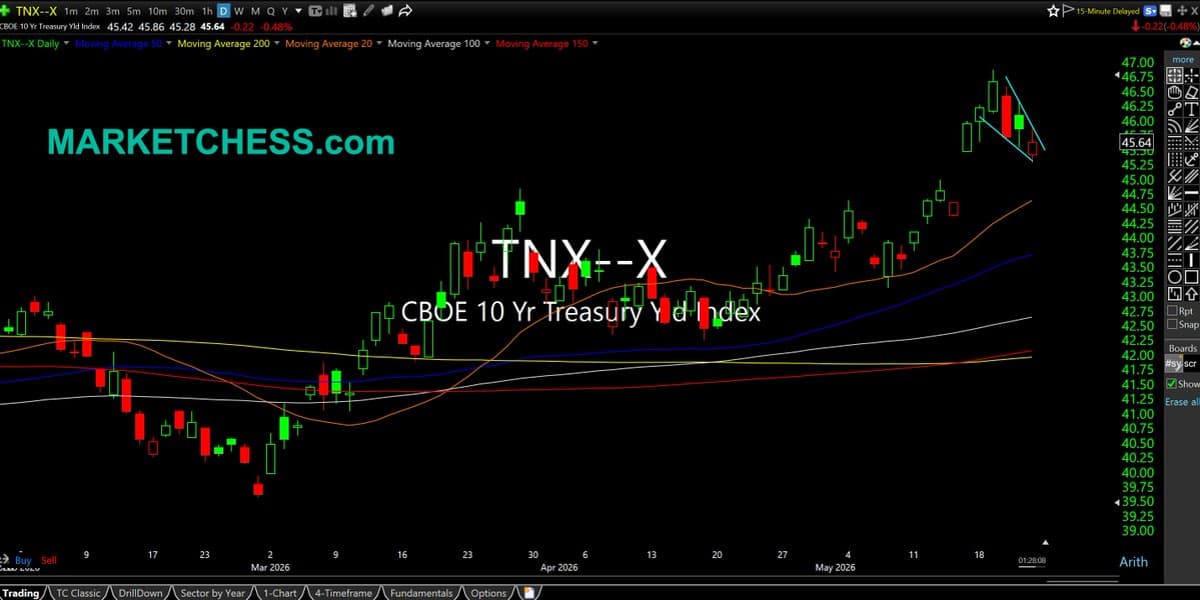
Stocks Stay Optimistic as 10-Year Yields Consolidate
$TNX Daily. Stocks continue to wear bright rose colored glasses. But oil and rates are barely down. Here, 10-Year Note rates look like a bull flag/benign consolidation into the three-day weekend. https://t.co/Fydi2jO0Oh
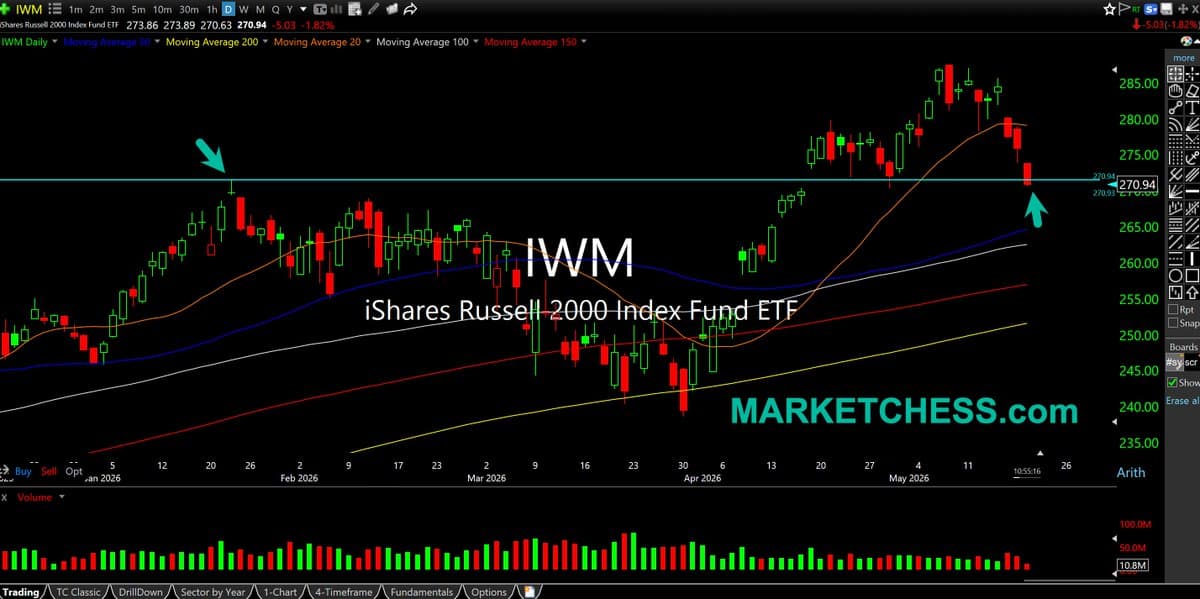
IWM Below Jan High, Bull Trap Looms
$IWM Daily. Small cap dipping below $271.60, the prior highs from January. Failure to reclaim this spot by bulls opens door to the recent breakout being a major bull trap. https://t.co/qqVz2SeDuC
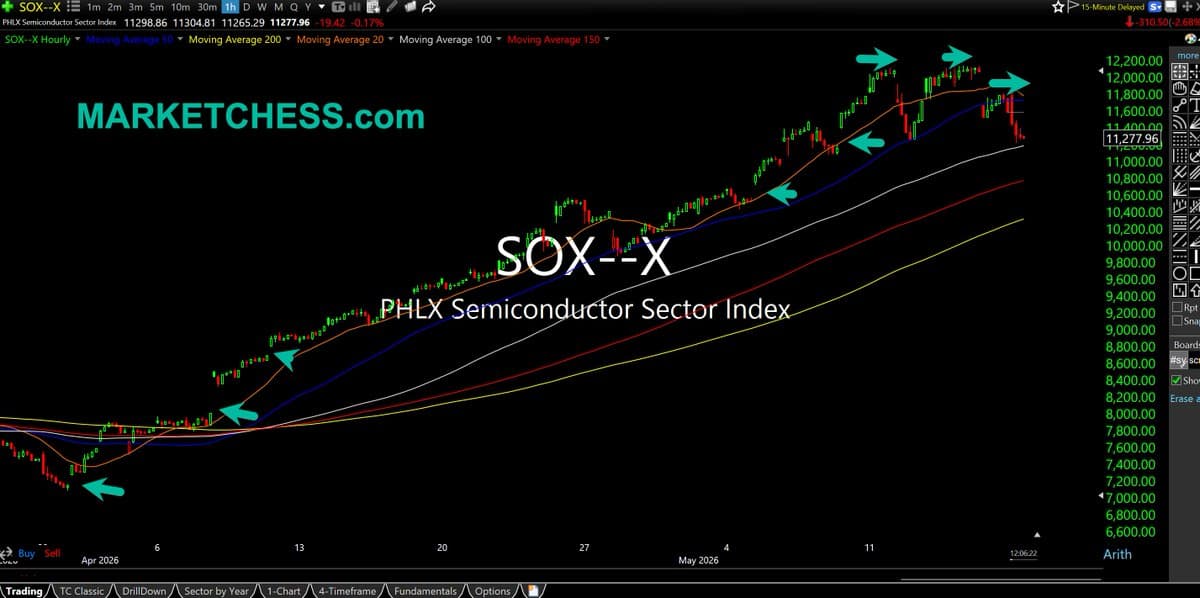
Semiconductor Weakness Emerges Ahead of Nvidia Earnings
$SOX Hourly. Some clear notable relative weakness for semis today. NVIDIA earnings this week. Tons of (mostly) open gaps below since end of March. This timeframe finally looking toppy. $SMH $NVDA https://t.co/9AIXPkgLS5
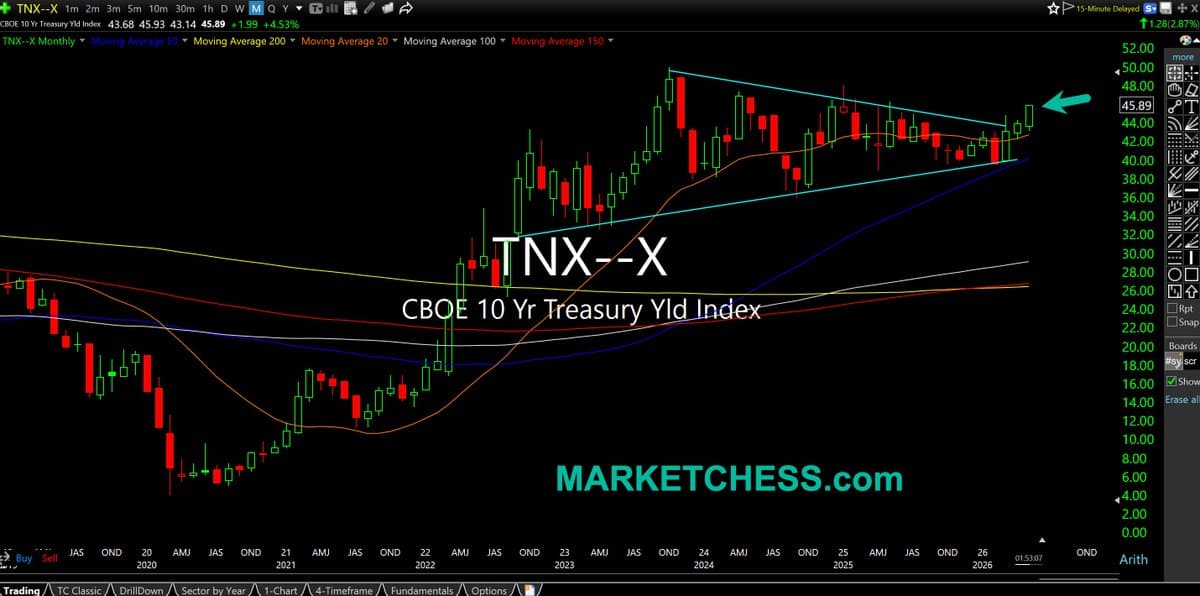
Rates Surge, Fed Likely Must Hike Despite Trump Pressure
$TNX Monthly. Real issue here is that if this 3-4 year breakout in rates is just starting, Fed is way behind curve needing to hike. Even more with Trump pressuring Warsh for *cuts* https://t.co/3rAPbd4qGv
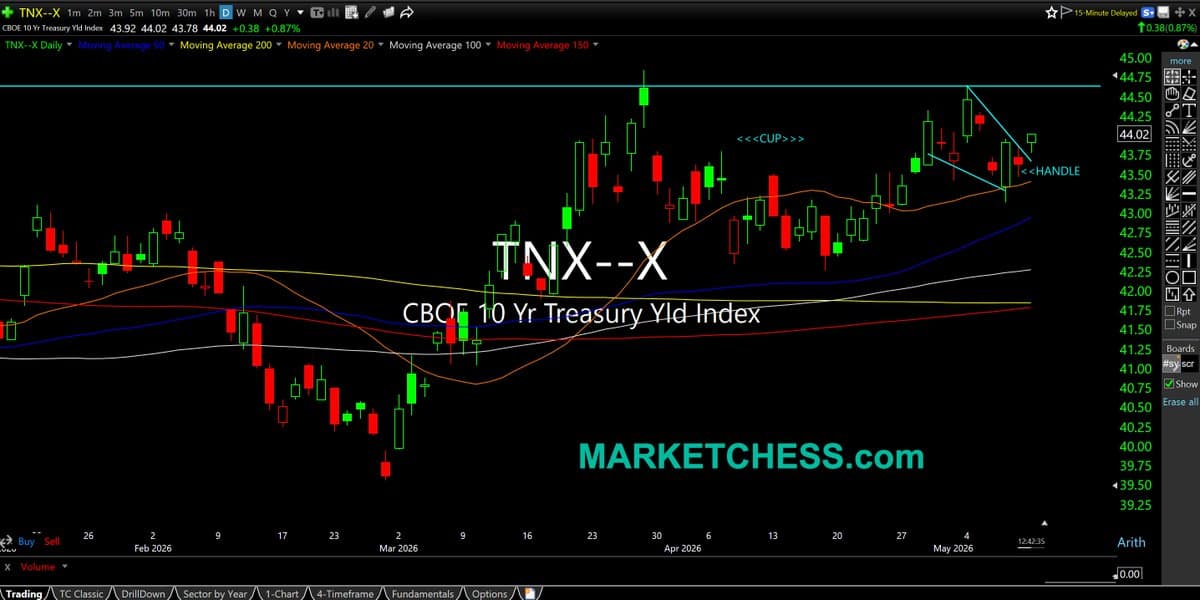
10-Year Note Forms Bullish Cup‑Handle, Breakout Loom
$TNX Daily. Index for Rates on 10-Year Note. Chart patterns can & often do morph. Here, consolidation morphs to bullish cup & handle. Back over at least 4.7% threatens breakout https://t.co/gQXIqXWRgI

Semis Gap Up Defies Classic Reversal Pattern
Monday morning gap up in semis after a prior vertical move would be a textbook reversal/rug-pull spot, but to be fair, this market has defied the "Textbook" for a while now. $SMH -
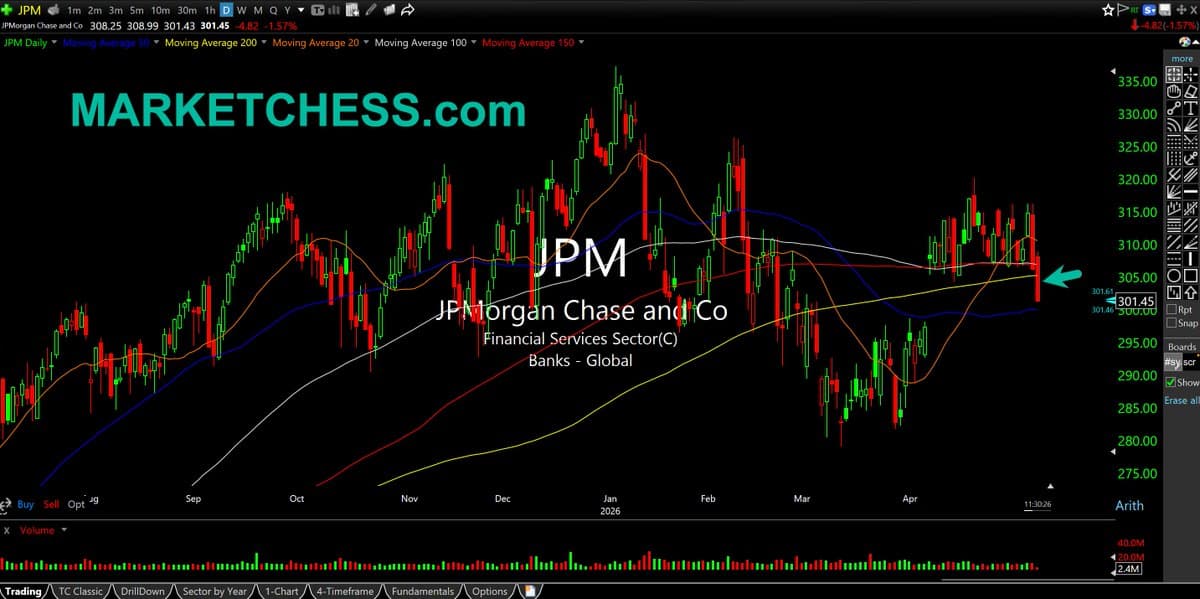
JPMorgan Slides While Chips and Nasdaq Surge
$JPM Daily. As stealth a breakdown as you'll see for JPMorgan given its size & prominence. But in this tape we have chips & Nasdaq melting up again. Chase losing 200-day m.a. pretty soundly here https://t.co/4cDfuRrsOG
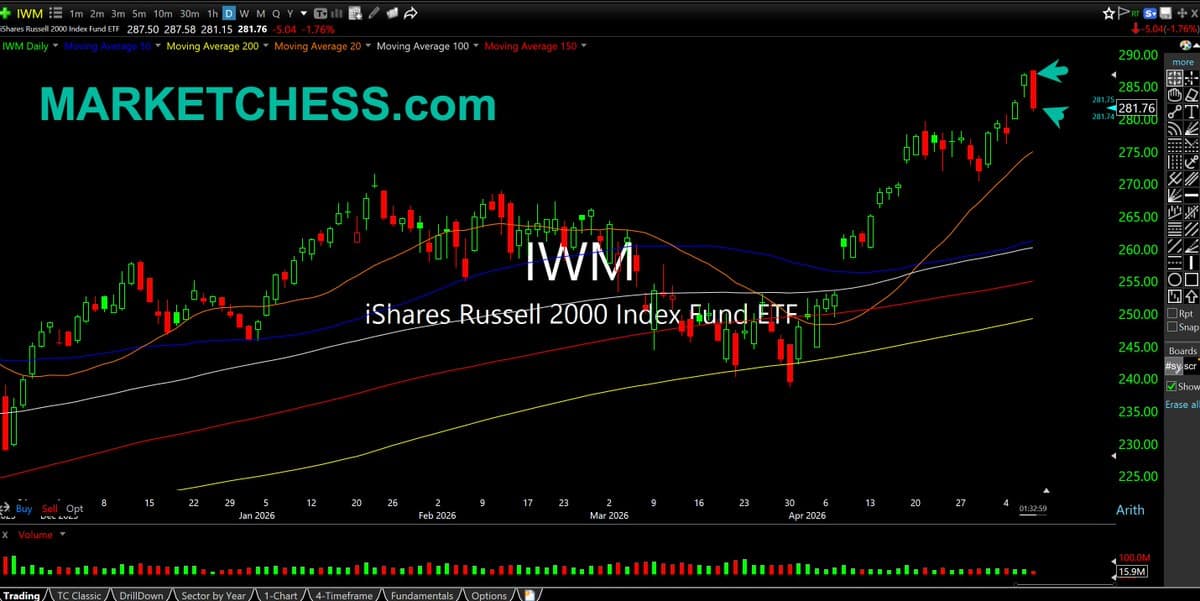
IWM Shows Bearish Engulfing After Steep Rally
$IWM Daily. Most eyes on Nasdaq, semis, oil, but so far today small cap ETF sporting classic bearish engulfing candle, pending the close of course. Took out yesterday's highs & lows after steep rally https://t.co/OKeRJzdniB
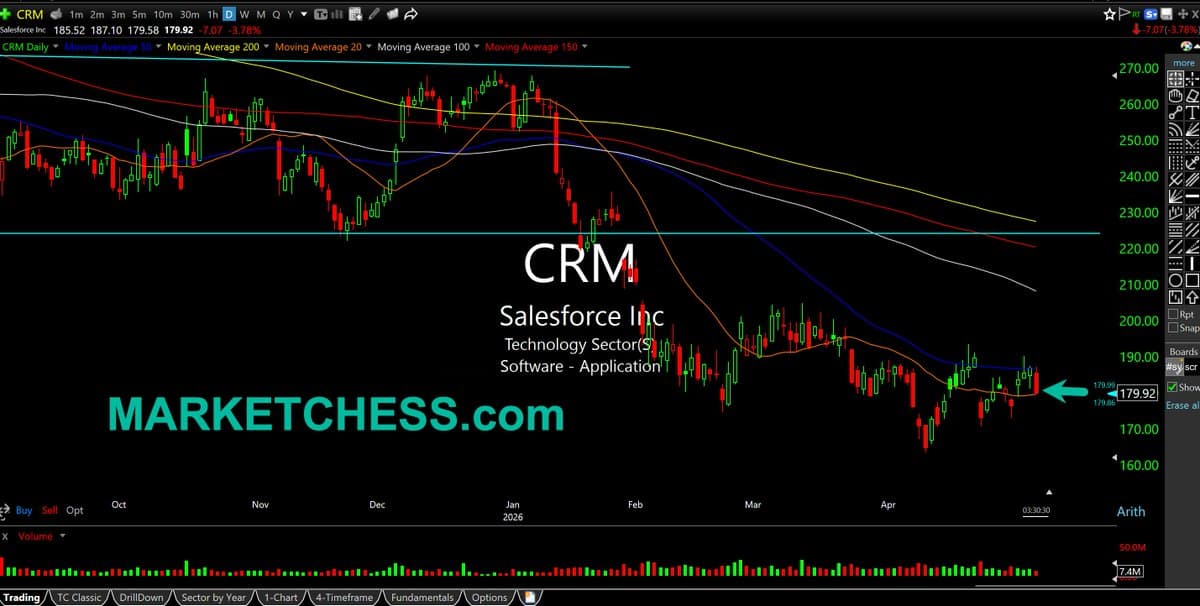
Salesforce Underperforms Amid Nasdaq Melt‑up, Looks Short
$CRM Daily. Salesforce, which replaced Exxon in the Dow years ago, seems like it should be at least higher during an epic Nasdaq melt-up. Instead, like software sector overall, looks more like a short https://t.co/BSqOnth6GX