

Gold Beats S&P Over 1‑10 Year Horizons
think the S&P 500 $SPX has gone up too far and is "overvalued"? remember, gold has a better cumulative return and CAGR on a 1/2/3/4/5 & 10-year time frame as stocks lagged... https://t.co/1Wlno2Mgsx

V‑bottoms Squeeze Shorts, Leaving Late‑comers Stranded
"V" bottoms cause challenges for many... the shorts get caught and squeezed harder every day since the lows and those that waited for a comfortable narrative, are left watching from the sidelines as the ship (the market) becomes a distant...

Easing Tensions Historically Trigger Bond Price Declines
i'm old enough to remember the days when headlines suggesting easing tensions and less uncertainty would mean bond prices fell... https://t.co/KaynvMrU0Q
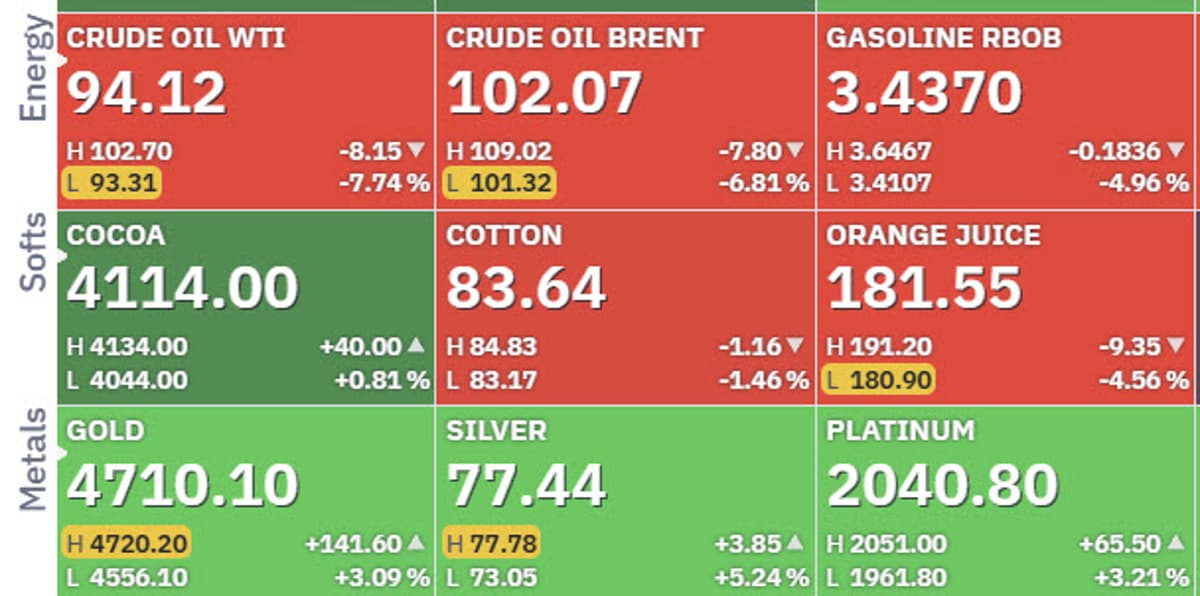
Oil Retreats as Gold, Silver Rally Amid Hormuz News
headlines suggest a ship got through Hormuz... market sells off oil to buy gold & silver... https://t.co/m7V4eqZnEK

Mid‑Cap Surge: 249 New Highs, 87 Lows
there are 249 mid-cap (and smaller) stocks hitting the 52-week new highs list today... there are 87 mid-cap (and smaller) stocks hitting the 52-week new lows list... #HighLowShow #marketUpdate #investing
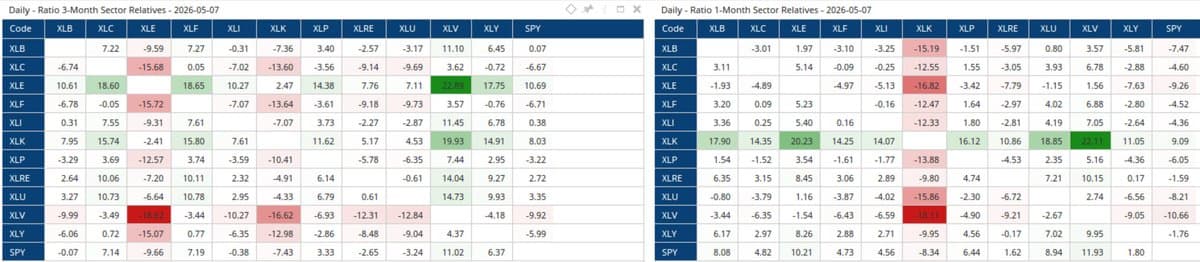
Weekly Sector Ratio Grids Reveal 3‑Month vs 1‑Month Trends
here's a weekly glance at my @Optuma sector ratio grids, which takes that same sector data and compares on two time frames, this time each sector against the others... #SectorWatch left: 3-month % change right: 1-month % change https://t.co/mIhZaI7jIc
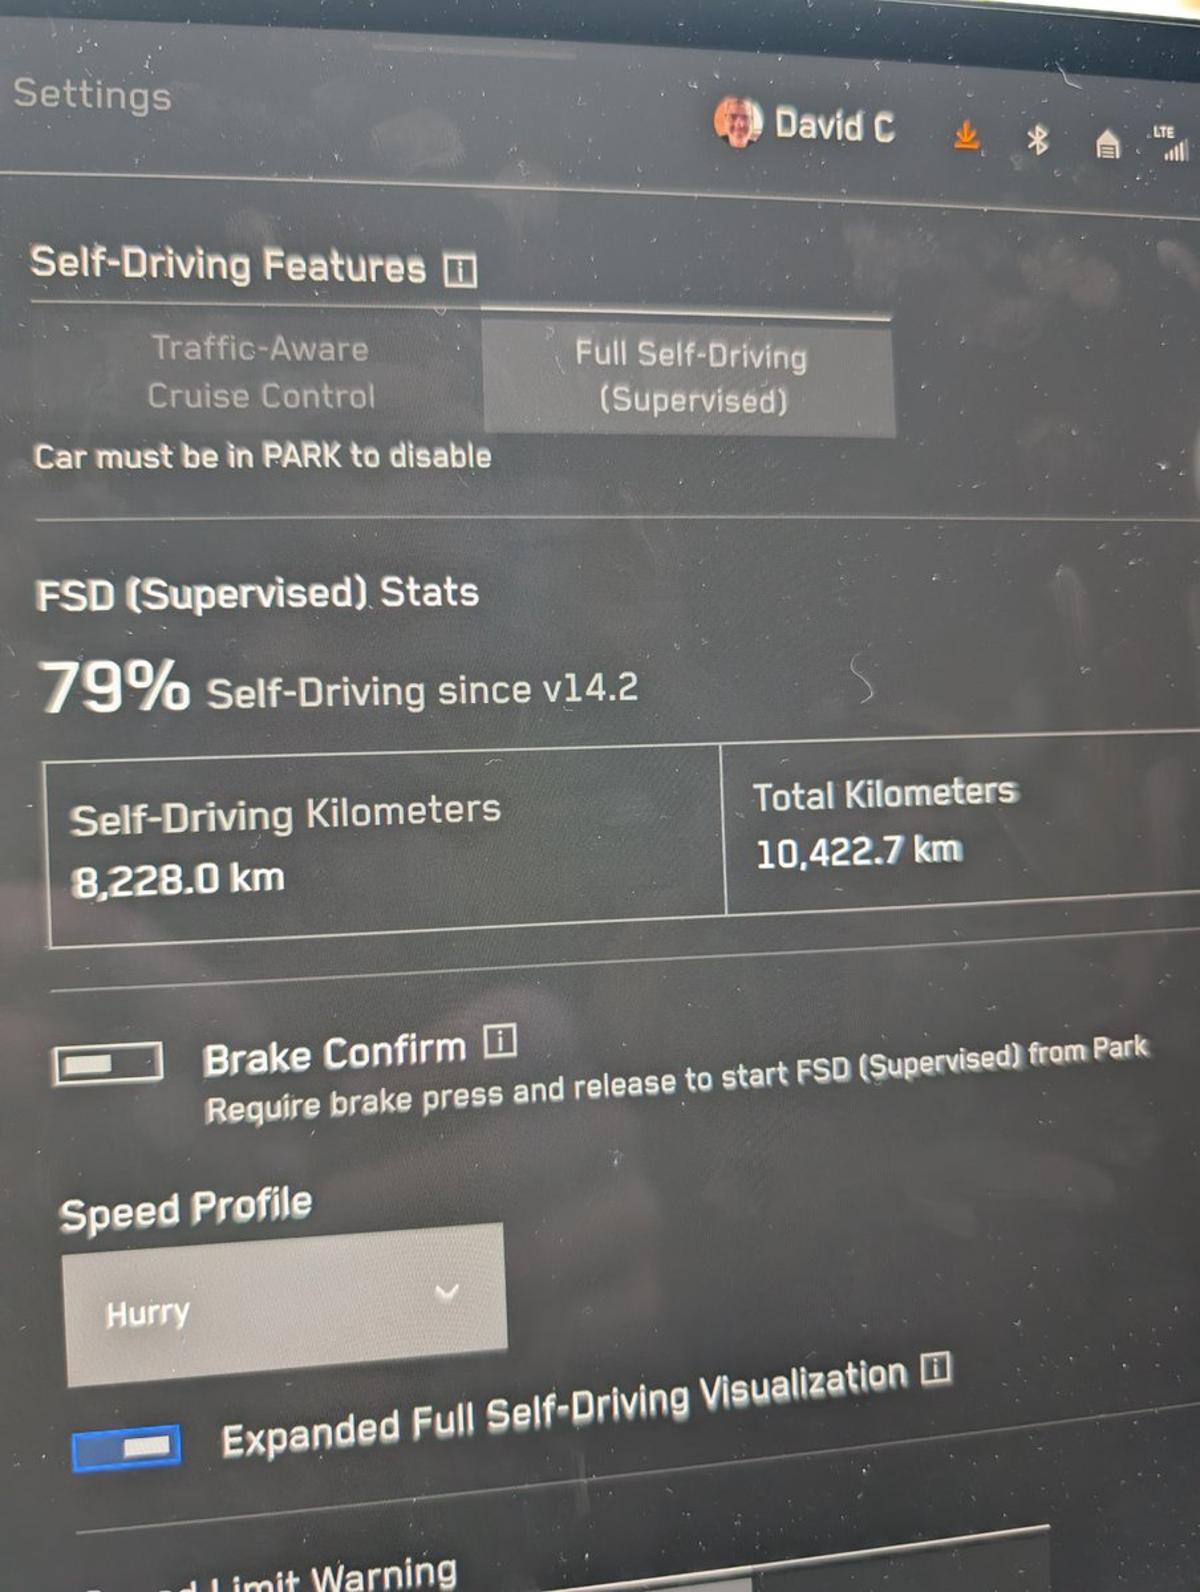
Real-World 10k Km Test Shows 79% FSD Works
most i've heard speak out against or criticize @tesla @cybertruck #FSD don't seem to have even driven with it.. i'm running 79% full self driving for the last 10,000 km's... awesome... https://t.co/dj8DueQSod

Large‑cap New Highs Outpace Lows 89 to 13
there are 89 large-cap stocks hitting the 52-week new highs list today... there are 13 large-cap stocks hitting the 52-week new lows list... #HighLowShow #marketUpdate #investing
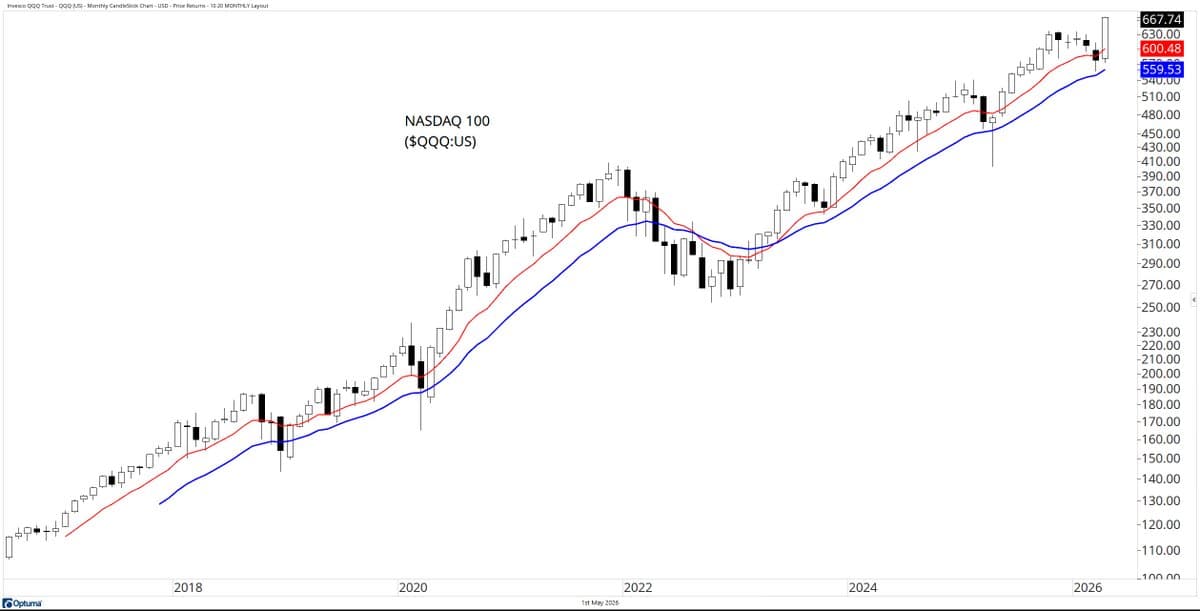
Nasdaq
Nasdaq 100 $QQQ call me ignorant if you choose, but it looks like the past few months were a small pullback against the uptrend... #monthlycharts https://t.co/t9zlJ18gZD
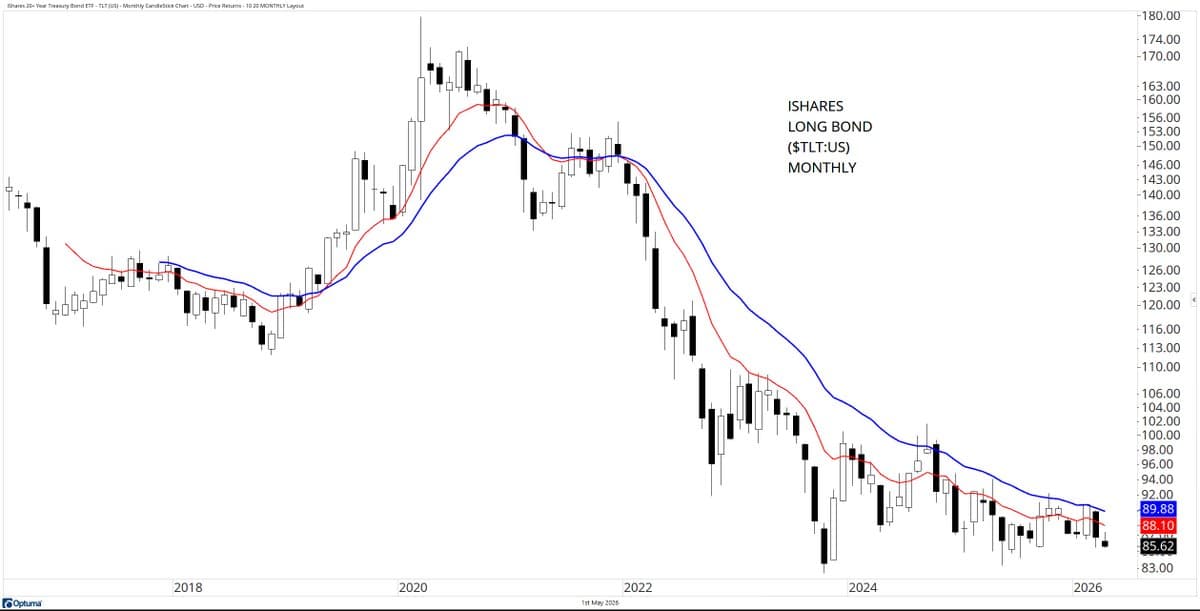
Monthly Chart Shows TLT Outperforming Value Pitches
a few monthly charts i thought i'd share... #monthlycharts although there have been many pitching U.S. treasury (bonds) for value, the chart speaks... $TLT https://t.co/3VMEeufVcn
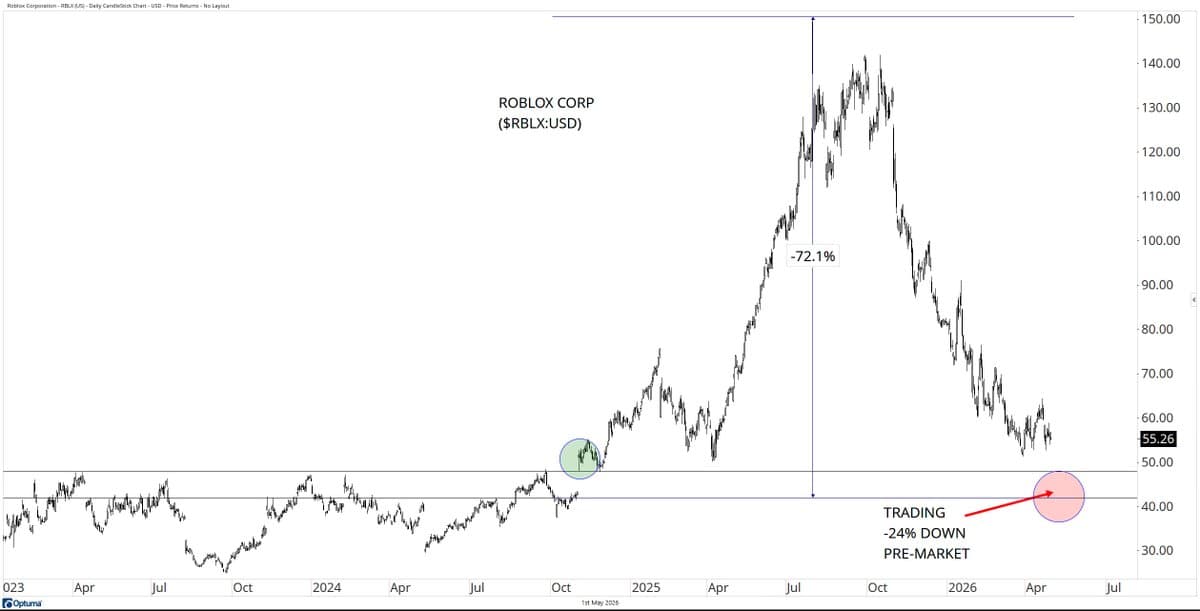
Trendfollowing Shields Investors as Roblox Plummets 72%
Roblox $RBLX down -24% beating on Q1'26 EPS... another reason to be thankful for #trendfollowing so you don't yourself among the losers... the stock is down -72.1% from highs (barring a bounce from pre-market conditions) https://t.co/1qhz4AvBNd
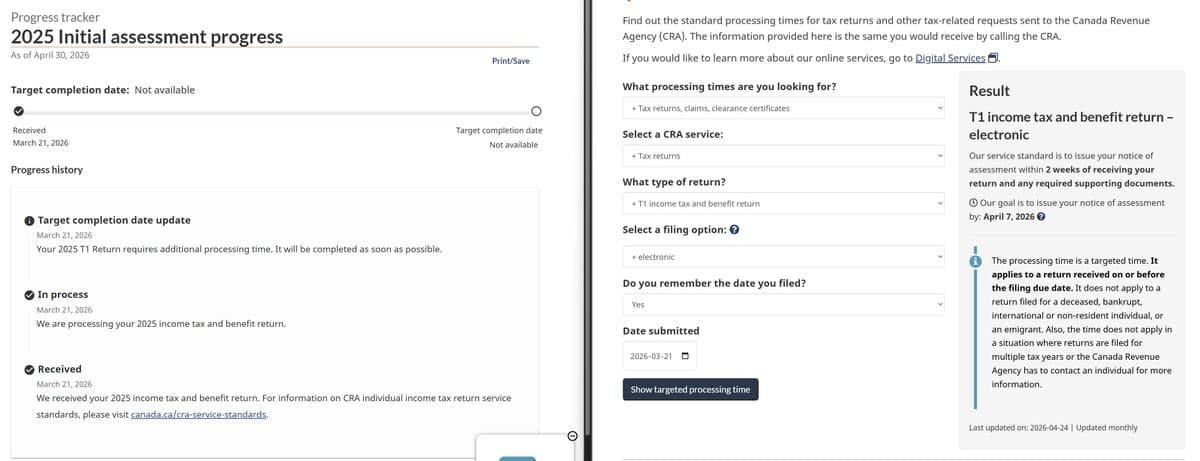
Agency Missed April Deadline, No Updates for 7 Weeks
i know the @CanRevAgency is hard at work, but the April 7th deadline and two weeks expectation, sadly, was missed for your truly... running 7 weeks... and not even an update... https://t.co/31f1wEi6UC
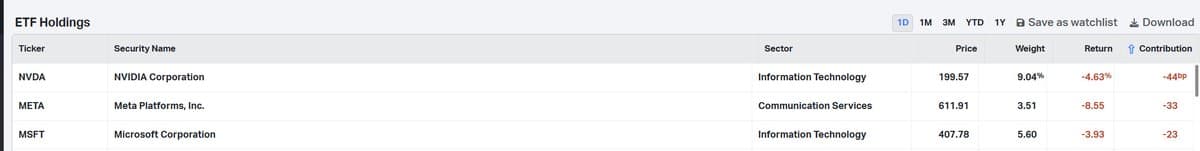
QQQ Climbs 0.9% as Non‑big‑tech Rallies 2%
the $QQQ was +0.9% today... $NVDA $META $MSFT detracted -1% from that number, leaving the other 97 tickers +2% on the day... h/t @KoyfinCharts https://t.co/xpa4W104Sd
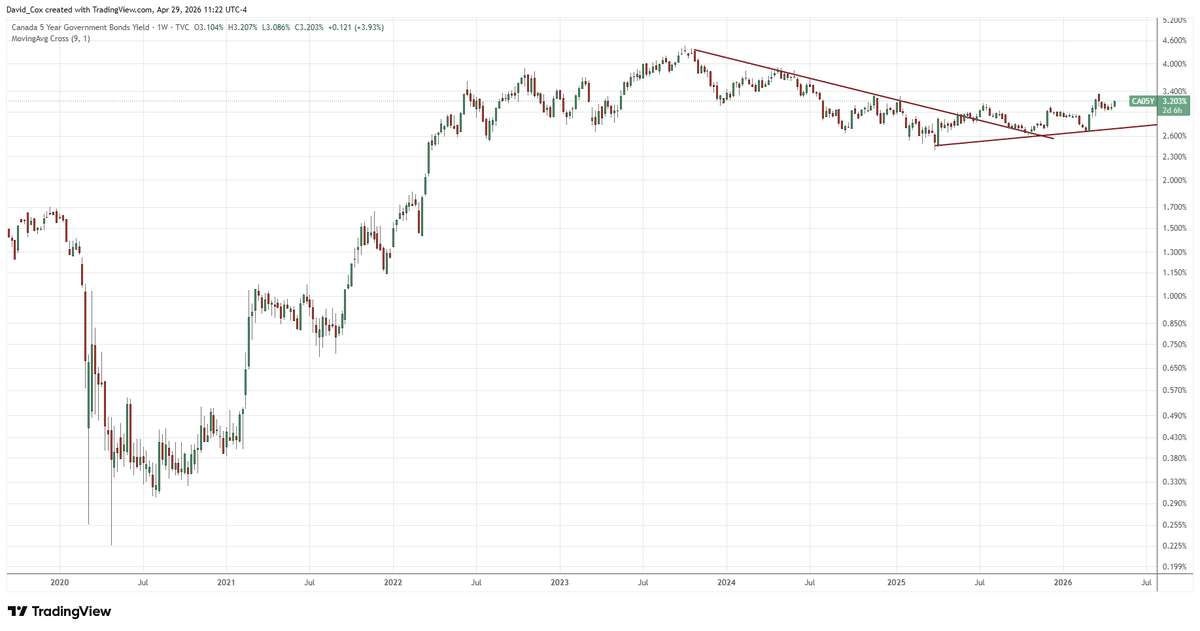
Canada Yields Rise Independently of Recent Rate Cuts
when they tell you that Canadian rates (yields) are rising and the @bankofcanada is all to blame, just tell'em they're wrong... 5-year Canada yields bottomed in '20 (like global yields) they spent the past few years consolidating and are now moving...
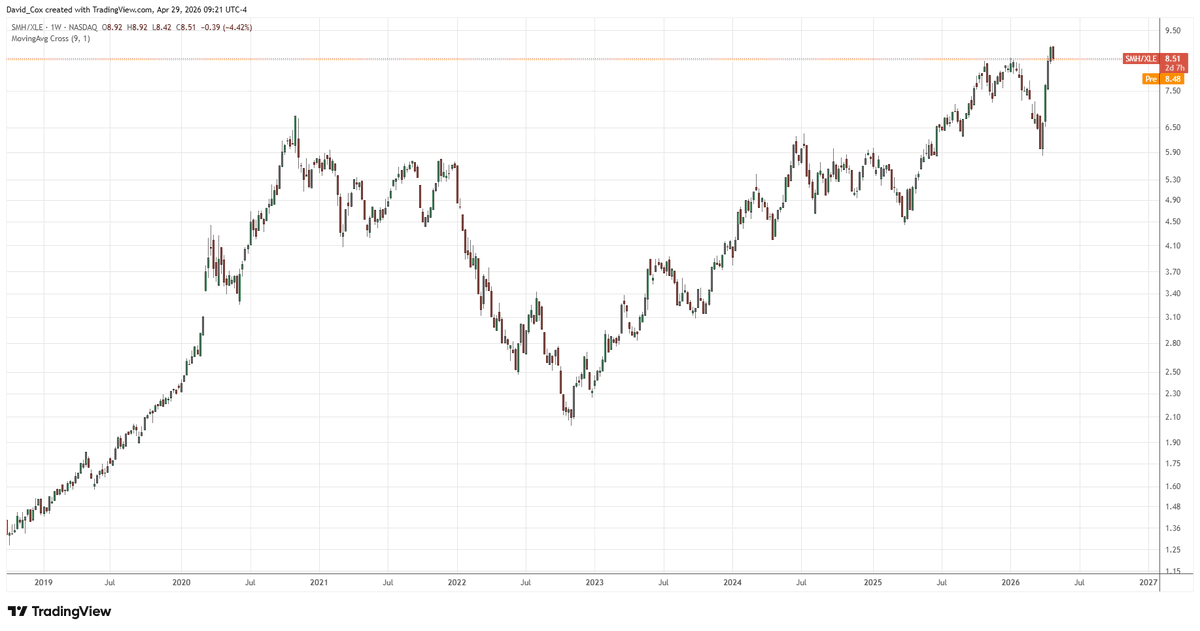
Semiconductors and Energy Stocks Surge Amid Oil Hype
while everyone tries to stay excited (and some perhaps anxious) about oil prices & Middle East headlines, semiconductors $SMH vs. energy $XLE stocks keep heading higher in their multi-year uptrend... https://t.co/xeMlOCoStn
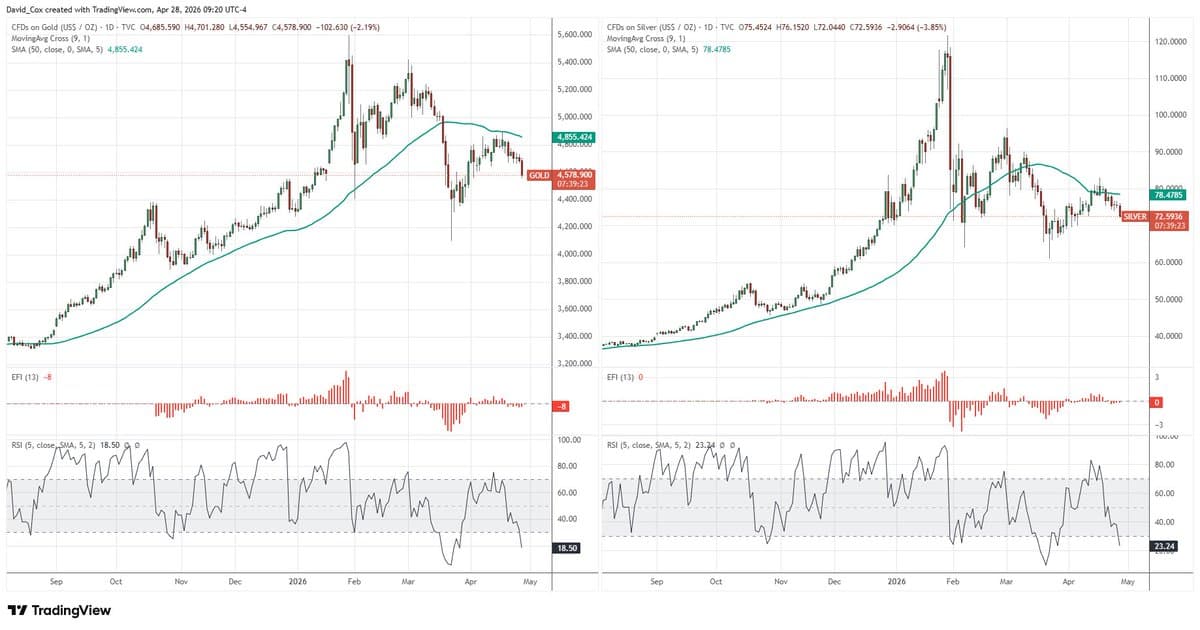
Gold and Silver Oversold Yet Still in Downtrend
gold & silver are RSI(5) oversold on the daily charts... BUT, these are in the context of ongoing downtrends (i.e., lower highs/lower lows and below falling 50-day moving averages)... context matters... https://t.co/DCGZgDHyp4
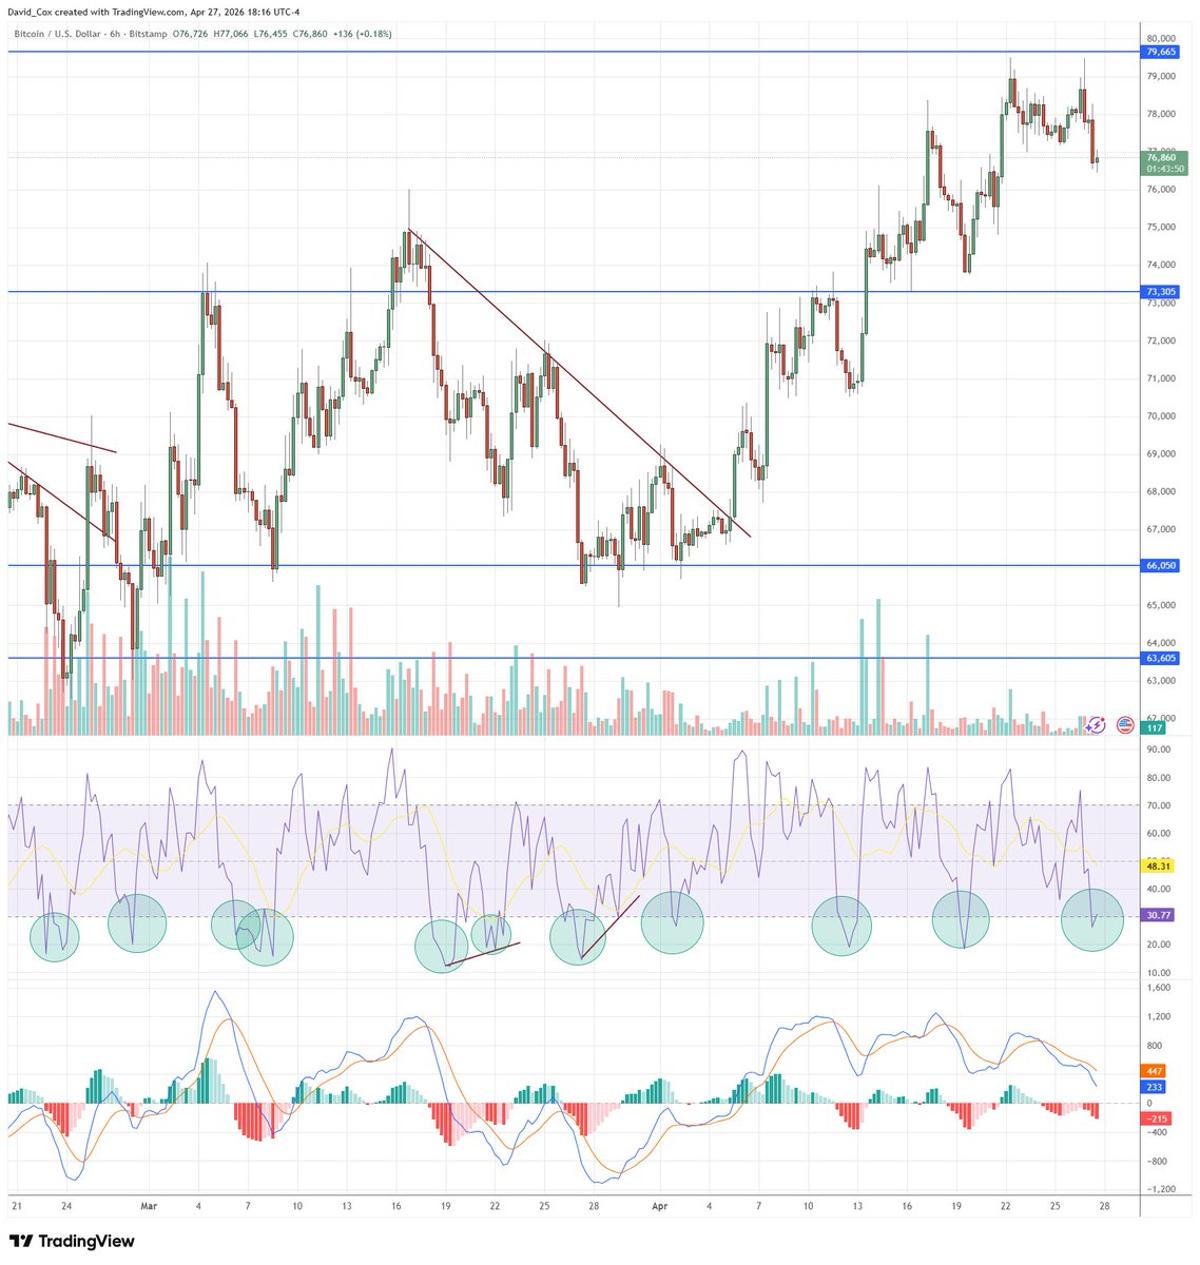
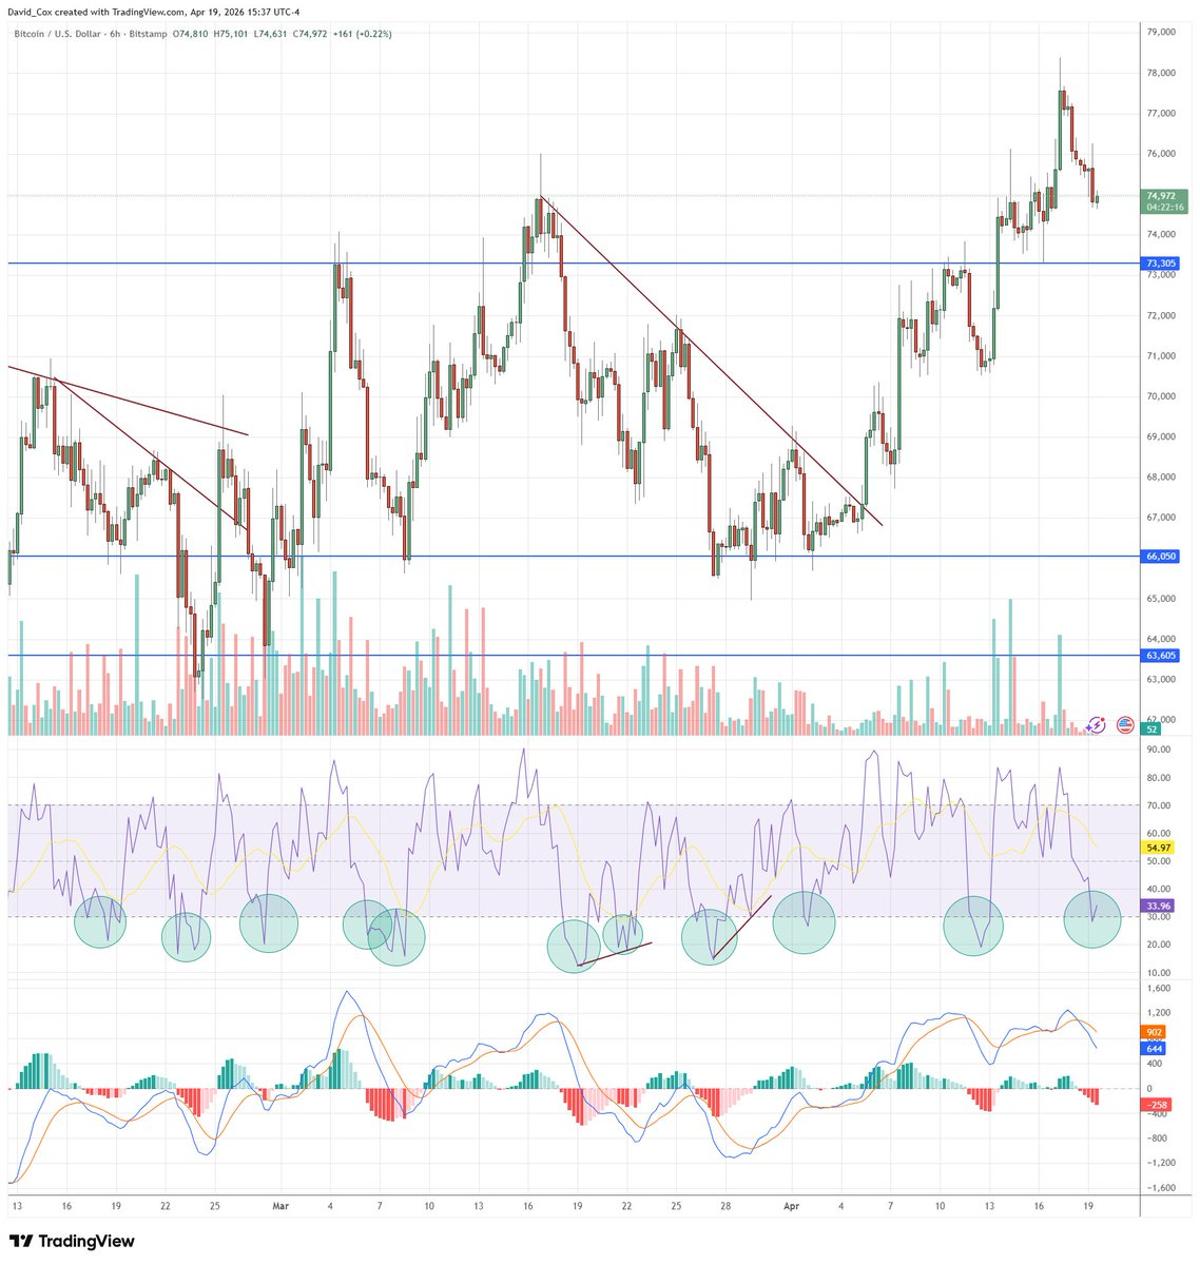
BTC RSI(5) Oversold on 6‑Hour Chart at $76.9K
Bitcoin #BTC $BTCUSD is RSI(5) oversold on the 6-hour chart for the first time since the ~$73.5Klevel... currently sitting $76,860... https://t.co/2CV8FPy47x
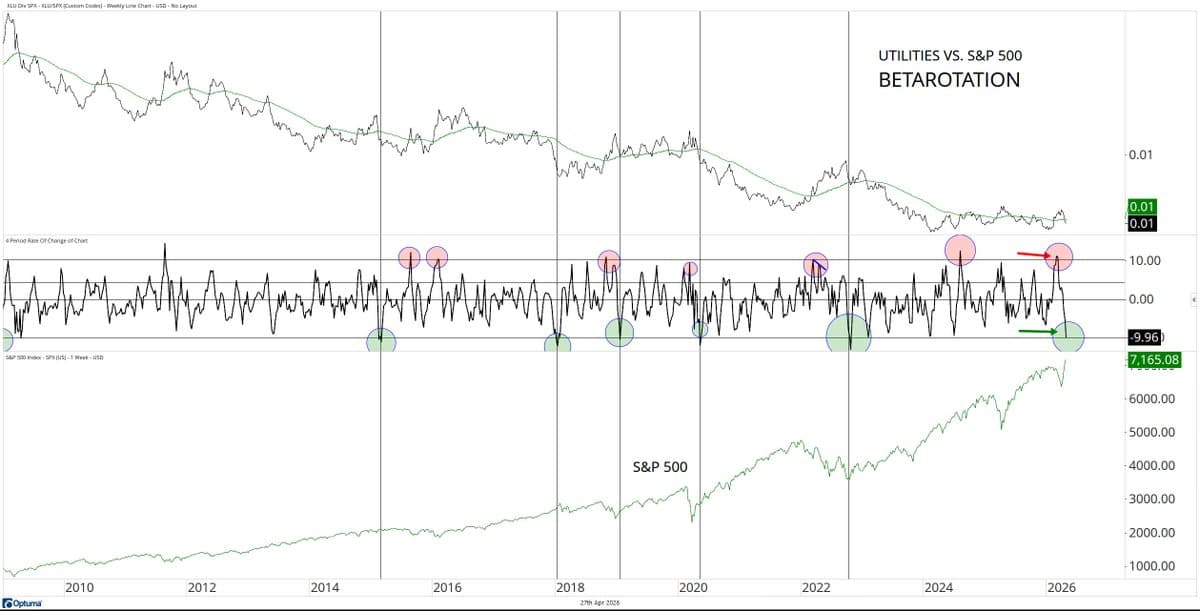
Beta Rotation Hits 3.5‑year Low, Signaling Risk‑on
the #betarotation model has fallen to its lowest level in 3.5 years, measuring the differential in the 4-week rate of change between utilities $XLU and the S&P 500 $SPX... (it's a risk-on signal)... https://t.co/F6oLjIXEhW
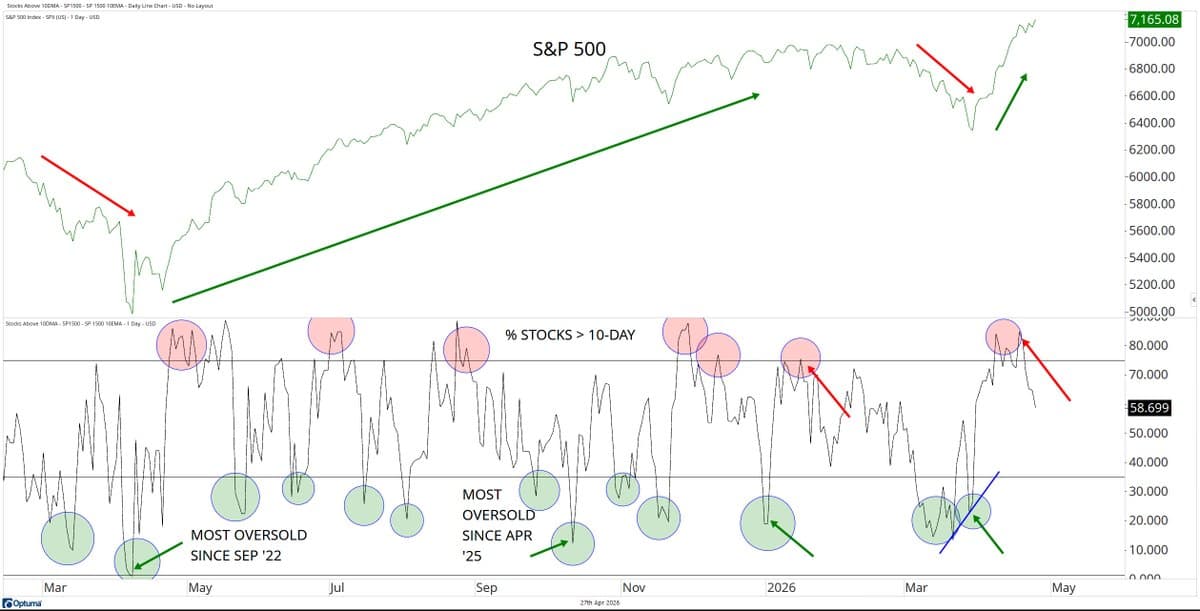
S&P 1500 Overbought: Majority Above 10‑Day EMA
although the market hasn't come in, we're working off the overbought condition, here with the % stocks in the S&P 1500 > 10-day EMA... #marketbreadth $SPX https://t.co/R2JvU6u1Fp
Large‑cap New Highs Outpace Lows 73 to 11
there are 73 large-cap stocks hitting the 52-week new highs list today... there are 11 large-cap stocks hitting the 52-week new lows list... #HighLowShow #marketUpdate #investing
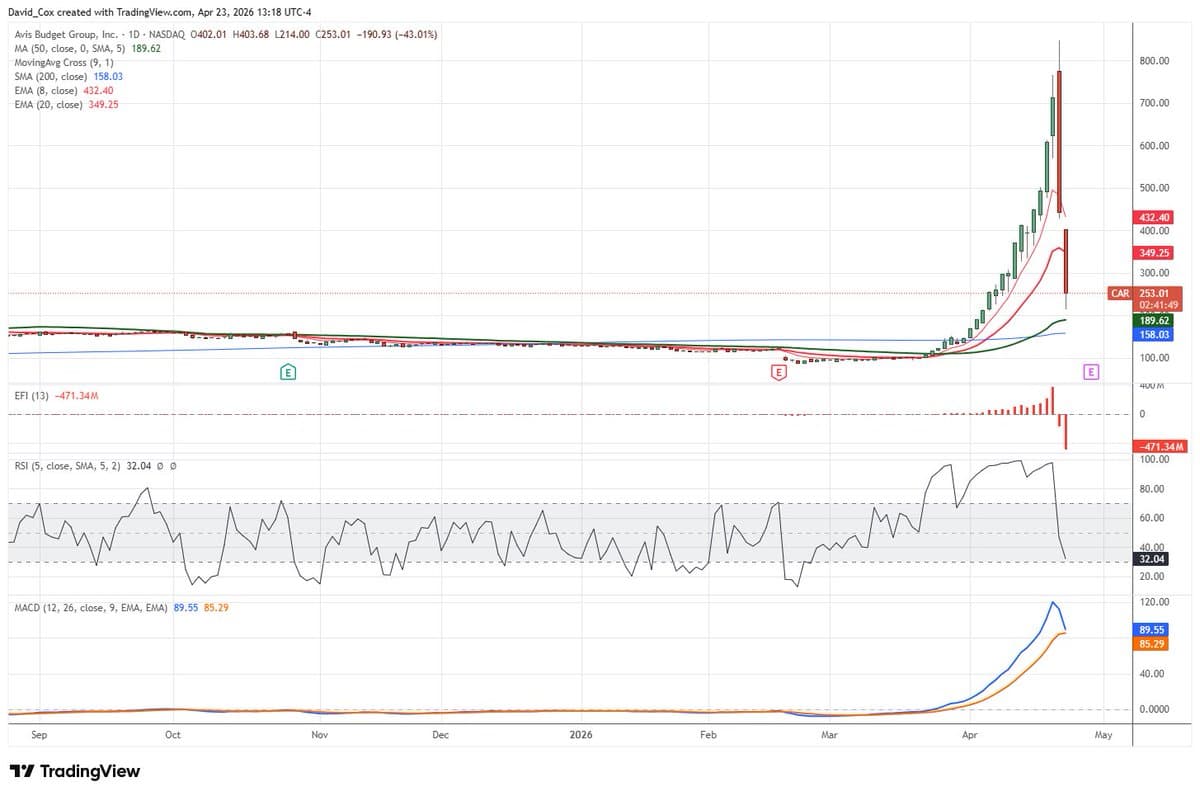
Avis Budget Shares Plunge 42%, 70% Below Yesterday's High
Avis Budget $CAR down -42.3% more today making is -70.1% from the highs (yesterday)... who's buying the pullback? https://t.co/j72u8A2HCd

Massive One-Day Loss on $16.8M Call Position
that size buyer of May 8th $750 Avis Budget $CAR calls that bought yesterday, traded ~$168.2/contract 1000 contracts * 100 shares = $16.8 million today, they closed at $31.95... value = $3.2 million... one day loss = -$13.6 million... 😳🥳🧐

From $100 to $714: Stock Surge Stuns Renter
firstly, i'm just a guy on the sidelines, having rented a car from Budget in the past year, but no $CAR ownership... but someone today stood in for 1,000 May 8th $750 calls? geesh... a month ago, the stock was...
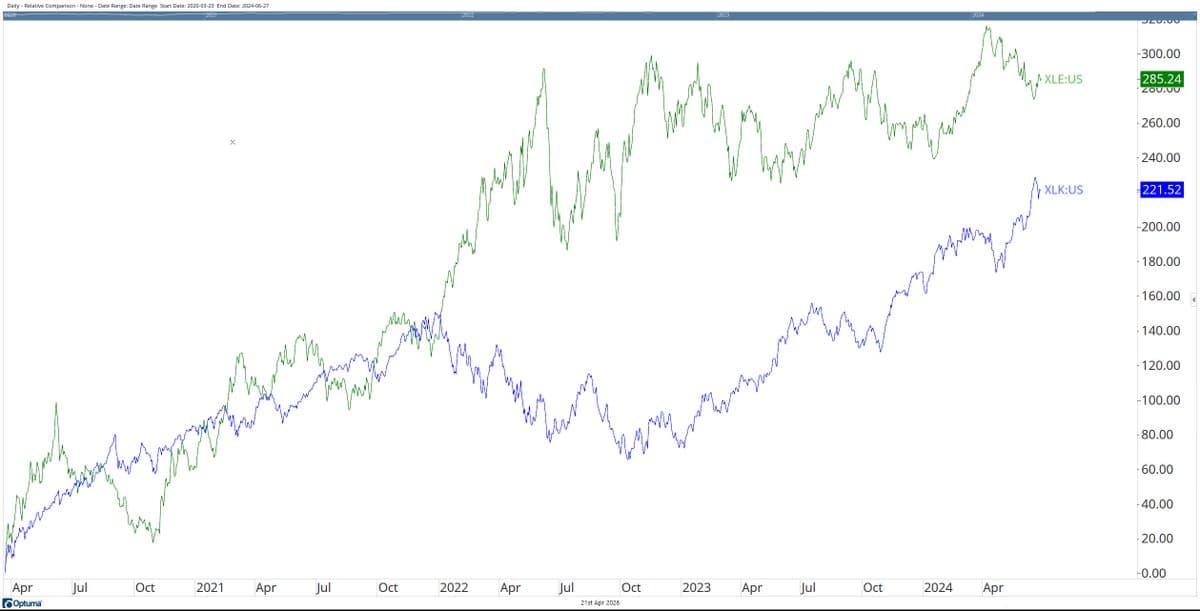
Energy Stocks Outshone Tech During COVID Lows
hindsight investing is easy... at the March 23rd, 2020 #COVID lows, tell me you thought it was so obvious that energy stocks $XLE would trounce technology $XLK stocks... so little attention is ever paid to the former... https://t.co/xVeusSNlCo
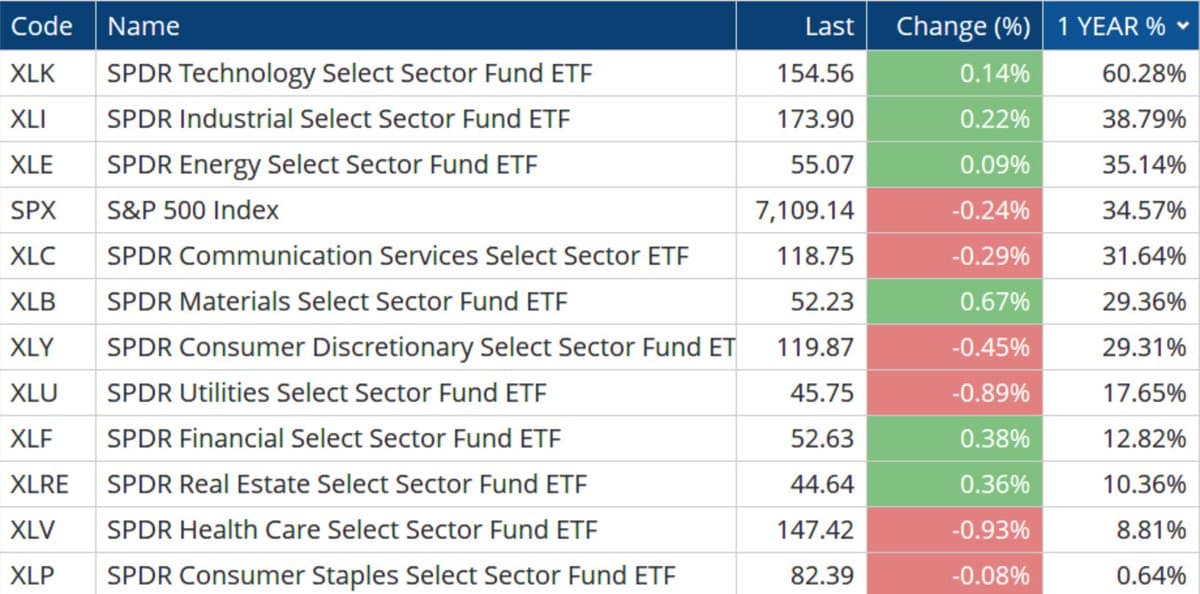
Tech ETFs Outpace Consumer Staples 94‑fold in One Year
technology $XLK stocks have 94x'd the consumer staples $XLP stocks in the past year... https://t.co/8p7GCceEWw
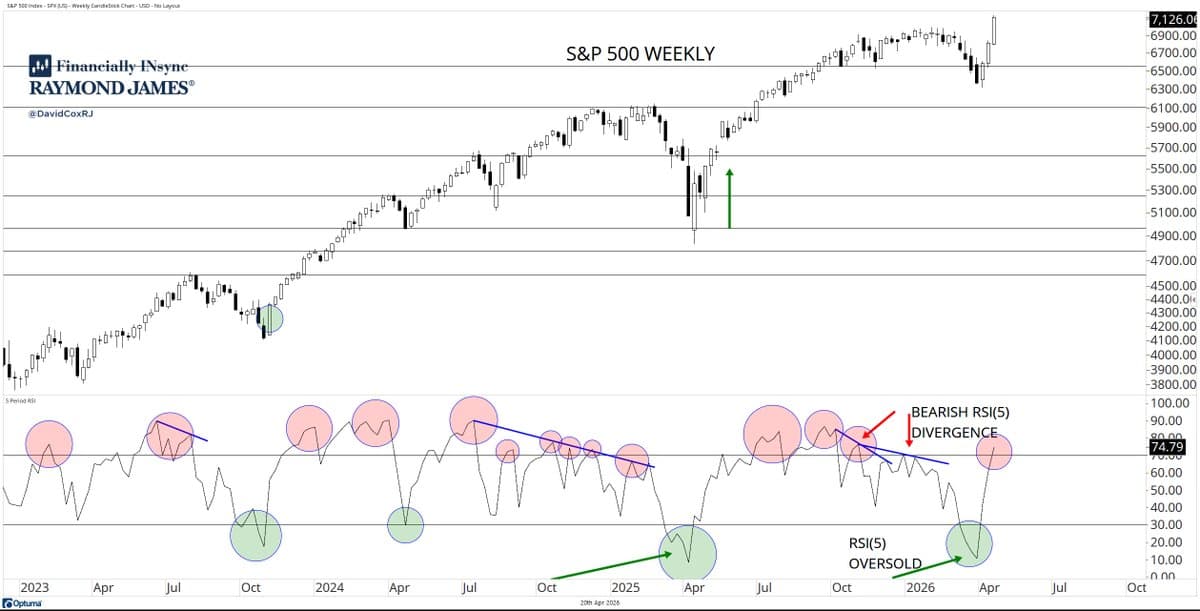
S&P 500 Weekly RSI Hits Overbought
we're starting the week with the S&P 500 $SPX RSI(5) overbought on the weekly chart for the first time in six months... https://t.co/sr1M1wKskc
BTC RSI(5) Oversold on 6‑Hour Uptrend Near $75K
Bitcoin #BTC $BTCUSD is RSI(5) oversold on the 6-hour chart in an uptrend... the last time was ~$70,500, currently sitting ~$75K... https://t.co/rha8rvTg7t

VIX's 44% Drop Marks Historic Volatility Crash
love being a part of history... the $VIX fall on March 31st was just the beginning, this time around... https://t.co/GSAP4s7rhK
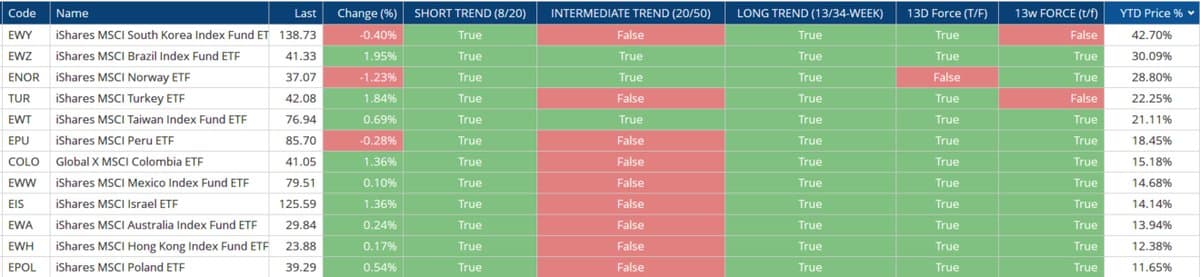
Top Global Country ETFs Ranked by YTD Performance
here are the top global country ETFs on my list, sorted by YTD % change: https://t.co/vz4eyxUvpW
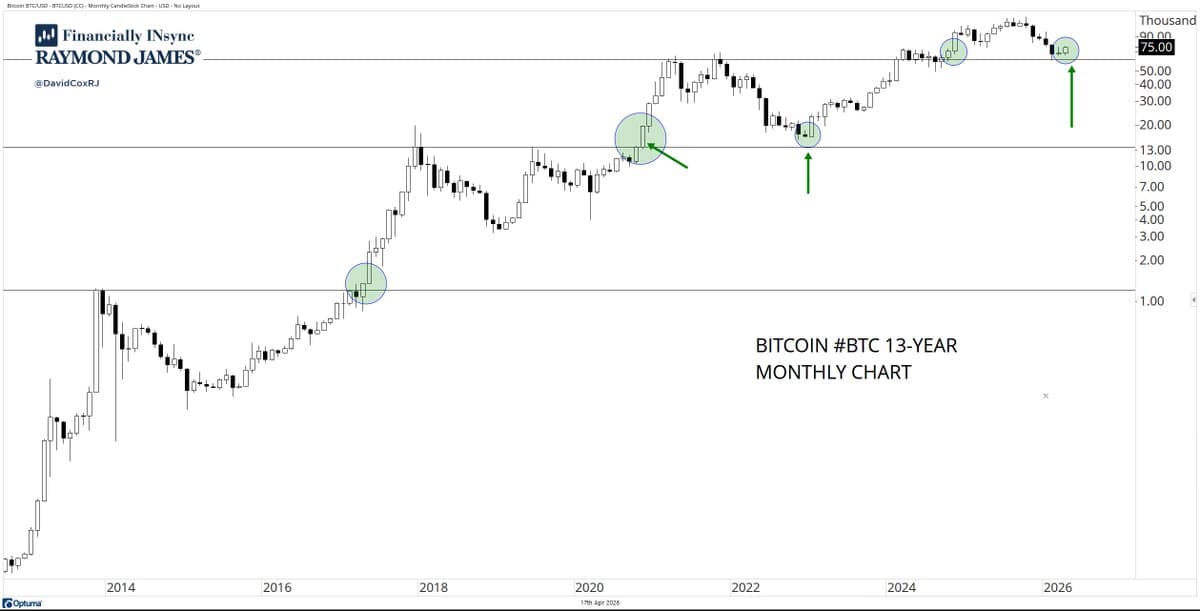
13‑Year Chart Reveals Bitcoin’s True Long‑Term Trend
Bitcoin #BTC $BTCUSD i realize everyone is always so zoomed in these days but this 13-year monthly chart provides perspective that the minute by minute charts simply cannot (imo)... https://t.co/EiDvPIgLZ9
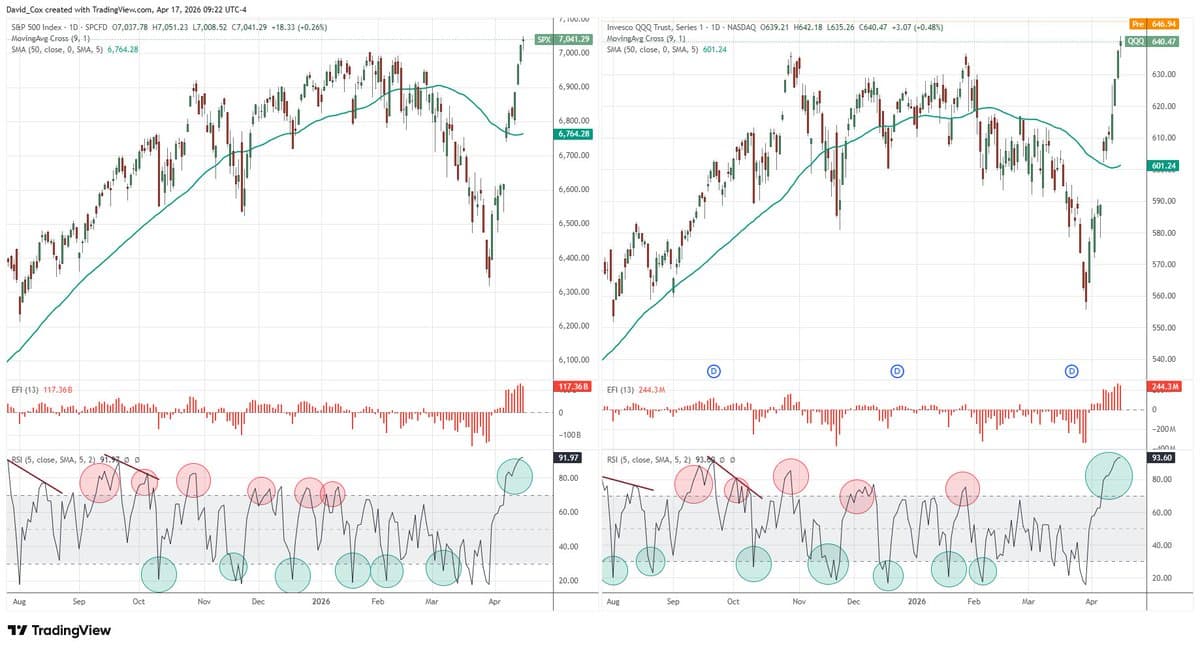
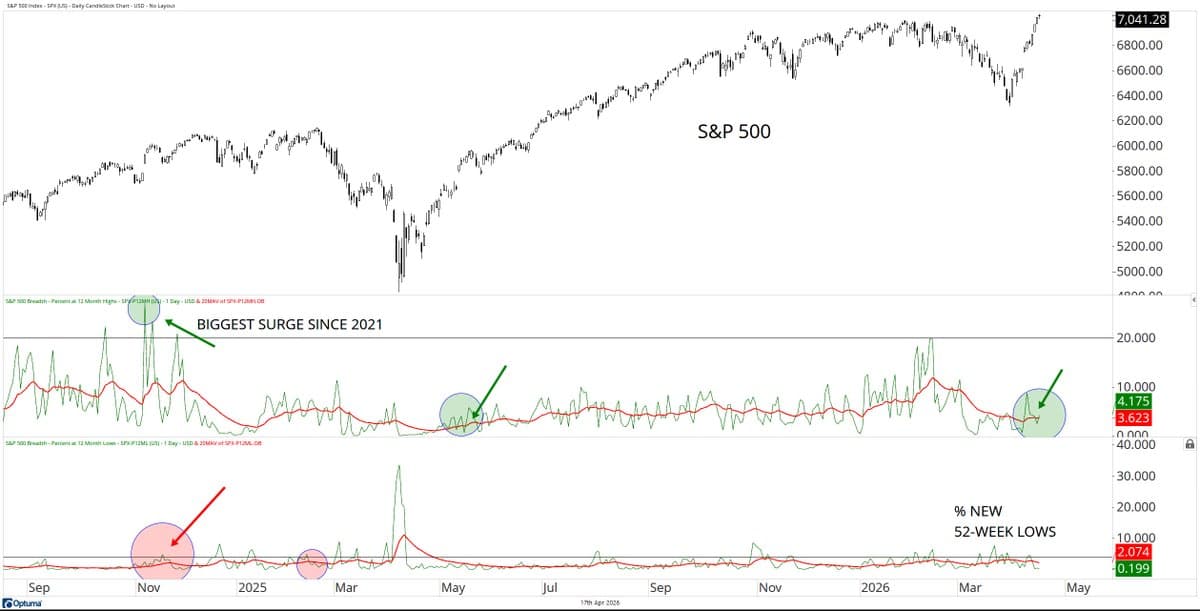
Short-Term Overbought After V Bottoms, New Highs Bullish
very (short-term) overbought after "V" bottoms... but let's not lose sight of the fact that new highs are bullish... $SPX $QQQ https://t.co/7M5QwcbrXV
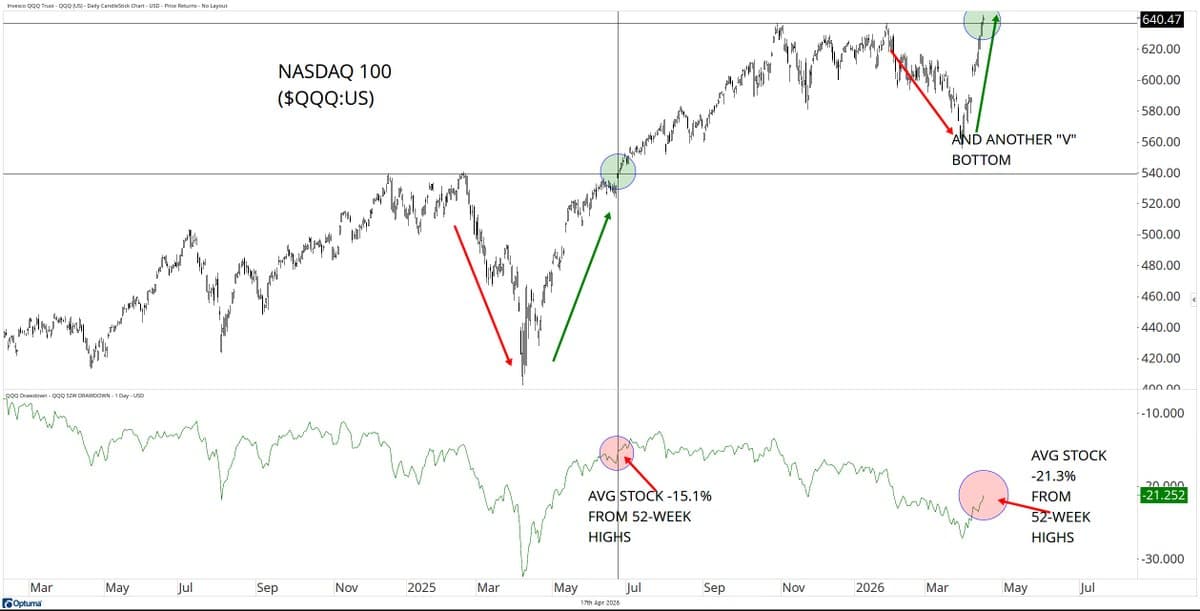
Nasdaq 100 Climbs While Average Stocks Lag Further
Nasdaq 100 $QQQ another "V" bottom and new highs made while the average $QQQ stock is -21.3% from highs... that might sound like a lot, but a year ago, when the market made highs after the "V", the average stock was...
Only 4% of S&P Stocks at Highs, Unchanged.
a lot of convo about so few stocks hitting highs vs. the market at highs... only ~4.2% of $SPX stocks at 52-week highs but wasn't very different a year ago either after the "V" bottom... https://t.co/DnQETcdNbm

IGV Stocks Lag Behind Tech and S&P 500
software $IGV stocks have been (known) laggards... still downtrending vs. technology $XLK sector... still downtrending vs. S&P 500 $SPX... https://t.co/CSVF7yxoha

Big Chocolate Makers Likely Buying the Cocoa Dip
who's buying the dip in cocoa prices? (i mean i hope @Nestle @Hersheys are)... https://t.co/57SRUqV4cu

Netflix Leads Portfolio with 24% Gain Buffer
Netflix $NFLX is our biggest #AllINsync position at ~7.4%... sitting with +24% cushion of gains heading into the report after buying off the late February lows... https://t.co/xqDQwmdagV

Energy Leads YTD Gains; Health and Staples Lag
the strongest YTD sector is energy $XLE +24.7% and it sits right beside health $XLV & staples $XLP as being below the 50-day average...

31 Large‑Cap New Highs, Only One New Low
there are 31 large-cap stocks hitting the 52-week new highs list today... there is 1 large-cap stocks hitting the 52-week new lows list... #HighLowShow #marketUpdate #investing

Uptrend Pullbacks Offer Prime Cash Deployment Opportunities
although my 50/200 $SPX model didn't quite reach that lower horizontal washout line, indicating solid intermediate-term pullback relative to long-term uptrend, the story is the same... pullbacks in uptrends are helpful for those trying to deploy cash... https://t.co/TheoptTSBK

Broad Market Buying, Yet Oil and Dollar Remain Weak
you can see that there has been buying everywhere, here is a daily/weekly #MACD & force index layout... i refer to my #doubledouble list, which is positive #MACD and postive 13-day force... only, oil/commodities/$DXY sitting double negative... #AssetWatch https://t.co/X3Xuvt6PU8

Canada’s EWC Outperforms U.S. Indices Amid Market Rise
as you look at the U.S. stock market rising, don't forget those relative trends, which favour Canada $EWC, no matter U.S. equal weight $RSP or cap-weighted $SPX https://t.co/50q7XPZYxo
Rates Promised Down, Borrowing Binge Persists
"they keep telling us the same thing. our governments’ and central bankers keep telling us that they’re going to bring interest rates down and know full well that the borrowing binge is a problem." our latest quarterly chit chat breaks...

RSI(5) Overbought: Expect Sharp Pullback Ahead
if you opted to not buy the annual weekly oversold sale on stocks & also neglected the short-term daily oversold conditions and now wondering if it's too late, i'll point out that indeed, we're RSI(5) overbought after this rather sharp...

V‑bottoms Went From Odd to Almost Mainstream Since 2018
i'm old enough to remember when we used to call "V bottoms" unusual... since 2018, they've become "almost" typical...

GDX Overbought Yet Stuck in Neutral Trend
gold stocks $GDX are RSI(5) overbought on the daily and are NOT in an uptrend (lower lows) but that doesn't mean they're in a downtrend (they're NOT because there isn't a lower high)... https://t.co/FGu5lmhg15

SMH Semiconductor Stocks: Detailed Trend Analysis Across Timeframes
here are all the semiconductor $SMH stocks and their short, intermediate and long-term trends, % 200-day and force conditions (daily/weekly)... slow down. take it all in. there is lots to see... https://t.co/oYG4SmavIh

Semiconductor ETF SMH Outperforms SPX and XLK
the semiconductors $SMH remain a VERY strong group relatively over many years... here's my current @Optuma bubble chart of the constituents... x-axis: 12-month % change y-axis: 3-month % change [spot the $SPX, then spot the $XLK, then spot $SMH and visual the eye...

FICO Shares Face Sustained Seller Pressure, Downtrend Persists
Fair Isaac $FICO was strong but sellers emerged in front of the score change stuff that was announced mid-last year... the trend of sell strength vs. buyer demand has continued, perpetuating the ongoing downtrend... https://t.co/UmkbRazFRE

Post‑Trump Market Surge Driven by Energy, Industrials, Tech
the stock market has been happy since Trump was elected... the strongest sectors since then #SectorWatch energy $XLE, industrials $XLI, technology $XLK, communications $XLC and even the utilities $XLU, helping the yield thirsty and providing a nice balance... https://t.co/nAMqyO8nRi

TSX Rallies While Gold Shows Exhaustion in Downtrend
we all know the Canadian $TSX stock market has been strong (absolutely & relatively), and i remind us that gold $PHYS has been stronger... [but gold has also has shown signs of exhaustion and in a lower highs/lower lows weekly...