
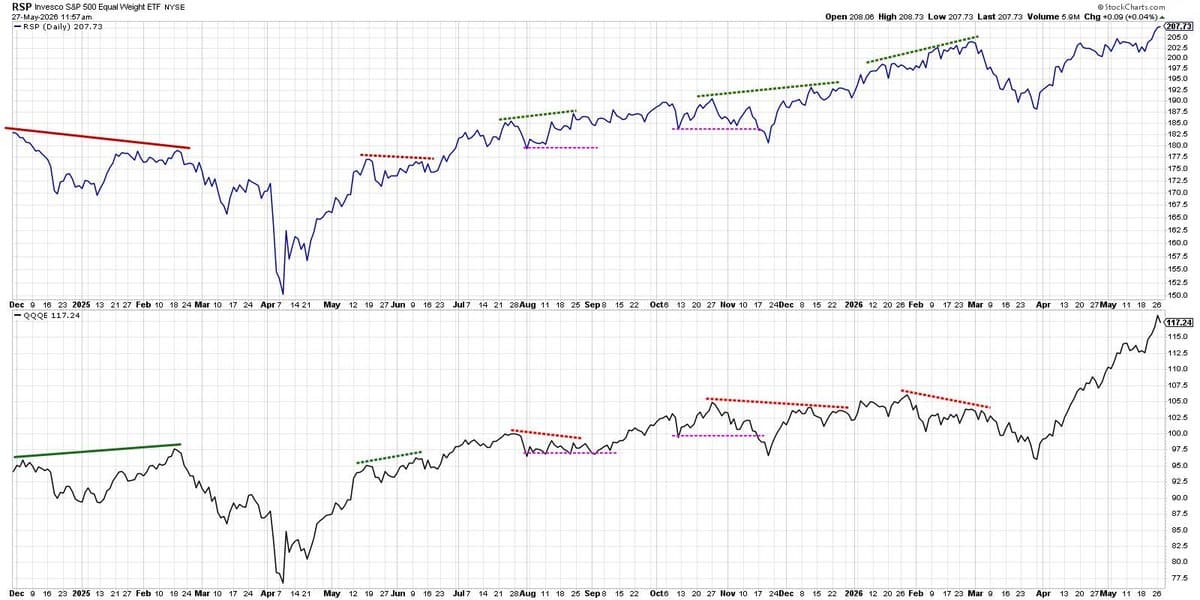
Dow Theory Signals Bullish Month as EW Indices Hit Records
New Dow Theory confirming a bullish phase this month, with both the equal-weight $SPX $RSP and equal-weight $QQQ $QQQE making new all-time highs. "The most bullish thing the market can do is go up." https://t.co/tCgfgd3j67
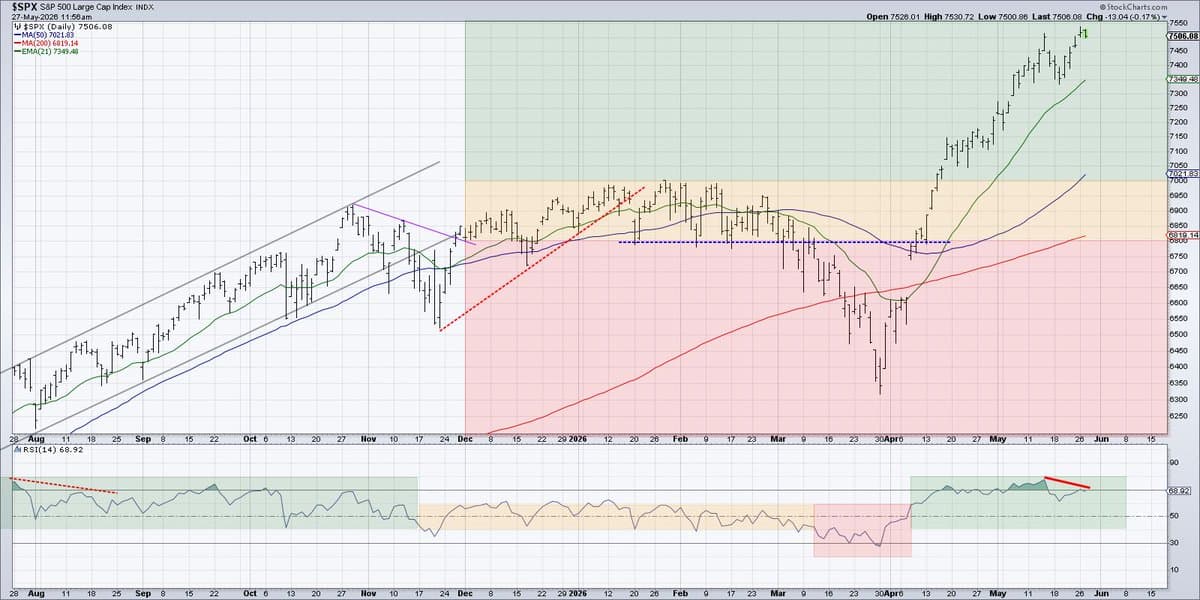
Potential Bearish Momentum Divergence Threatens SPX Rally
Detecting a potential bearish momentum divergence for $SPX... how much of an issue will that be? https://t.co/bOGaKTyfHO
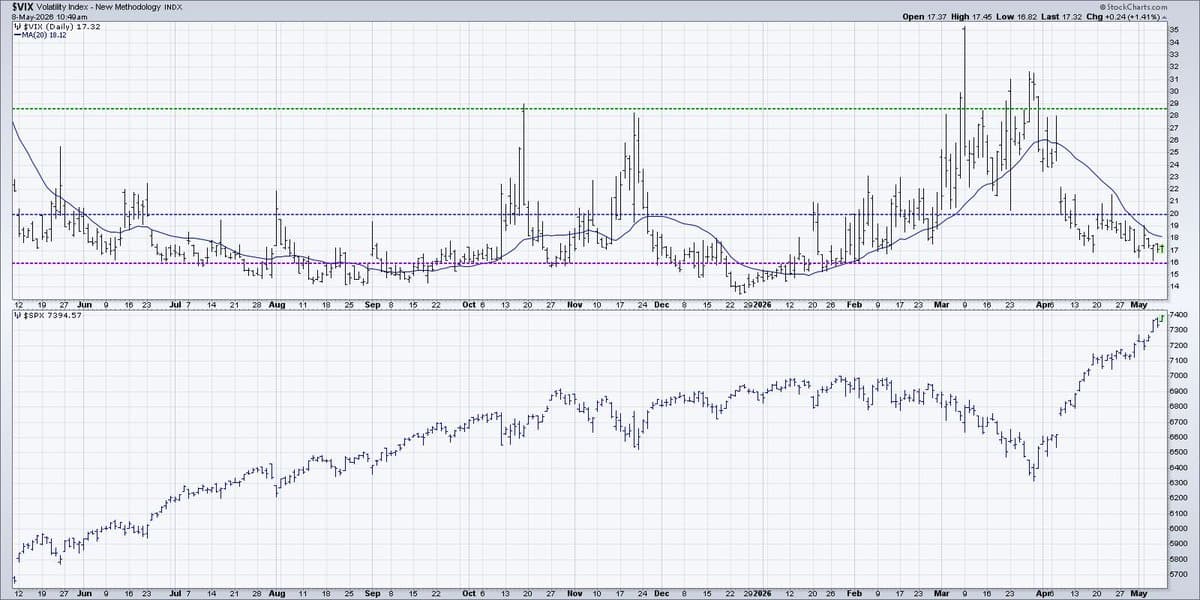
Low VIX Signals Calm Amid Market Panic
Investor: "OMG what's happening in the Middle East? Are interest rates back up? What about crude oil? Wait the jobs number came in strong, what now?!?" $VIX: "Dude. Just chill out." $VIX < 20 = "Please disperse, there's nothing to see here."...
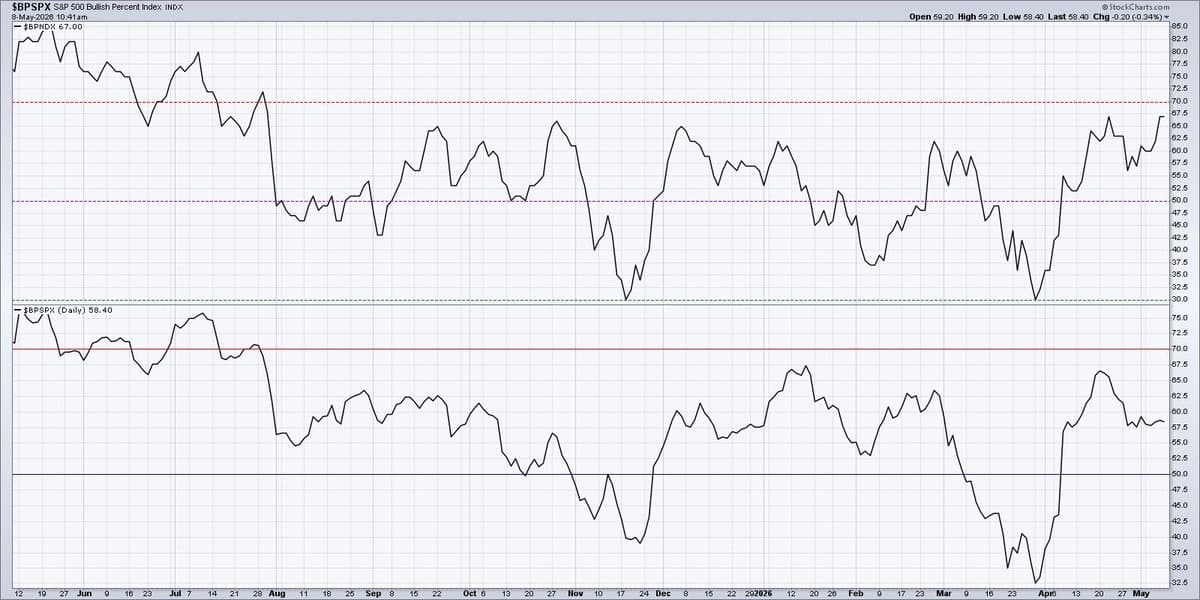
Large‑Cap Growth Breakouts Power May Gains, Not Broad Market
Bullish Percent Indexes are breadth indicators based on point & figure charts. So far in May, $BPNDX has moved higher while $BPSPX has remained sideways. Conclusion: breakouts in large cap growth are driving recent gains instead of a...

Volume Signals Big Moves in Emerging Uptrends
One technique I’ve probably underused over the years? Volume. In today’s video I explain why “power days”- big moves on big volume- can be such an important clue during emerging uptrends. https://t.co/TL5NzTgeF7
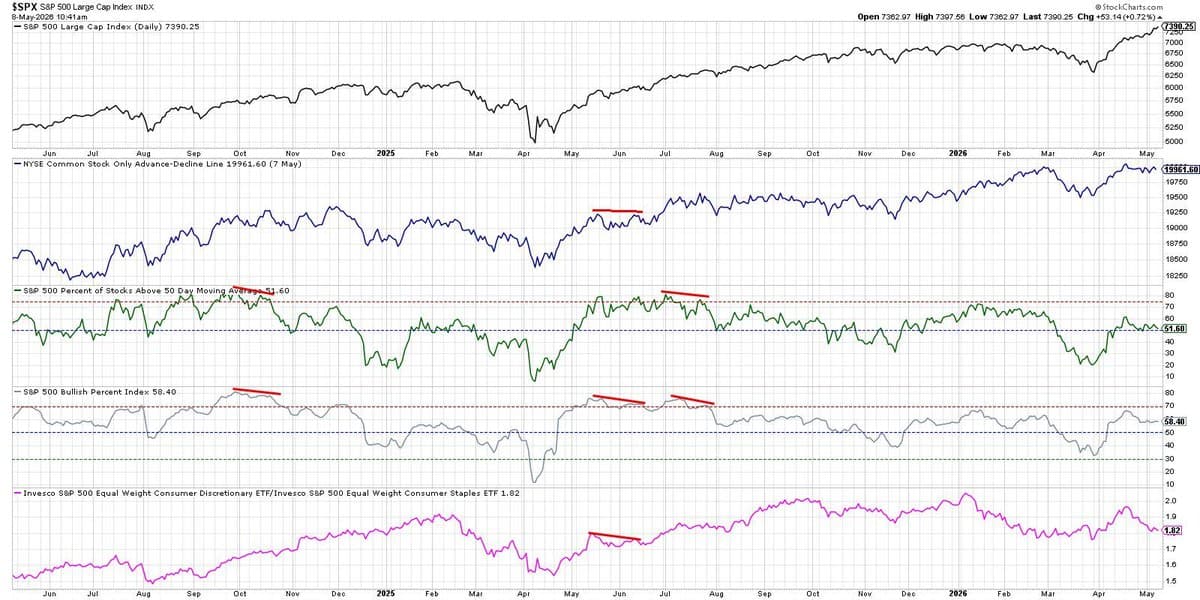
SPX Hits Record, Yet Market Breadth Weakens Significantly
While the $SPX has made a new all-time high in May... 📉 the NYSE advance-decline line has been drifting lower 📉 less $SPX members are above their 50-day MA 📉 Bullish Percent Index has gone down 📉 defense $XLP is outperforming offense $XLY https://t.co/iuUdTnHwvG
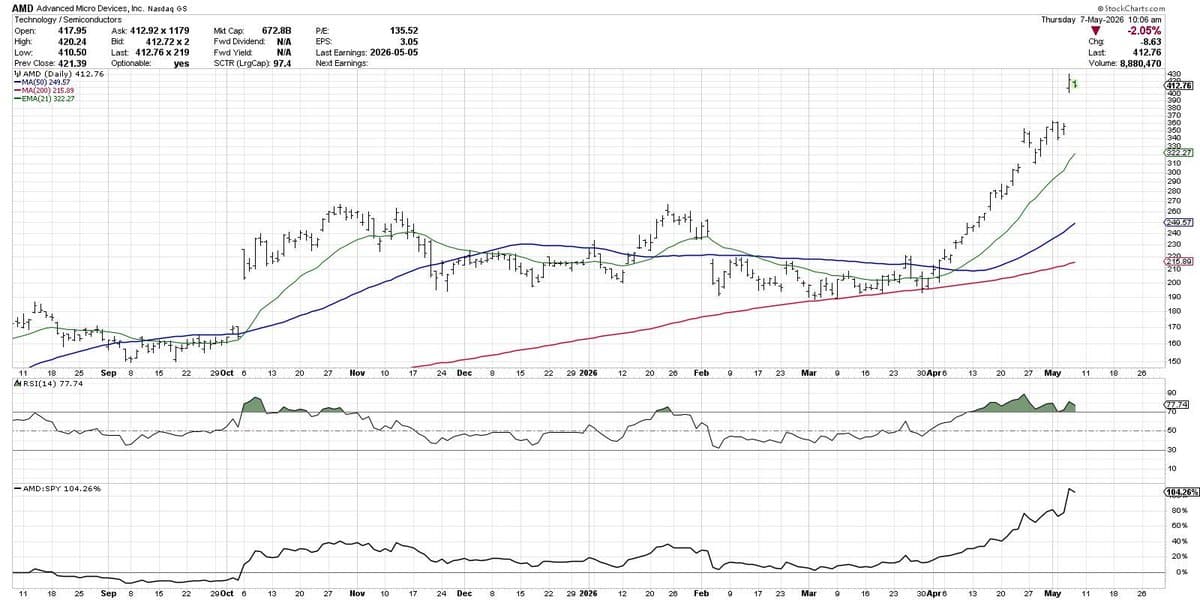
AMD Gaps Higher on AI Euphoria, $360 Support Key
Impressive gap higher for $AMD post earnings, confirming that AI euphoria is alive and well in May. Will we see a "gap and run" as additional buyers come in? Or a "gap and fail" as investors are thrilled...
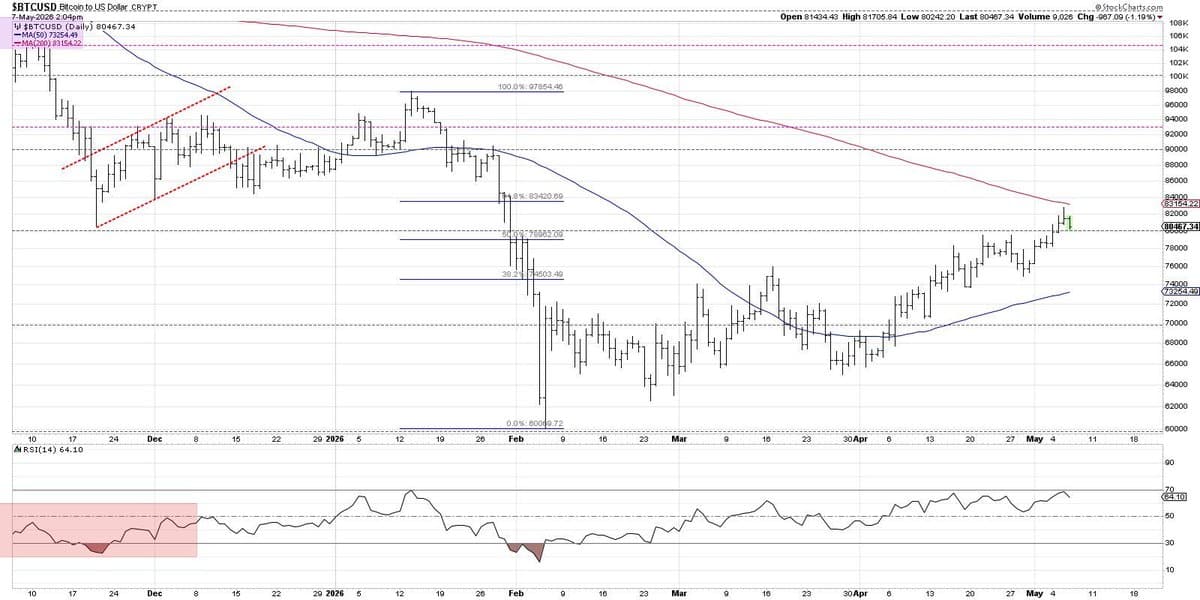
Bitcoin Rebounds 35%, Eyes 200‑day MA Near $83K
#Bitcoin has now gained about 35% off its February low. It has overcome the 38.2% and 50% retracement levels, and now faces the "ultimate" test of the 200-day moving average as well as the 61.8% retracement around 83K. ...
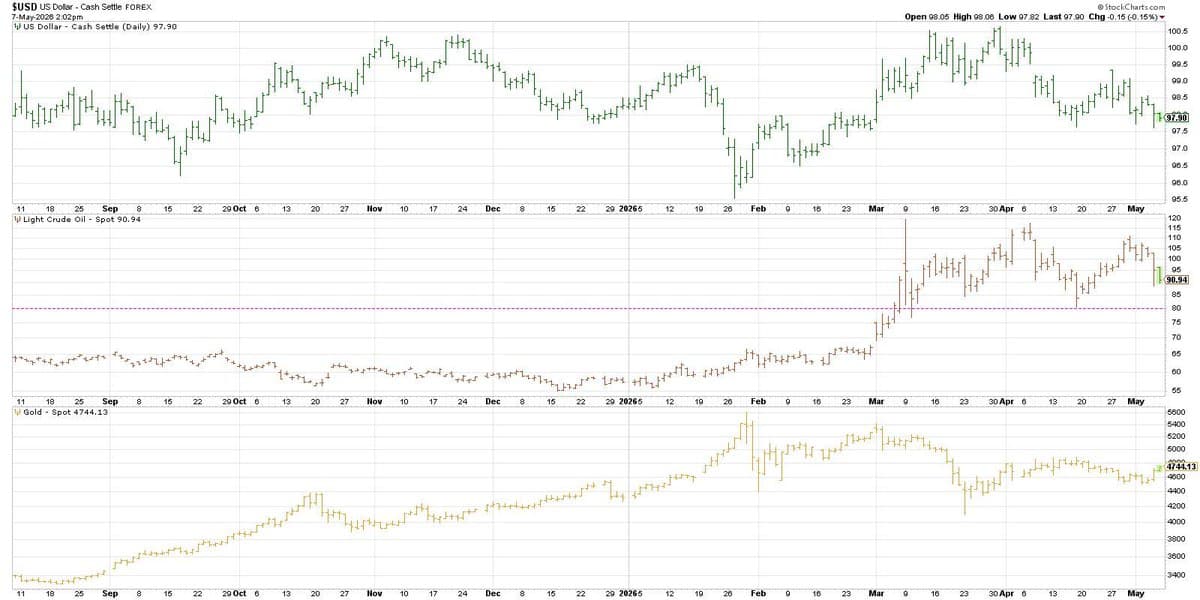
Post‑Conflict Shift: Dollar and Oil Down, Gold and Stocks Up
Well, the post-conflict playbook seems pretty straightforward: 📉 Weaker US Dollar $USD 📉 Weaker crude oil $USO 📈 Stronger gold $GLD 📈 Stronger stocks $SPX But how orderly of a rotation would this be?... https://t.co/v0gH0FDkW3
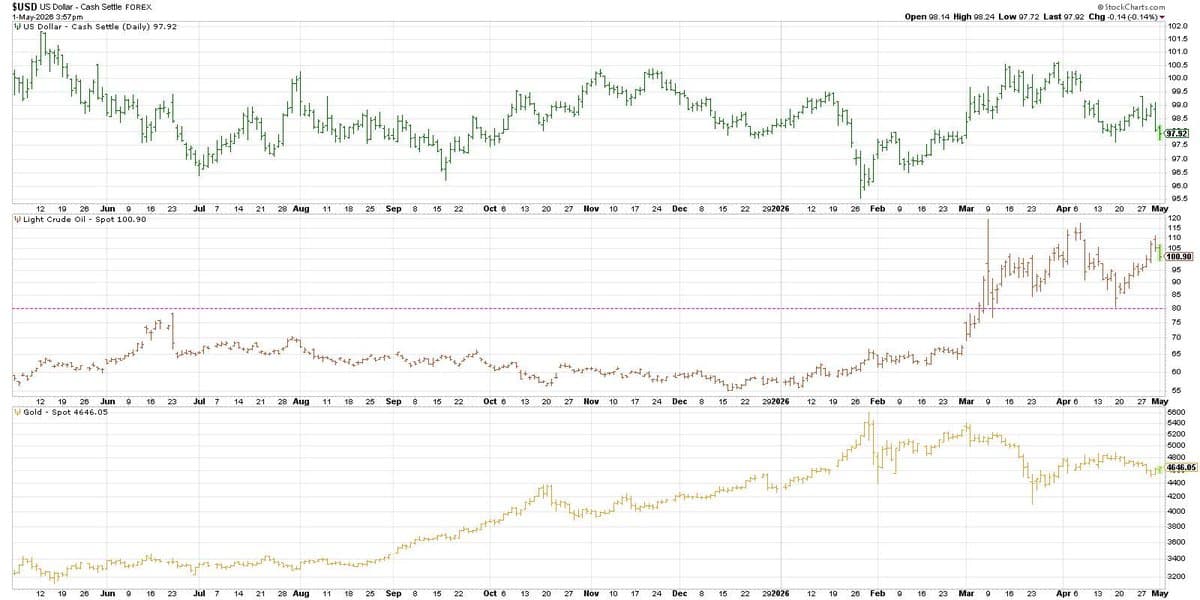
April's Weaker Dollar Signals Shift to Risk‑Off
Biggest shift in market dynamics in April? Weaker US Dollar. Stronger $USD in February and March provided an important signal of rising risks, and a weaker $USD in April suggests risk-off vibes from the currency markets. At...
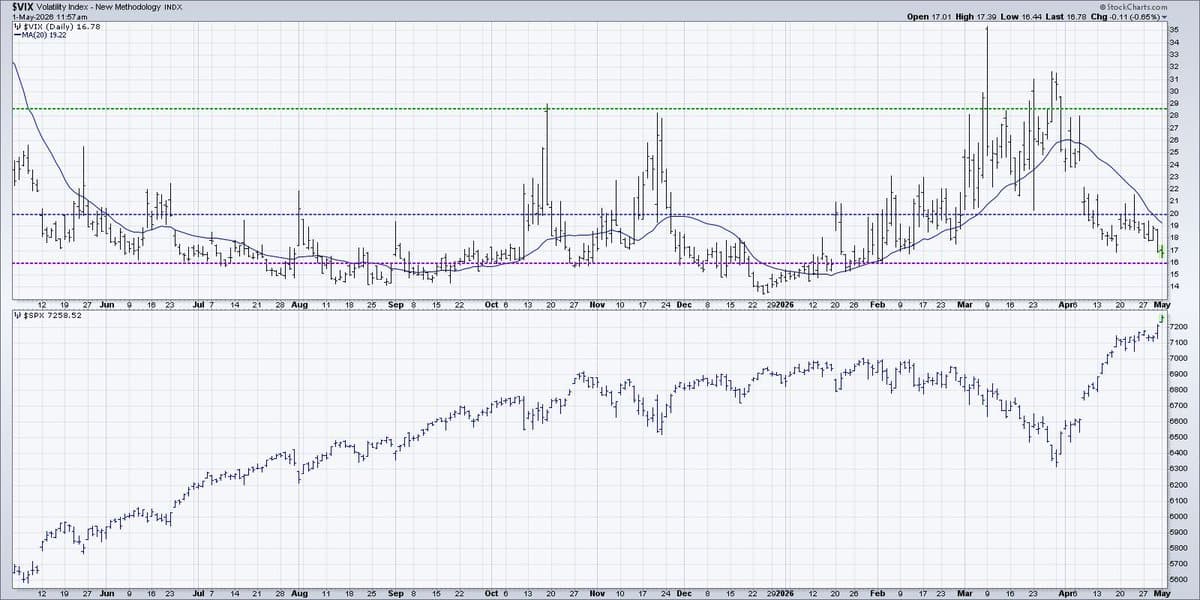
VIX Under 20 Signals Low Volatility and Low Risk
As long as the $VIX remains safely below 20, the options market is telling us: low volatility = low uncertainty = low fear = low risk https://t.co/GyE0OQZLAM

Spot Absorption: Smart Money’s Pre‑Breakout Signals Revealed
Ever notice how a stock explodes the exact moment you get exhausted and sell? It feels personal, but it’s actually mechanical. While the crowd is "giving up" during a sideways range, the Composite Operator (the Smart Money) is quietly checking off...
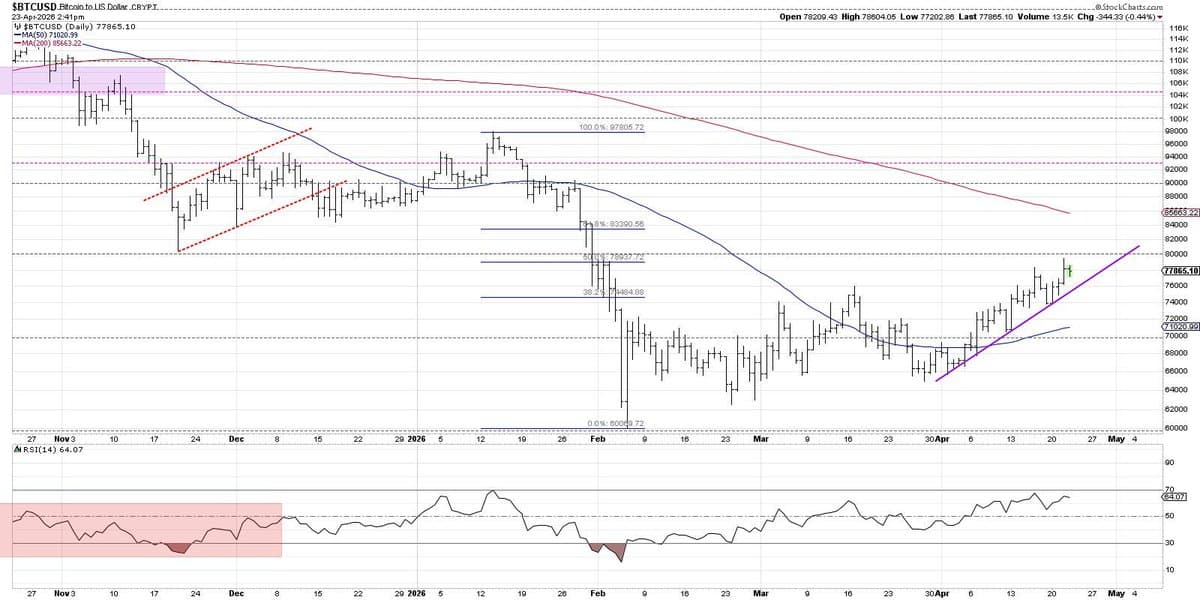
Bitcoin's March Trendline Holds, Uptrend Persists
For me, trendlines provide a visual representation of the pace of the trend. As long as #Bitcoin remains above trendline support from the end of March, this is a pretty clear uptrend phase IMO. But if that trendline is broken......
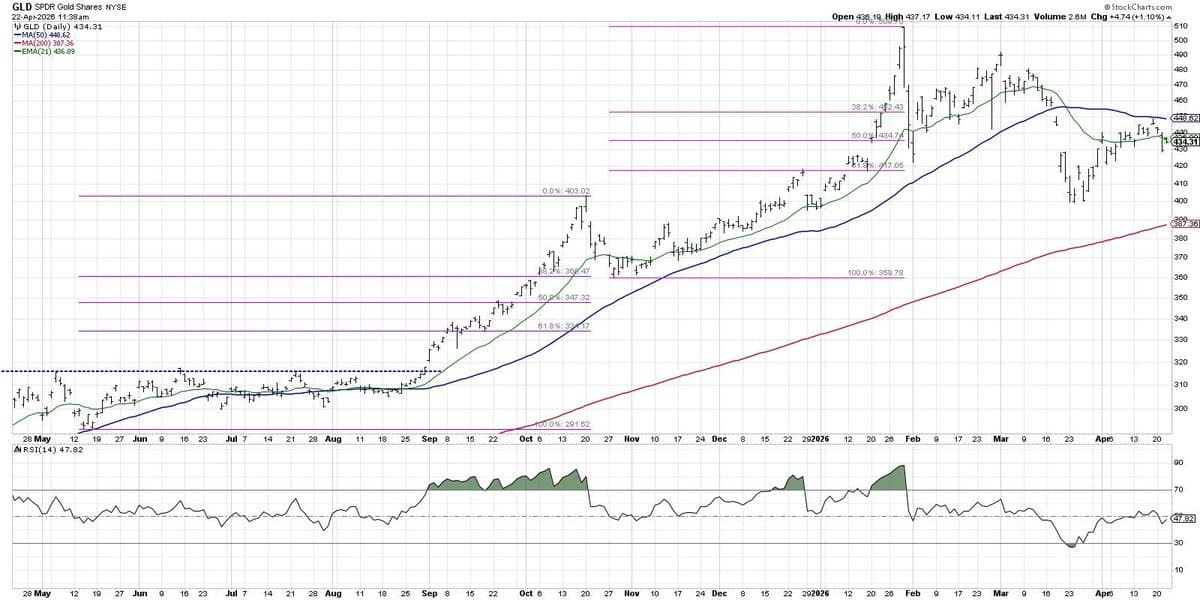
Gold and Miners Signal Lower Highs, Momentum Wanes
#Gold and gold miners $GDX appear to be confirming a lower high, with $GLD failing to overcome a declining 50-day moving average. Momentum on this last upswing was dismal, with the RSI failing to get much above 50. March...
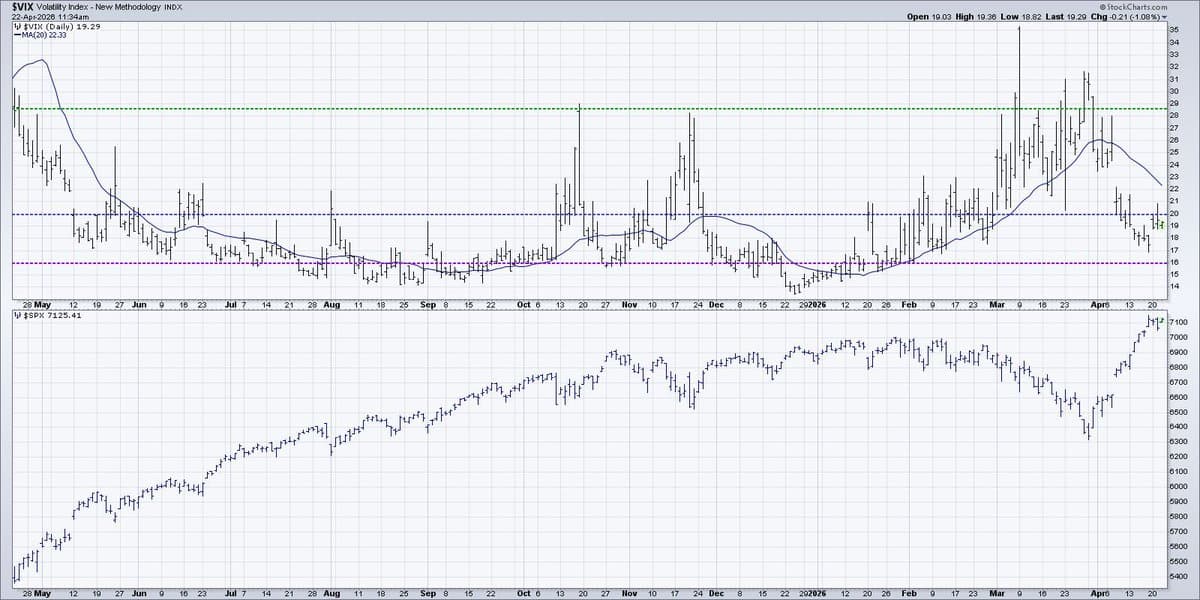
VIX Near 20, Low Volatility Fuels SPX Upside
I'm seeing the $VIX pushing up against the crucial 20 level, but remaining generally below it this week. $SPX over 7K on lower volatility makes a strong case for further upside. Any spike in $VIX over 20 would mean...