
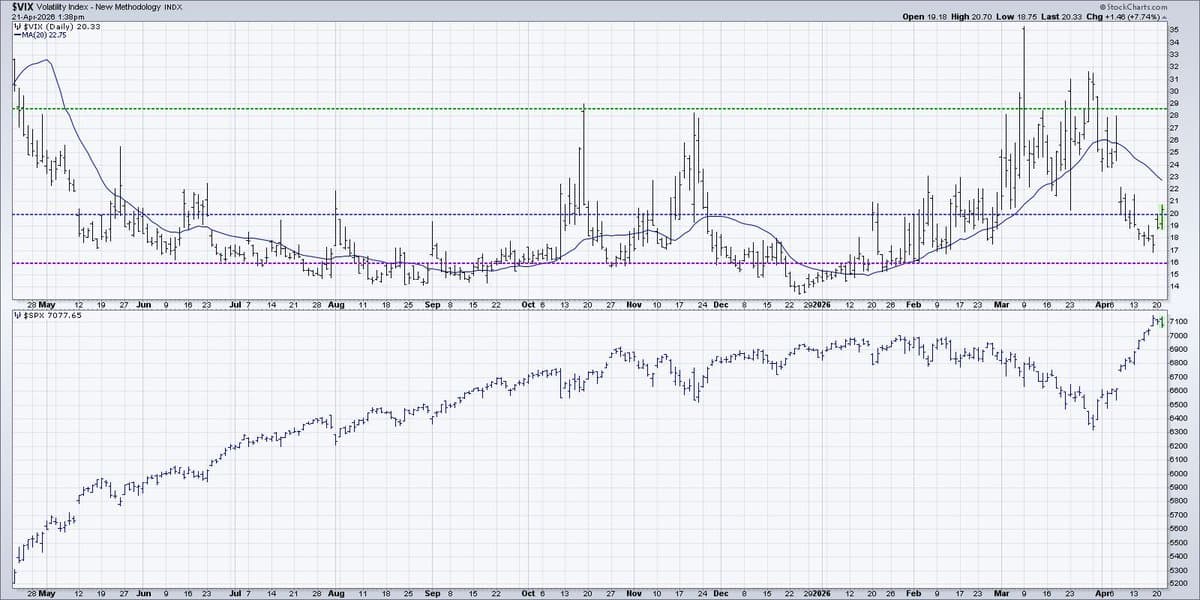
Complacency in Low VIX Leads to Unexpected Turn
Dave on April 9th: "It's ok because the $VIX is back below 20." Dave on April 13th: "It's ok because the $VIX is still below 20." Dave on April 15th: "It's ok because the $VIX is still below 20." Dave on April 17th: "It's ok because the $VIX is still below 20." Dave on April 20th: "It's ok because the $VIX is still below 20." Dave on April 21st: "Uh oh....."

Spot Emerging Market Leaders with Strength‑Based Strategies
Today’s market may be showing pockets of strength, but where is the real leadership emerging? That’s a question a lot of investors are asking right now, and it’s exactly what I’ll be covering live on April 22 at 1:00 PM...

SPX Sets Record, Bitcoin Surpasses $75k
$SPX just hit a new ALL-TIME HIGH above 7100! 📈 Meanwhile, #Bitcoin is finally clearing $75k as risk appetite returns to the tape. 🚀 I'm also answering your questions on "Coil" patterns and music theory in today's Friday MAILBAG. 📊🎶🎺 CHART...

STX Poised for Major Breakout From Triangle Pattern
$STX close to a major league breakout to resolve a symmetrical triangle or "coil" pattern. Price has been in an equilibrium since end of Jan. A breakout to the upside could change the picture big time. https://t.co/KNFuckXlkp

Apple Tests 200‑Day Support Amid Mag7 Weakness
$AAPL is the latest Mag7 stock to negotiate with its 200-day moving average. Most of the Mag7 have failed to hold this crucial level of price support. Will $AAPL follow suit this week?... https://t.co/EUg1Bro2TV

NDX Bullish Percent Index at 30% Signals Nasdaq Bounce
$NDX Bullish Percent Index touched the 30% level on Monday, which usually means at least a short-term bounce higher is imminent for the Nasdaq. https://t.co/57UyvAJ0ou

Breadth Spike Near 30% May Trigger Short-Term Rally
We're getting close to 30% of $SPX members above their 50-day MA. Even if the longer-term trend continues bearish, bombed out breadth conditions like this can lead to short-term upside reversals. https://t.co/pCLd1WlCZh

SPX Weekly Close: Above or Below 200‑Day MA?
Poll question of the day... Does $SPX finish the week above or below its 200-day moving average?

When Price and Earnings Momentum Align, Opportunities Soar
Price momentum and earnings momentum are not the same thing... but the best opportunities often happen when they align. Alex Carteau @EpsMomentum joins me on the pod to talk about timing, earnings gaps, and post-earnings drift. Worth a watch. ...

Risk‑Off Signals Rise, Yet Core Market Levels Hold
Today felt like a textbook risk-off session. Weak GDP revision. VIX back above 20. Short-term breadth rolling over. Dollar up. Rates pushing toward 4.3%. Oil surging. In CHART THIS I walk through what’s actually changing — and what isn’t. Six viewer questions. Clear levels. No drama. Watch...

Treasury Yields Surge, Inflation Concerns Resurface
"Inflation isn't a problem at all." Ten Year Treasury Yield: "Hold my beer." 🍺 One of the biggest shifts from February to March? $TNX bounced of support at 4.0% as rates move higher as prices appear to be 📈. https://t.co/Y10UC0y7lL

NAAIM Exposure Index Drop Signals Bullish Market
NAAIM Exposure Index down from 100% in mid-December to 67% in mid-March. Seems bullish to me! $SPX https://t.co/e0bywZknAH

Live Market Recap: SPX, QQQ Rally at 5pm ET
We're going LIVE today at 5pm ET / 2pm ET for our daily market recap show, CHART THIS with Dave Keller. Excited to break down the latest charts and market observations as $SPX and $QQQ rallied hard into the...
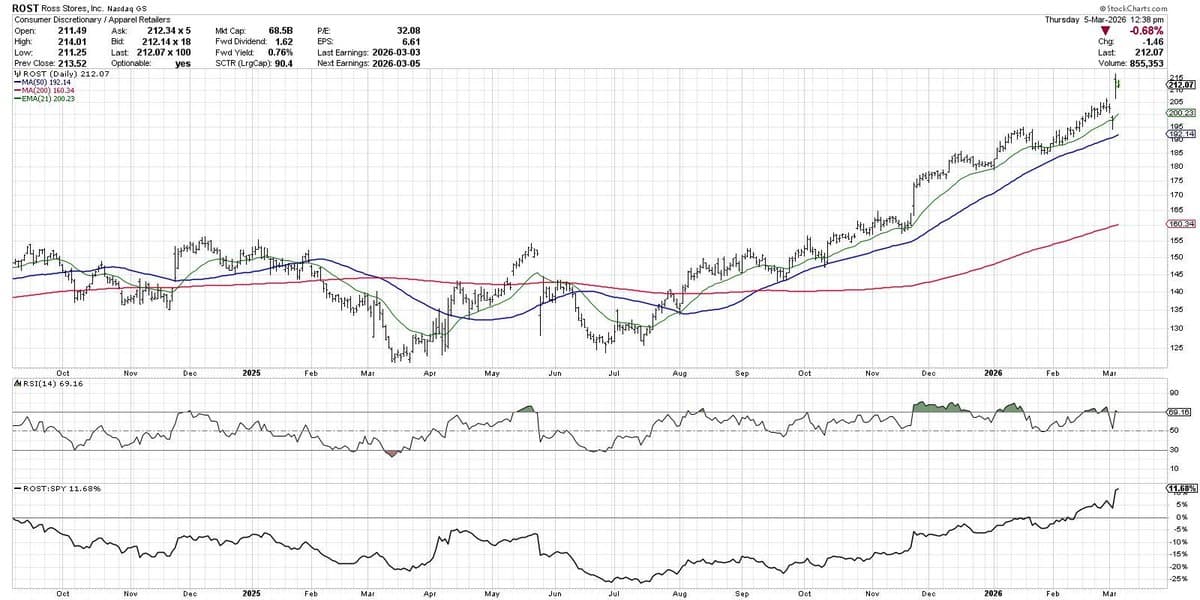
Continuous Upward Trend Defines Bullishness for $ROST
Bullish charts keep going up. And when they stop going up, that's no longer bullish. But if they don't stop going up, then they don't stop being bullish. $ROST https://t.co/hHdgbWj9aO

Amazon's $AMZN: Breakout Above 225, Breakdown Below 200
$AMZN > 225 = breakout above all the moving averages $AMZN < 200 = breakdown of key support $AMZN between 200 and 225 = 💤 https://t.co/GbWTIoHDaR

Sideways S&P Hides Stock and Bitcoin Breakout Chances
The $SPX is stuck in a sideways range… but that doesn’t mean there aren’t opportunities. Today I break down: $AMZN and $TSLA bouncing $LRCX momentum divergence $AVGO earnings reaction #Bitcoin reclaiming 70K $MRNA and $LYB trend shifts Full episode of CHART THIS: https://t.co/VhhjxmCKSs
S&P Holds 6800 Support as VIX Surges to 28
The "Fog of War" hit the tape today. 🌫️ $SPX salvaged support at 6800 after a brutal open, but the $VIX spiking to 28 is a major red flag. I’m also honoring the late legend John Murphy and applying...
Key March Technical Themes: Breakouts, Earnings Setups, Decision Points
Top 10 charts I’m watching for March 👀📊 My latest show on @StockCharts TV covers some key technical themes: ✅ Stocks that have already started to break out (like $MPC and $JBL) 👀 Big earnings setups with divergences (hello $TGT) ⚖️ Magnificent 7 at...

Gap‑and‑fade Day Signals Risk Despite Flat SPX
Crude oil spiked, $VIX pushed > 20… and $SPX finished basically flat. What does a “gap-and-fade” day say about risk? Plus: credit spreads, oil overbought signals, $NVDA at the 200D, and #Bitcoin teasing 70K. https://t.co/OFf21HIk5V https://t.co/0TzcIDfamB
Price Is All That Matters, Says Market Technicians
“The three most important indicators are price, price, price.” Clint Sorenson explains how technicians cut through narratives and stay aligned with what the market is actually doing. Our latest episode of the Market Misbehavior podcast is now live. https://t.co/G8eAZWdOcL https://t.co/HlZFSdvMf7
S&P 500 Stuck 6800‑7000, Breakout Imminent
We bounced today… but we’re still trapped between 6800 and 7000 on the S&P 500. I’m watching: 📈 $NVDA into earnings 📈 $AMD near key support 📈 Yields drifting lower 📈 $VIX back under 20 This range is going to resolve soon. Full breakdown: https://t.co/wvDXift1wY

Risk‑Off Wave Hits Financials, Sets Stage for NVDA
We started the week in full risk-off mode. $XLF broke support near 51, $MSFT continues to deteriorate, and $SPX is back testing 6800. Meanwhile gold surged and Bitcoin broke down. I walk through financials, defensive rotation, and key levels ahead of $NVDA. Watch...
S&P 500 Rebounds Above 6900, Tech Leads Rally
$SPX closed back above 6900 to end the week. $GOOGL $AMZN and $NFLX powered the rally, silver surged 8%, and I tackled viewer questions on $CAT entries, $MSFT Fibonacci risk, $ENPH breakout and the Hindenburg Omen. Full CHART THIS Mailbag: https://t.co/HpUIXN5kHi https://t.co/AiL2WR6RDf
High Valuations Test Market Resilience in 2026
Markets flat near the highs + valuations near the upper end of history. Tom Martin of Globalt breaks down what that actually means—and what could sustain (or break) it in 2026! Our latest episode of the Market Misbehavior podcast: https://t.co/nA9bmU87rf...
SPX Flat While DE Soars, Oil Breaks Out, COIN Spikes
$SPX is still stuck between 6800 and 7000. But under the surface, $DE exploded higher on earnings, $CVX and $COP broke out with crude oil, and $COIN is showing amplified volatility vs #Bitcoin. Here’s what I’m watching next: https://t.co/bQnwyKMJeh https://t.co/v7DLLL1mYC
Calm S&P Masks Turbulence, 2026 Stock Picker’s Market
“The S&P looks calm… but underneath, it’s churning like crazy.” Great convo with @GinaMartinAdams on concentration risk, price-to-sales extremes, and why 2026 may be a stock picker’s market. 🎙️ Latest episode of the Market Misbehavior podcast: https://t.co/6P2xtsblvM https://t.co/tohQDT7fRk

Confirm Bearish RSI Divergences with Price Levels Before Acting
Bearish RSI divergences can hint at a major top — but only if price & key levels confirm. Momentum can fade while price still grinds higher. Patience & confirmation are essential. My latest article on @StockCharts: https://t.co/sDlIJ3WADG

2026 Macro Outlook: Resilient Momentum Amid Inflation Leaks
New episode 🎙️ Rob Haworth (U.S. Bank Asset Management) joins me to break down 2026 macro: resilient momentum, inflation + earnings “leaking” through the system, tariffs, geopolitics, Fed uncertainty, and what to watch if rates spike. https://t.co/OPTdLbcGgJ

Defensive Sectors Lead as Market Turns Bearish
Defensive rotation continues. Utilities and real estate led again, $VIX closed above 20, and my short-term trend model flipped bearish. I also answered questions on holding through earnings ($MAR), #Bitcoin correlation, and what makes a trader great. Watch here: https://t.co/dJtLYZYHoz

S&P Slides, Apple & Cisco Plunge, VIX Tops 20
Tough session today. $SPX opened higher but rolled over hard. $AAPL -5% $CSCO -12% and the VIX closed back above 20. Meanwhile utilities and staples pushed higher. I walk through the key support levels and what breaks the trend next:...

Markets Defensive as SPX Stalls Below 7000
Markets turned more defensive Tuesday as early strength faded... In today’s CHART THIS: • $SPX stuck below 7000 • Bonds rally on weaker retail sales • $GOOGL below the 50-day • $AVGO trapped between key MAs • Earnings: $KO $MAR $GILD $HOOD CHART THIS -> https://t.co/pHGfUwqPar
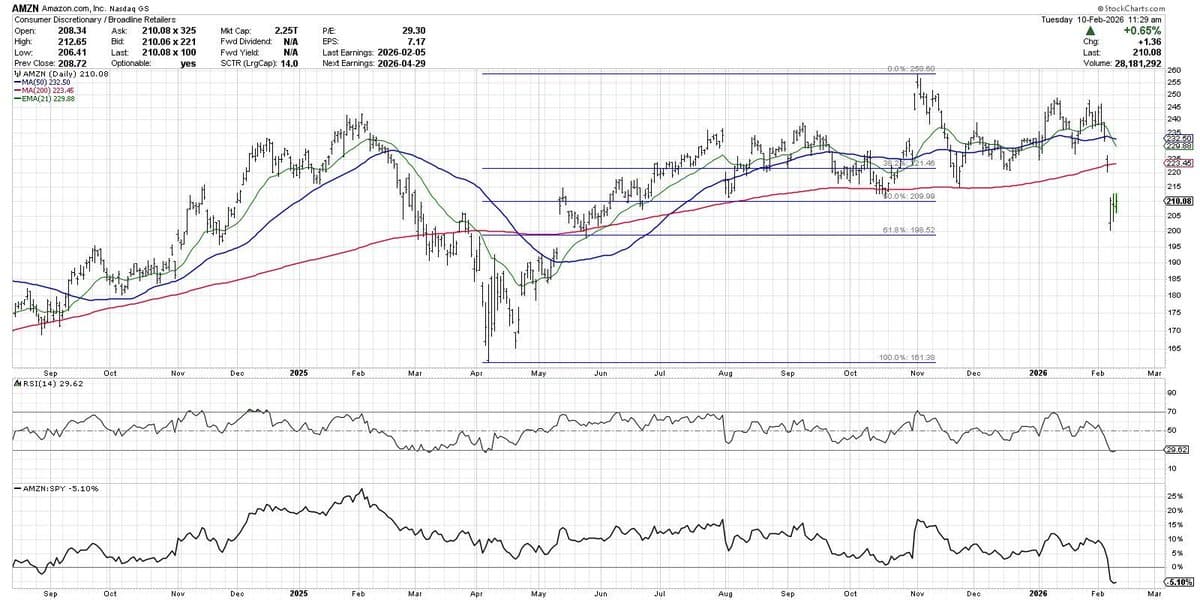
Amazon Steadies; Rally to 200‑day MA Signals Trade
$AMZN is holding steady after the gap frenzy last week. A rally back to the 200-day moving average would make sense for the bulls and the bears, but that feels more like a "trade" to me. The real question...
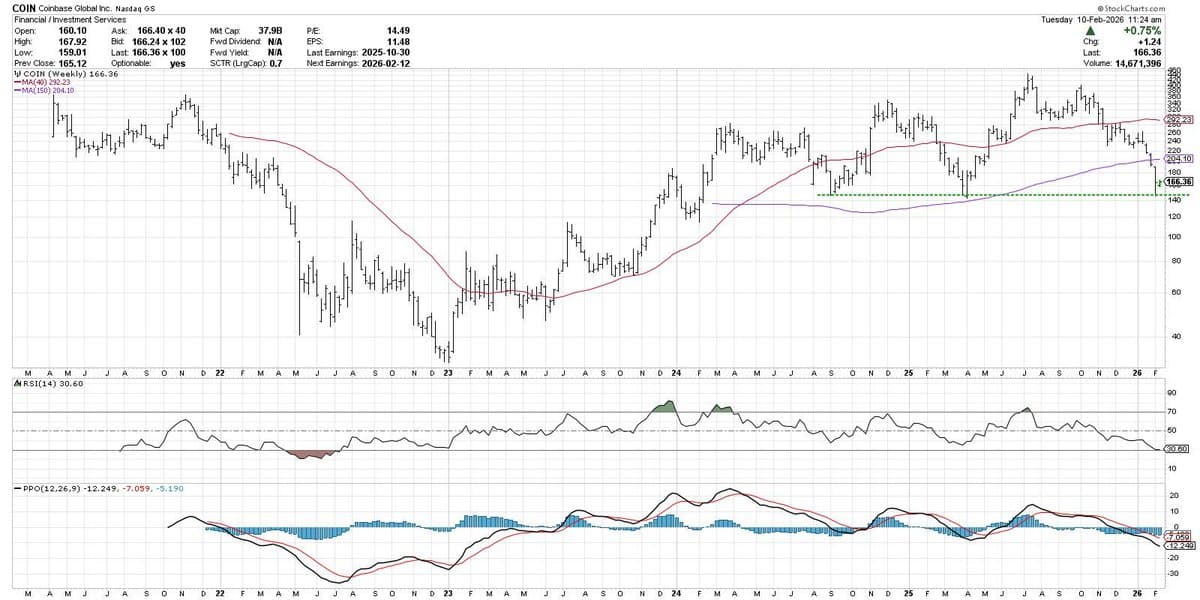
COIN Bounces Off $145 Support, Aligns With Low Targets
Can't help but notice $COIN is bouncing off major league support around $145, lining up well with the Sep '24 and Mar '25 lows. Previous lows have been confirmed with a bullish crossover from weekly PPO. But dang...

Tech Rebounds, Commodities Surge as Growth Revives
Markets pushed higher to start the week, but the rotation underneath the surface is telling a more interesting story. Tech bounced, commodities ripped, and growth showed signs of life again. In today’s CHART THIS, I walk through $SPX just below 7000,...