
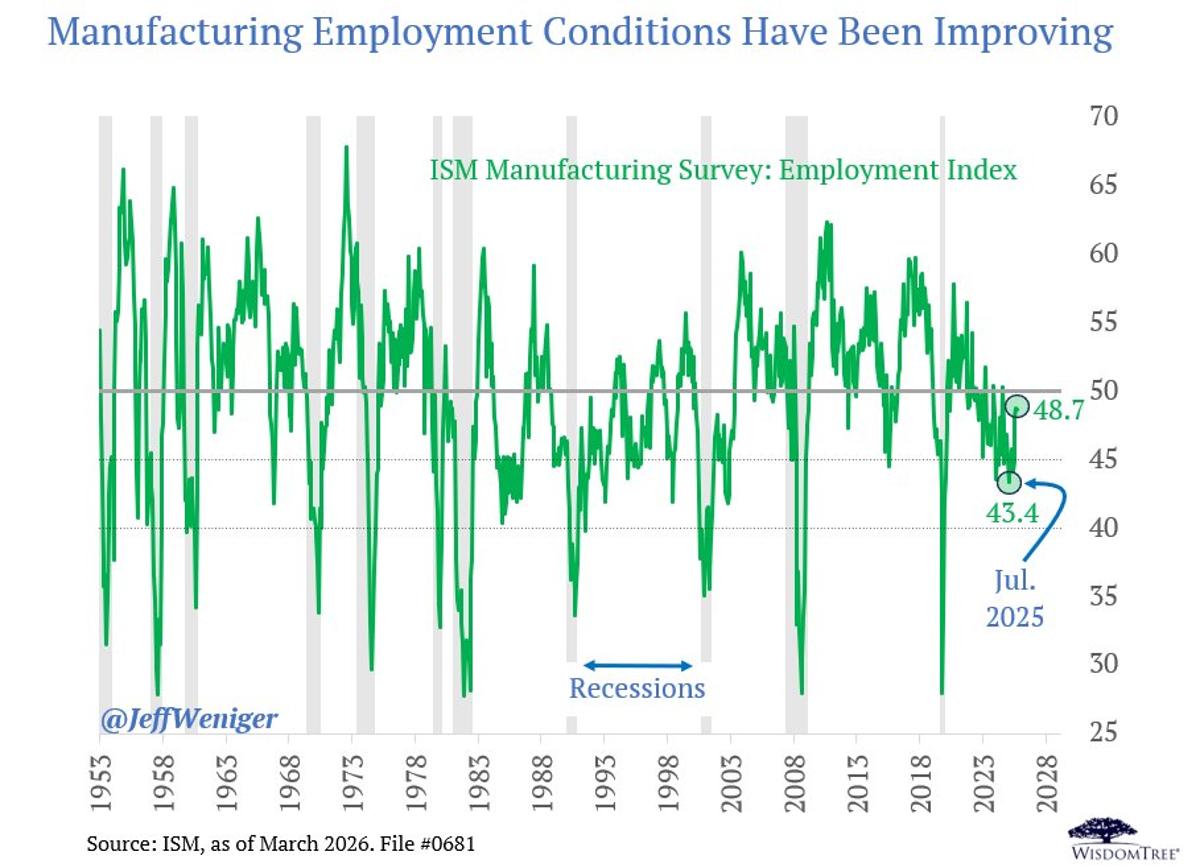
ISM Manufacturing Employment Signals Lower 2026 Recession Risk
The Polymarket recession odds for 2026 are 36%. I believe that is an overestimation. Consider the employment component of ISM Manufacturing. It bottomed nine reports ago, at 43.4, and is on the mend. This index often breaks below 40 for recessions; today it is 48.7. https://t.co/i3GOSGFORM

Dollar Gains Boost Discretionary, Energy, Industrials, Materials
Sector work, 12/31/1989 - 3/31/2026. We find a strong relationship between US dollar direction and four specific sectors: 1) Discretionary 2) Energy 3) Industrials 4) Materials Not necessarily in that order. How to read the table: "Tallying all the months when the dollar index went up over...

Modern Trucks Get More Miles per Wage Hour
The oil "shock" in retail diesel is nothing of the sort. A heavy-duty truck can drive 42.3 miles on the amount of diesel that can be purchased with this country's average hourly wage of $32. In 2008, an hour of...

Quality Factor's Historic Underperformance Poised for Sharp Reversal
Try to remember that just 3 months ago we were in the middle of the most bizarre underperformance by the Quality factor this century. Almost 1999 on the performance gap. Historically, when this chart snapped, it snapped hard the other...

Ares Capital 17% Plunge Predicts Major S&P Drops
This chart is unique. Ares Capital, the BDC, has been clobbered, falling 17%. Previous dumps in ARCC saw dumps in the S&P 500 too. Other periods that saw ARCC fall 17% or more witnessed S&P declines of 9%, 28%, 22%,...

Manpower Employment Outlook Peaks at Highest Since 2022
The Manpower Employment Outlook Survey just jumped to its highest level since Q3/2022. They surveyed 41,700 employers in 42 countries. https://t.co/rs7Dv4XiH6

Today's Wages Cut Gas‑cost Work Hours Dramatically
In coming days, if gasoline is $4, $5, $6 per gallon, you will want to remember this chart. It is how many hours you have to work to afford driving your car 10,000 miles, which is how much someone may...
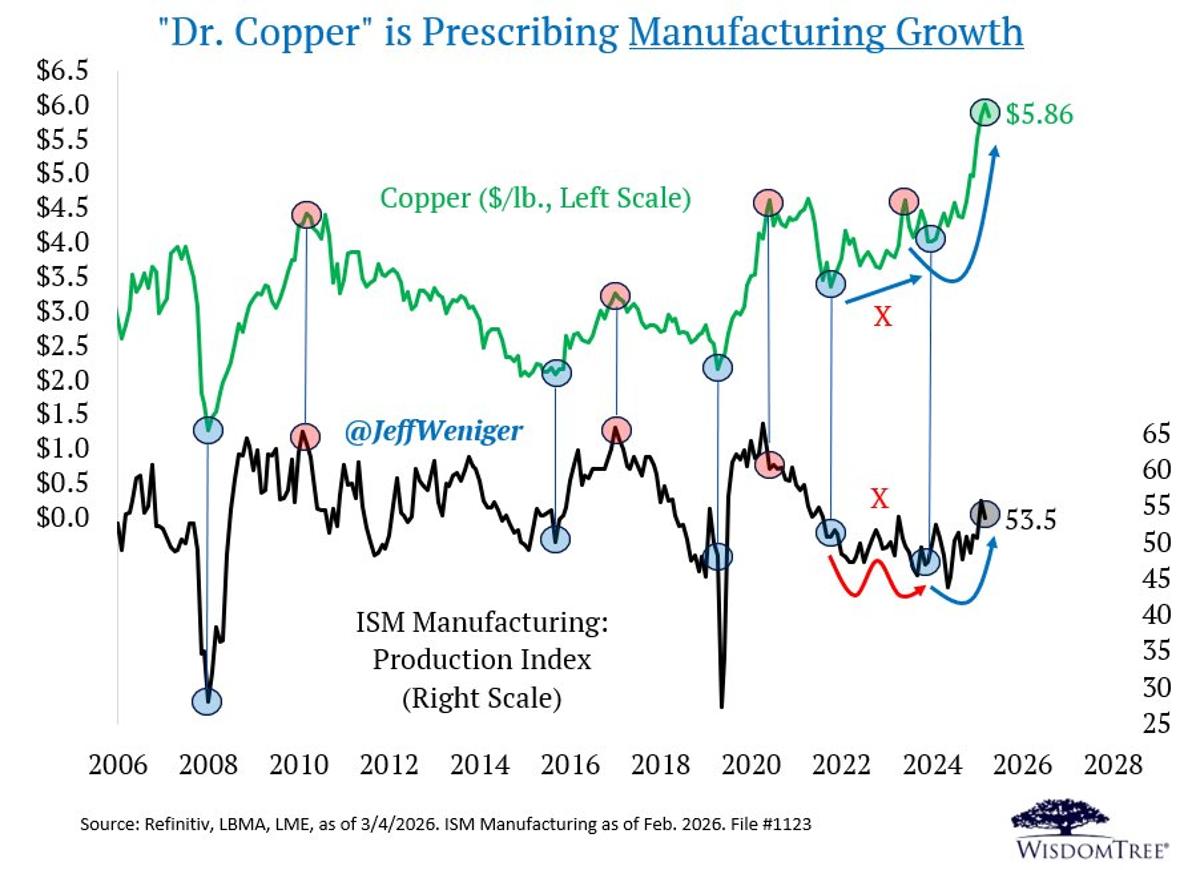
Dr. Copper Rebounds as Manufacturing Finally Picks Up
"Dr. Copper" is seeking redemption. It usually moves hand-in-hand with the manufacturing data. That was not the case in 2023-2024, when it rose but manufacturing remained moribund. Notwithstanding the recent pullback, both are rising again. A promising chart, in my...
Just a Plain Chart—No Debate Needed
Here is a very normal chart that we shouldn't debate or scrutinize in any way. https://t.co/2F9rD46Rcq

BofA Survey Turns Ultra‑Bearish on Dollar, Go Long
The BofA fund manager survey has never been this bearish on the dollar. It is time to bite your lip and start being a lonely dollar long. I have a sample size of one here, arguably a sample size of...
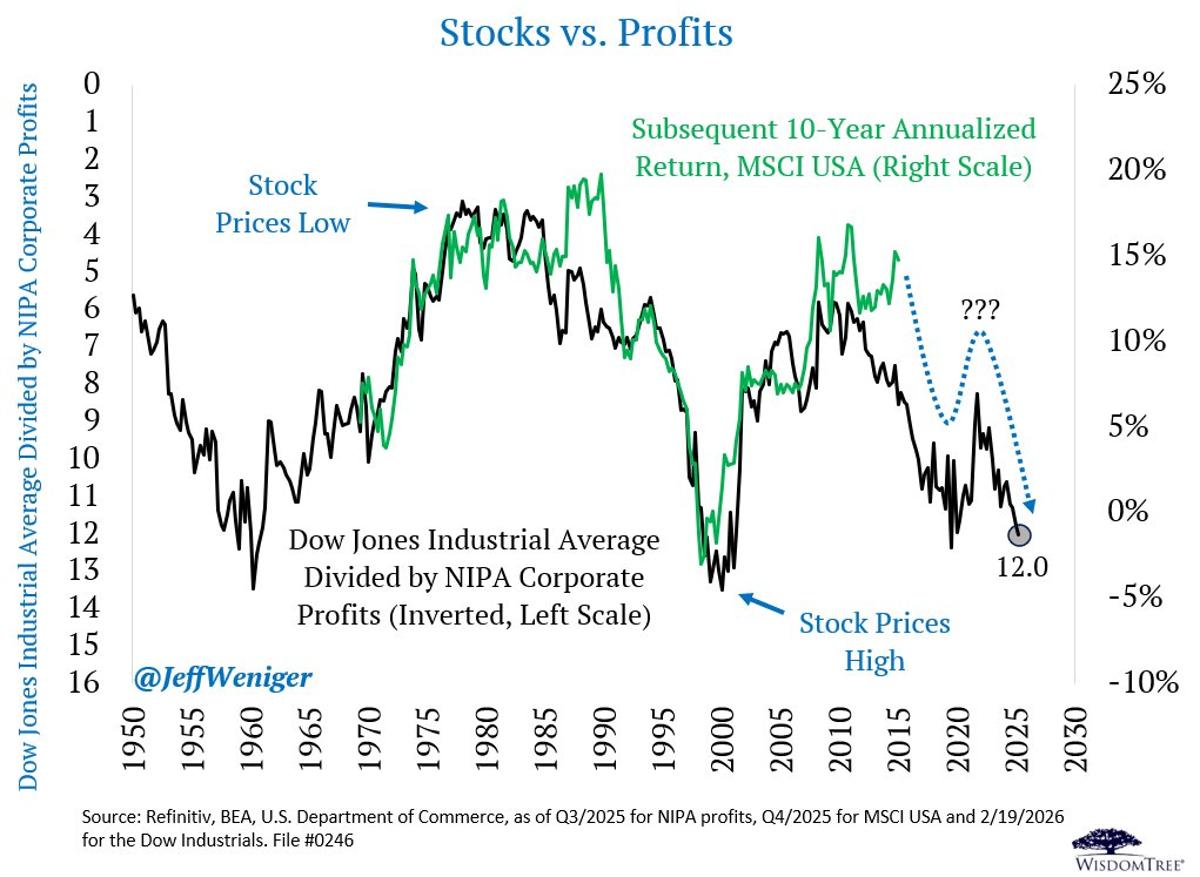
Energy and Materials Surge as Tech Falters in 2026
This is a pretty cool chart to show your investment committee. A classic stock price-to-corporate profits image that reveals extended conditions reminiscent of the turn of the century. If this chart has any prescience, we should remember that the leaders...
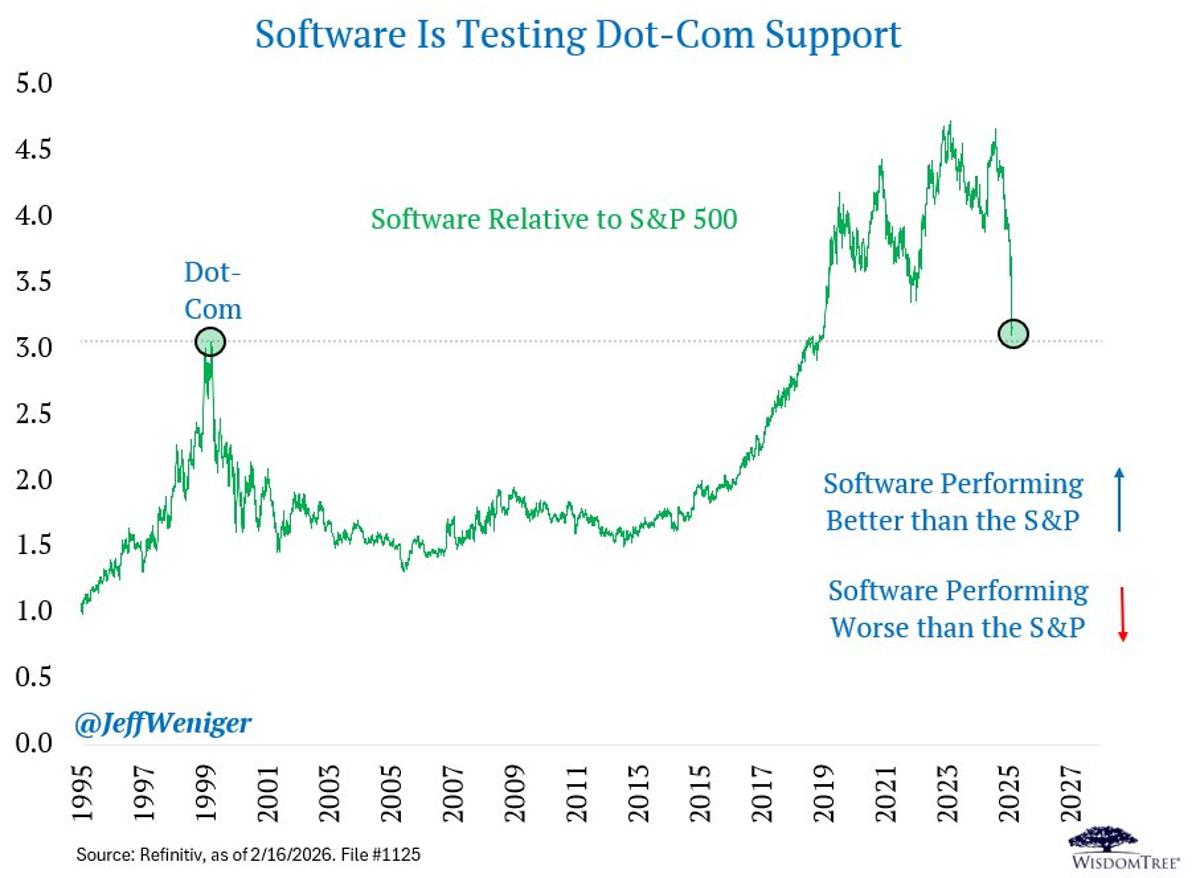
Software Stocks Echo Dot‑com Highs, Risk Imminent Crash
The carnage brings us back to the Dot-Com highs on Software Relative to the S&P 500. Ugly ugly ugly. I don't know if it happens this week, but I think this chart will break down. Time will tell. https://t.co/d0hCRxotxq