
SmartReversals
TA analyst covering SPY/QQQ and crypto with oscillators, Bollinger Bands and short‑term momentum shift analysis.
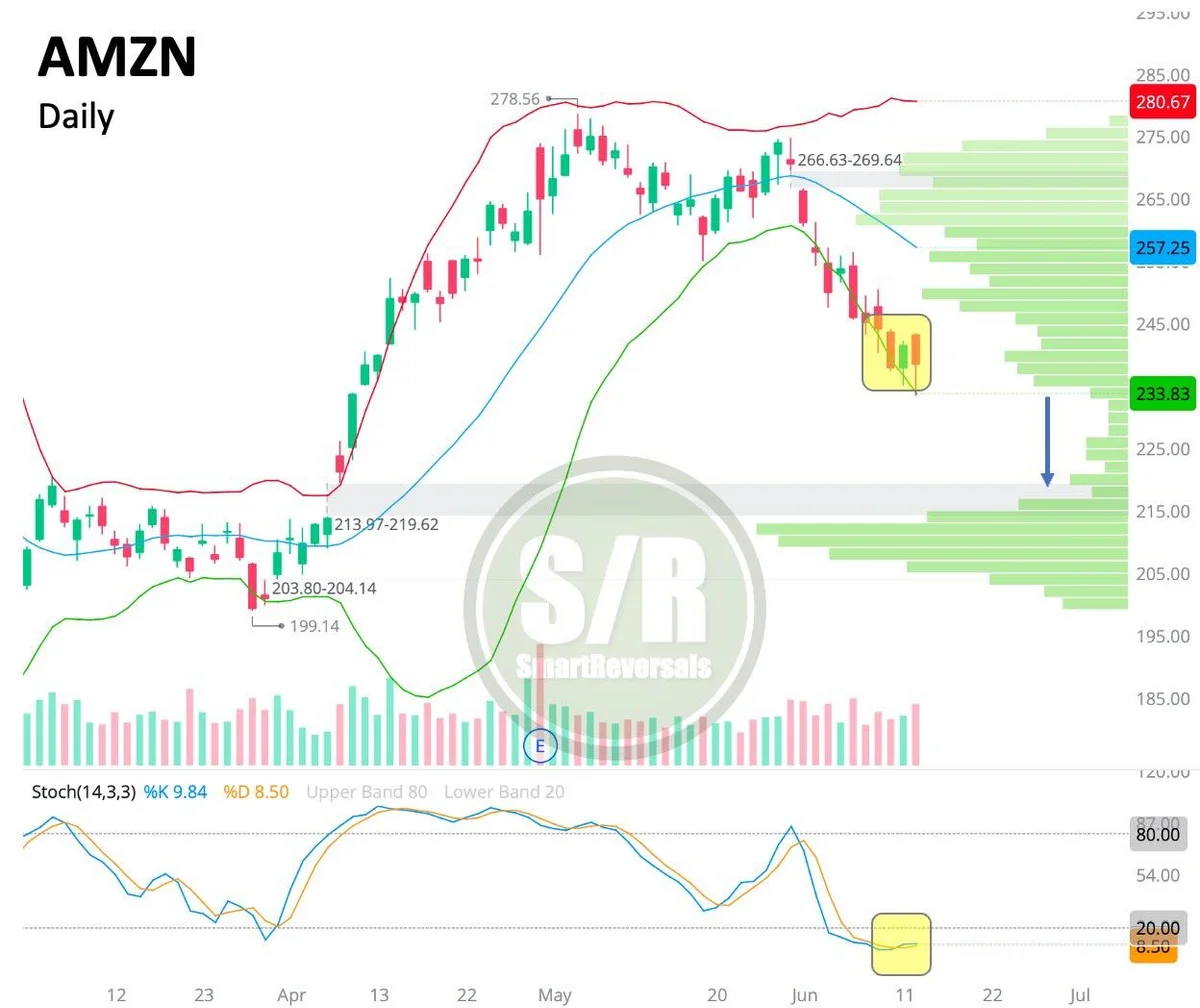
Amazon Oversold: Support at $234, Bounce to $240
AMZN: Oversold. Volume profile points to a make-or-break spot here, with oscillators calling for a relief bounce. On Monday, the price must stay here, since the closest support is at 234 (-1.85%). If there is a bounce, 240 is the resistance to watch. Like & Repost for more.
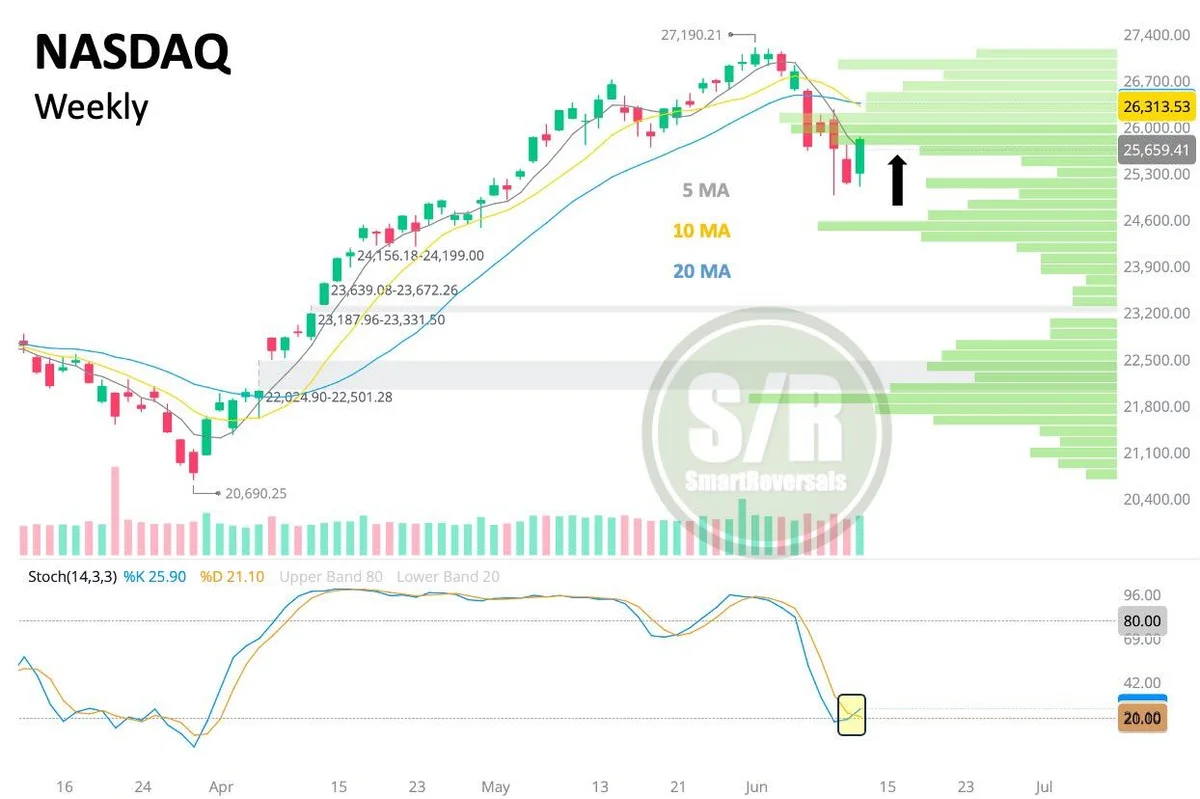
Nasdaq Bullish Reversal Signals Hold Zone, SPCX Inclusion
The #Nasdaq Composite is showing a bullish reversal from oversold conditions considering the Stochastic. The bounce came from the volume shelves gap, the price needs to hold this zone to avoid a selloff to 24K. #SPCX will be included tomorrow...
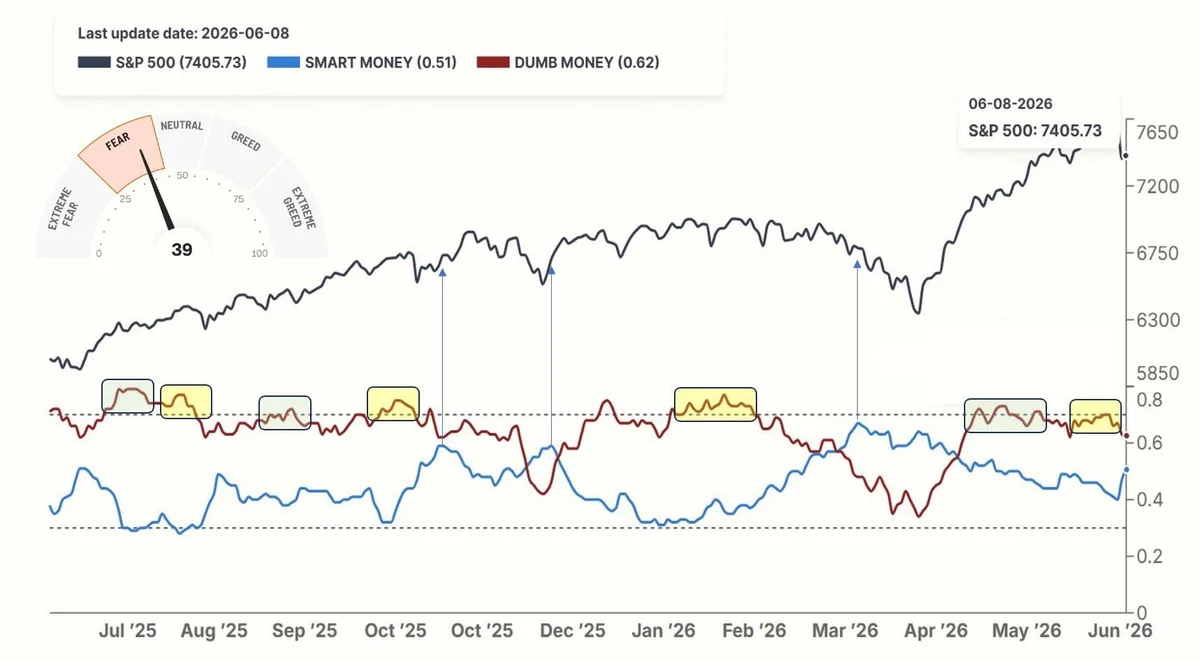
Rising Fear After Dumb Money Confidence Signals Defensive Stance
SPX: Fear is rising after an extended period of dumb money confidence, which usually precedes declines. Sentiment indicators like Fear & Greed or Smart/Dumb Money do not time turning points like price action, but they signal when to stay in...
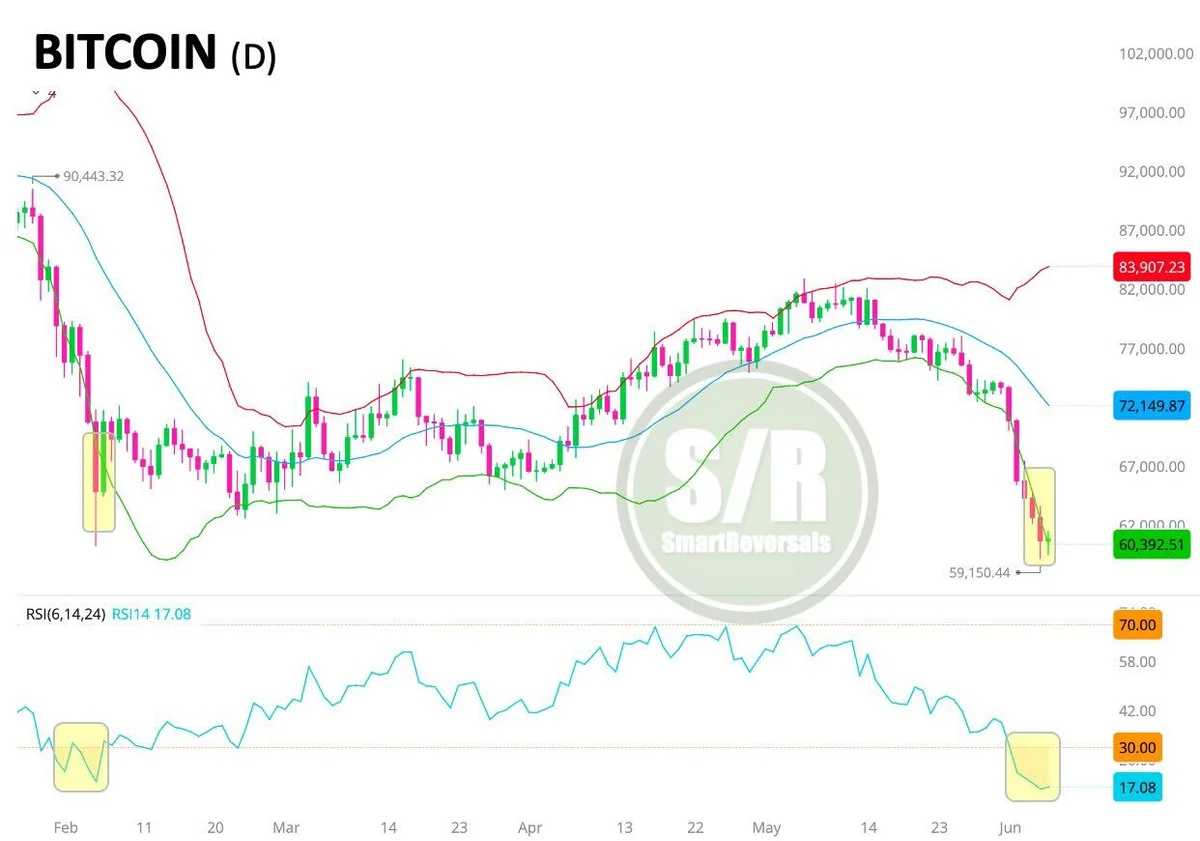
Bitcoin Hits Extreme Oversold Levels, Mirrors February Trend
#Bitcoin has reached extreme oversold conditions, very similar to those seen in February. Price action relative to the Bollinger Bands and RSI mirrors those conditions closely. #BTC #Crypto Key levels to recover posted in the Weekly Compass. Link in bio.

SPX Rebounds Off 7,520 as Non‑tech Rallies
SPX: Came back from the $7,520 weekly level. How did this happen? Most of the non-tech sectors rallied today, and giants like #GOOG and #AMZN bounced from oversold conditions. The afternoon price action lacked conviction; momentum must continue to keep...
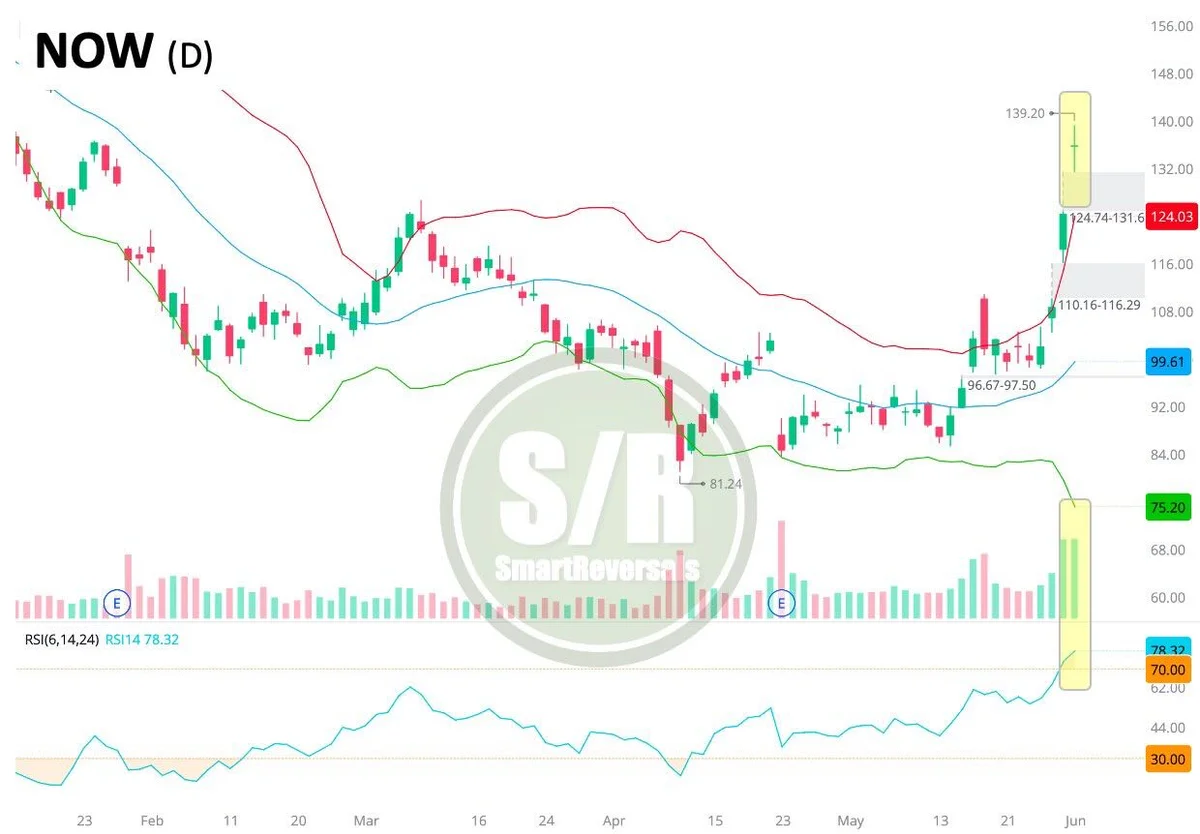
Rally Likely Short‑Lived: Gap Fill Signals Confirmed
#NOW: Be careful chasing this rally. The candle type above the band suggests the gap will be filled, and both volume and RSI agree. Like and repost for more charts 👍
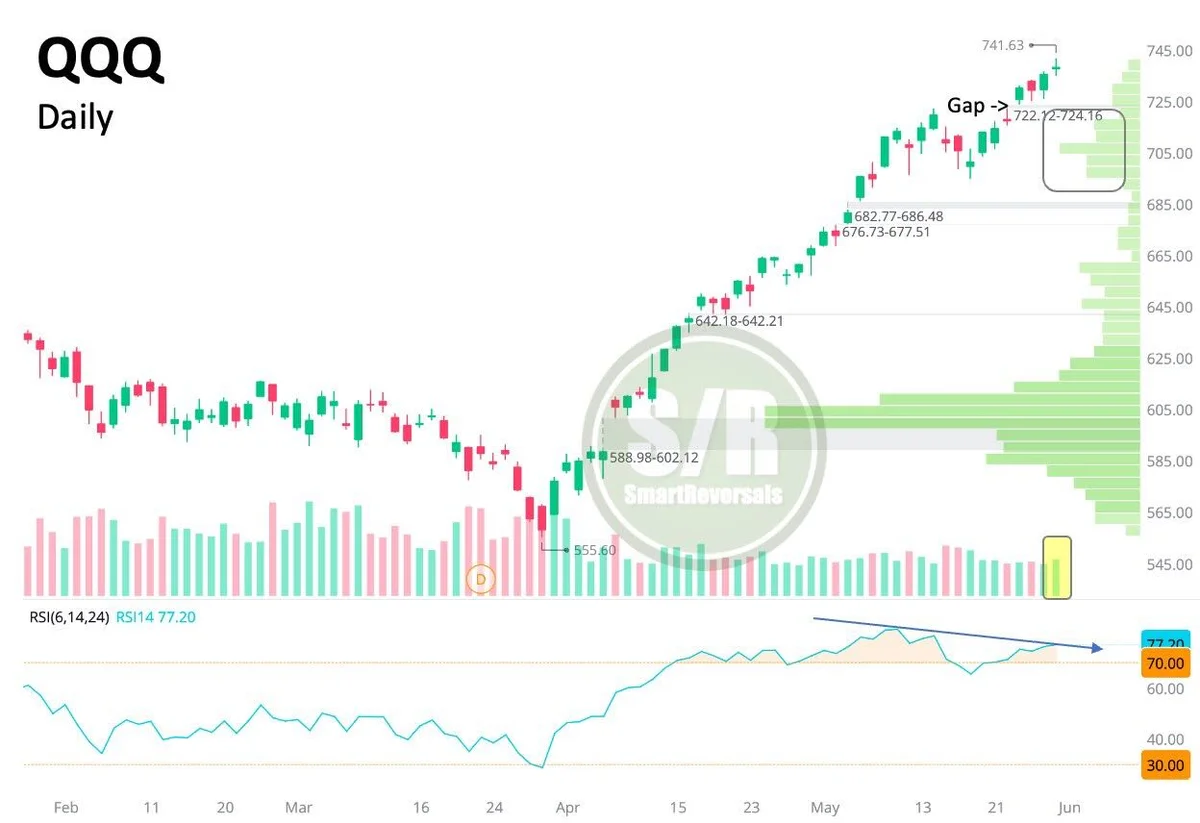
QQQ Likely Consolidates Amid Overbought Divergence and Gap
#QQQ: Indecisive daily price action, an overbought RSI divergence, and a gap sitting below at $722. With no major geopolitical news fueling the tape this weekend, a consolidation or a pullback is highly possible here. The volume shelf is a...
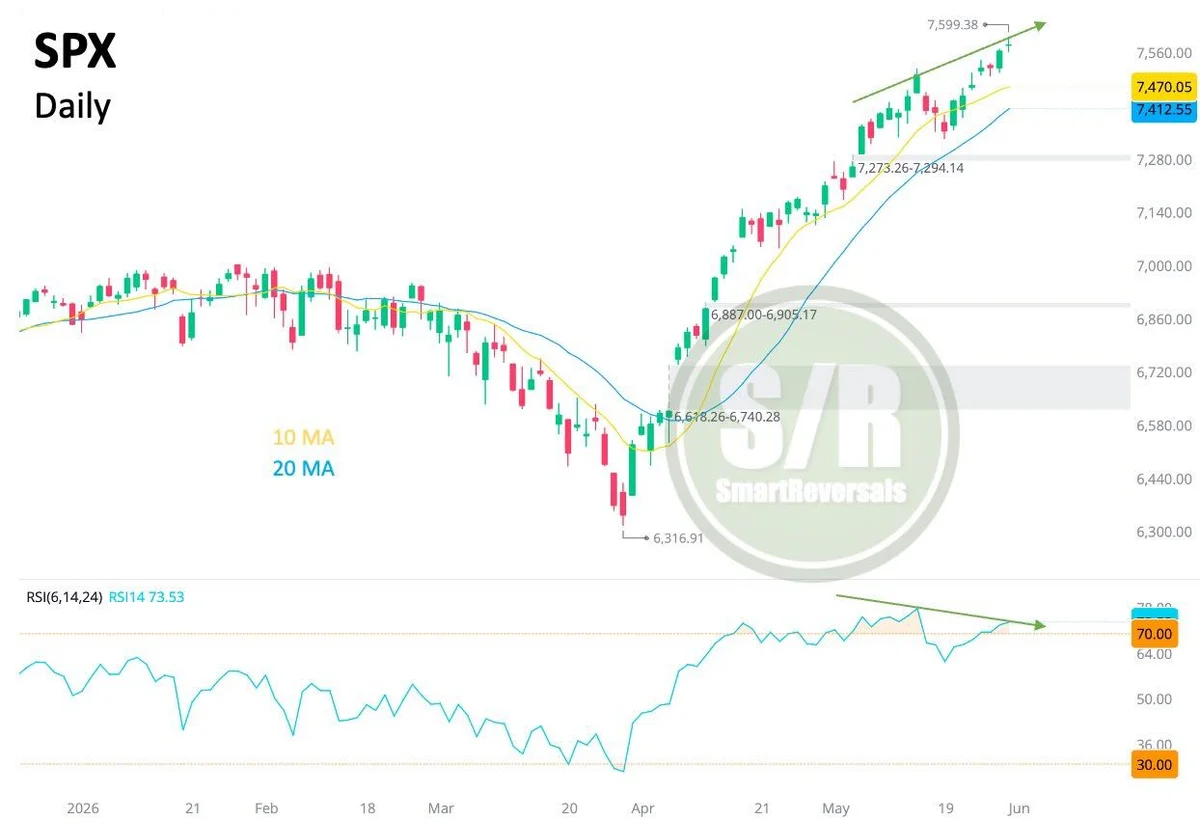
SPX Shows Bearish RSI Divergence Amid Overbought Doji
#SPX: Indecisive price action again (doji), printing a bearish RSI divergence with both peaks locked in overbought territory. Will weekend news arrive to fuel momentum again, or is the market simply widening this structural divergence before a pullback?
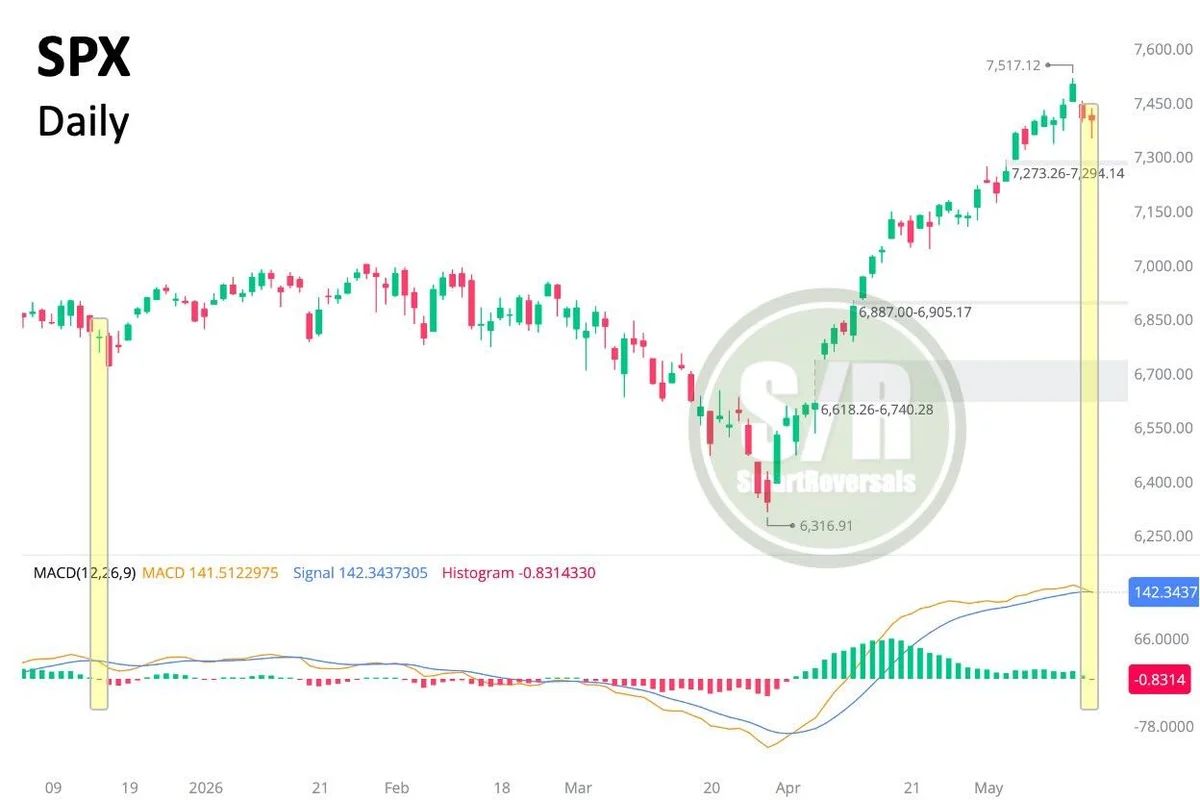
Dip Buyers Trigger Bullish Reversal Near 7,360 Zone
SPX: Dip buyers jumped in close to the 7,360 daily demand zone. The candle suggests a bullish reversal, the MACD crossover indicates the trend is switching, making further decline likely. The gap at 7,273 is a must-watch zone. #SPY.
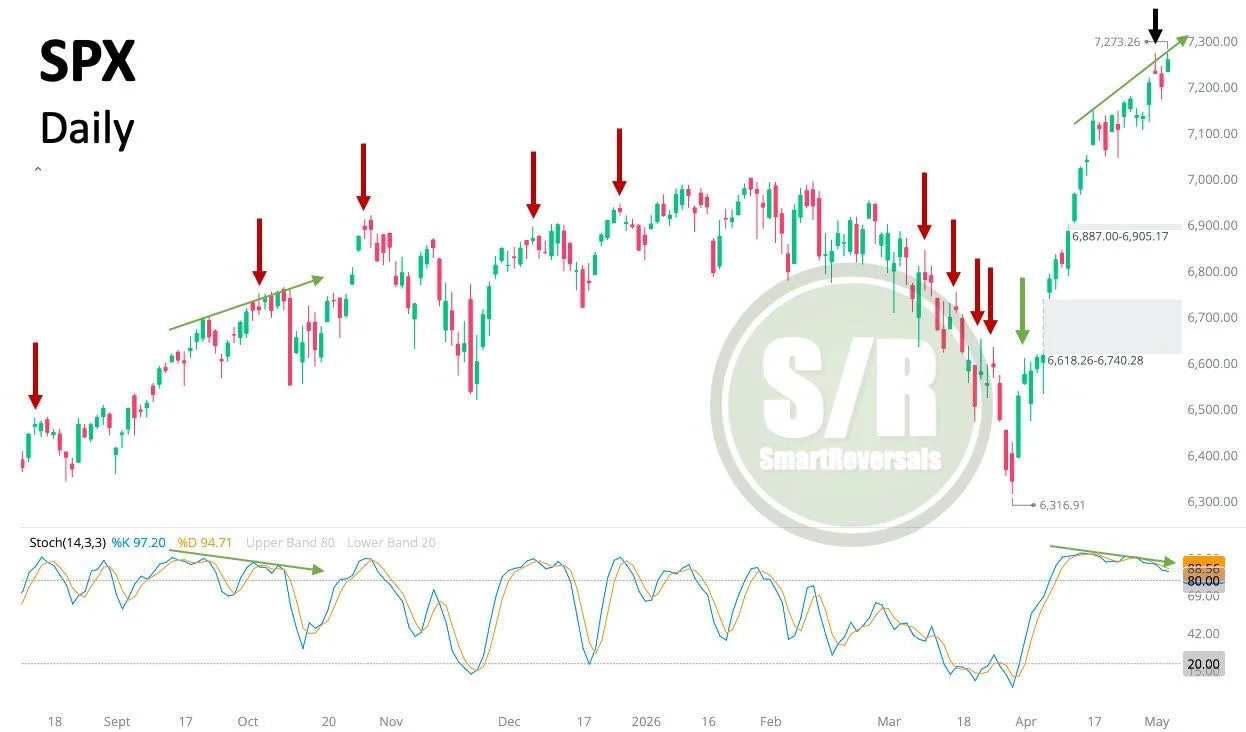
Hold Off Until SPX Breaches 7,299 Resistance
SPX: Don't fight the trend until key levels are breached. The recent indecisive candle is suggesting to be an early signal as the Stochastic divergence continues to extend. It is a matter of when, not if. Next major resistance: $7,299,...
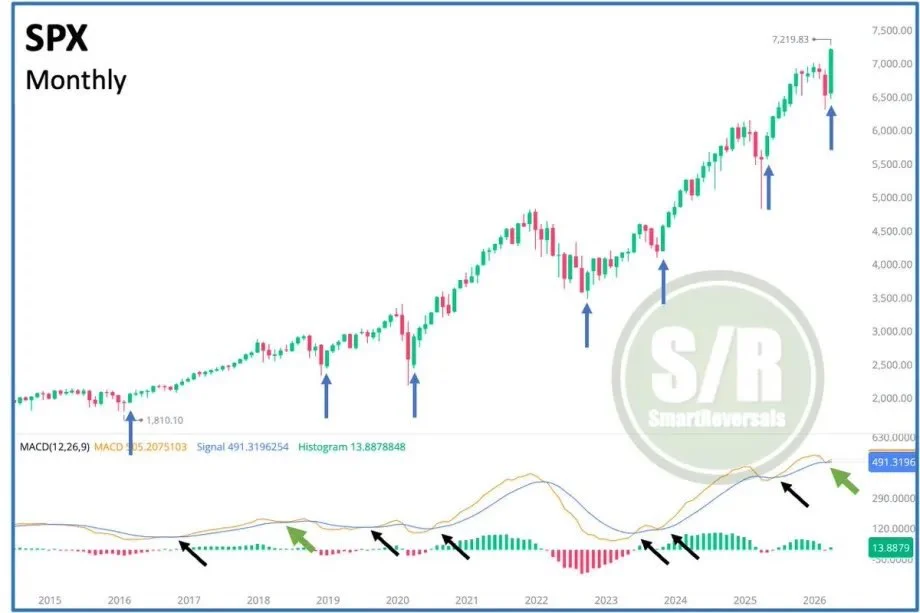
Bulls Dodge Bearish MACD, Monthly Candle Signals Continuation
SPX: Bulls managed to avoid the bearish MACD crossover that seemed imminent last month, mirroring the price action seen in 2018. Beyond that, the monthly candle shows conviction, a move that is usually followed by bullish continuation when a reversal...
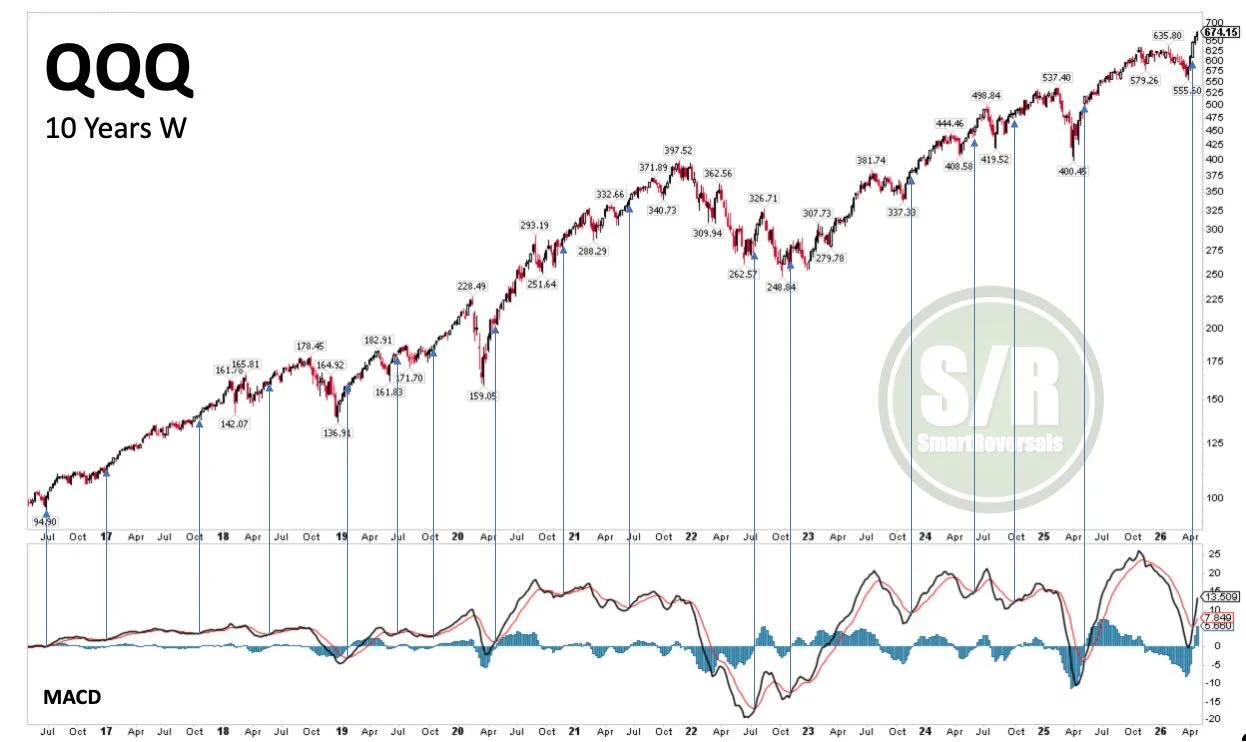
Weekly MACD Crossover Signals Strong QQQ Bullish Continuation
QQQ: Weekly MACD crossovers work as high-probability signals for bullish continuation. This instance was no exception, and the setup still shows potential for further gains. #NDX
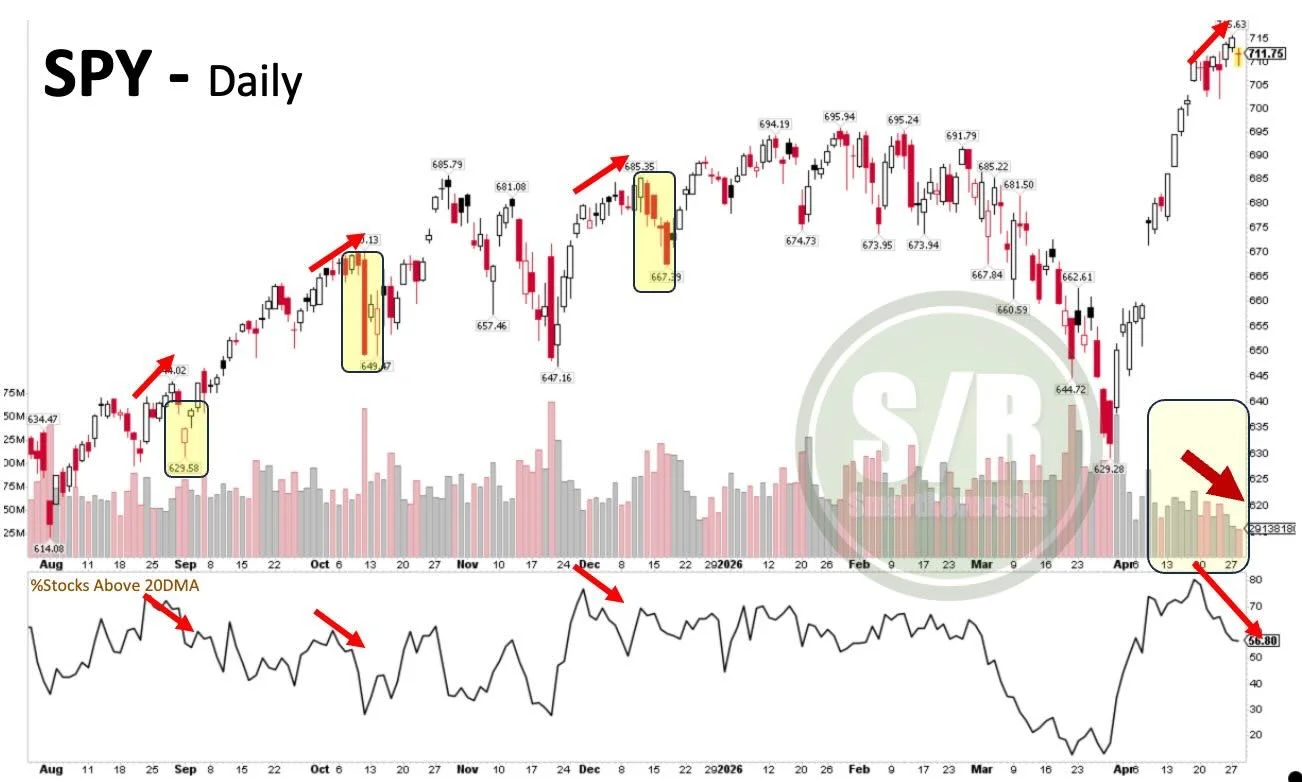
Diminishing Participation Signals Bearish Divergence and Low Volume
SPY: Stock participation has deteriorated over the last days, creating a bearish divergence similar to those that preceded healthy pullbacks last year. What makes this occurrence particularly intriguing is the vanishing volume, adding a layer of divergence and caution. #SPX
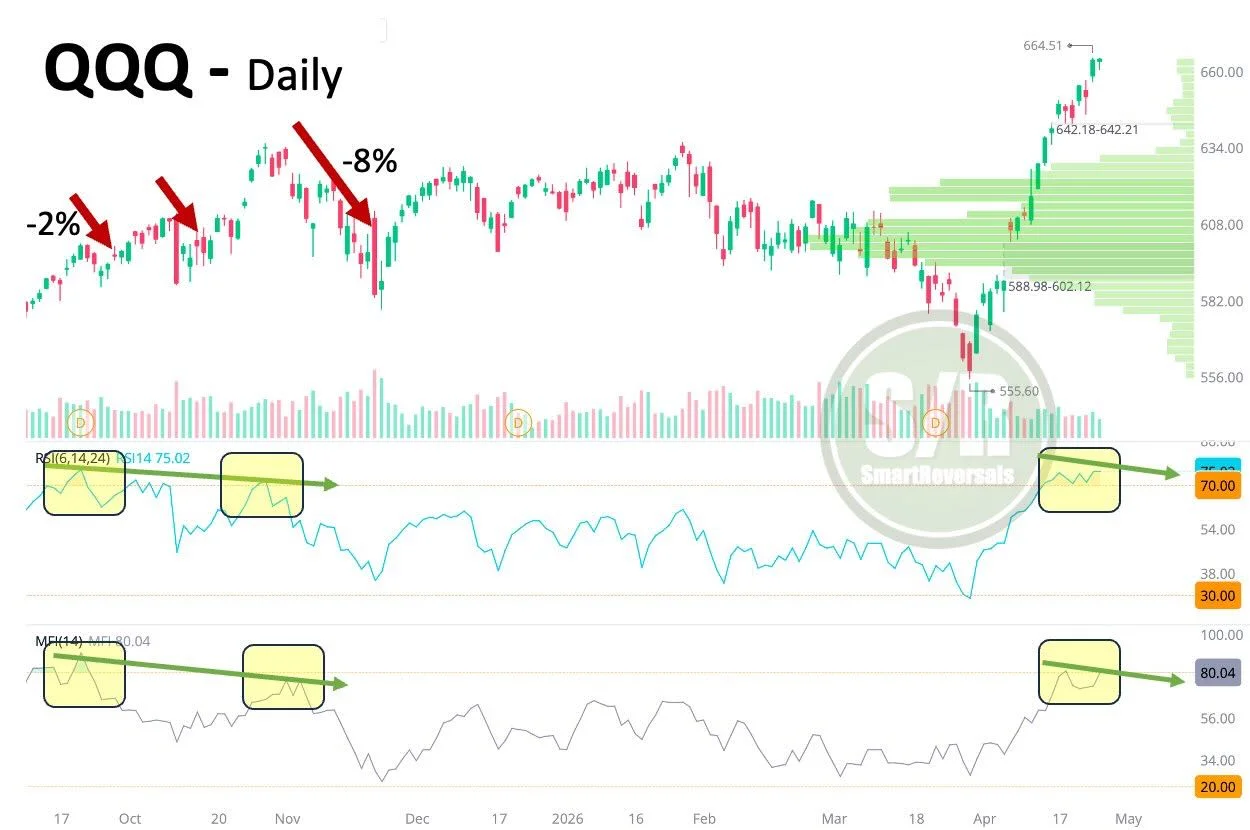
Overbought QQQ Signals Pullback Before 2026 Correction
#QQQ: RSI and Money Flow overbought; time for a breather. A healthy dip usually precedes higher highs in price with lower highs in oscillators, creating a bearish divergence. That's the same expected path: Pullback, recovery, then a sharper correction in...
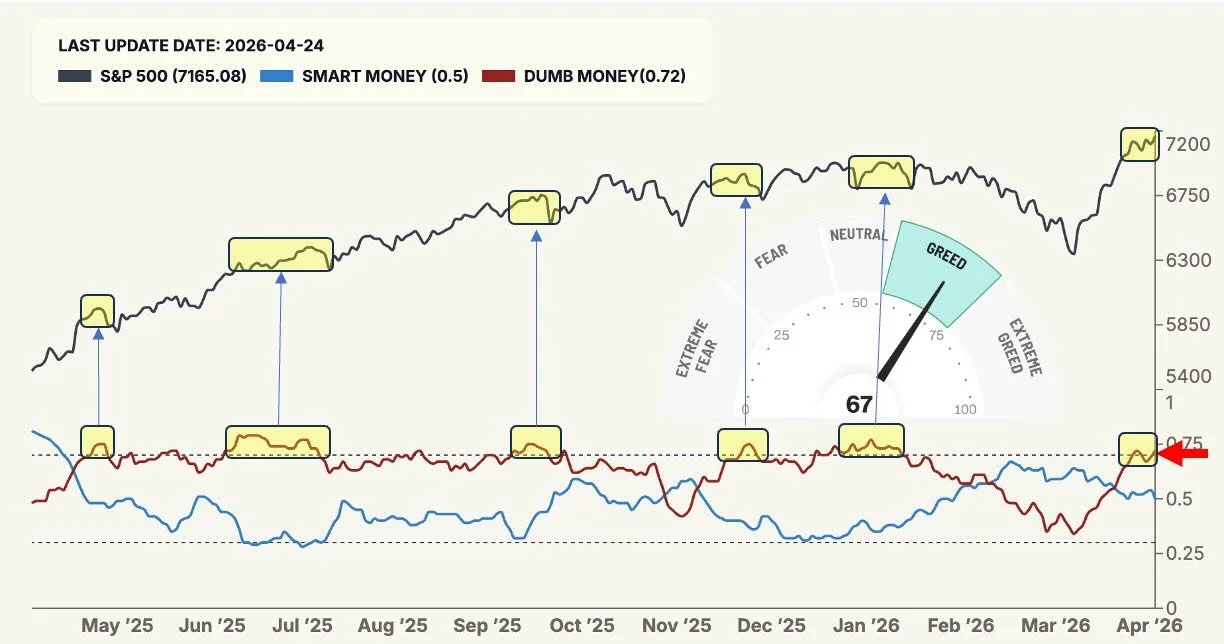
Dumb Money Extreme Optimism; Expect Pullback Despite Greed
SPX: Dumb Money Confidence has entered the Extreme Optimism zone, a level that historically coincides with index consolidations or healthy pullbacks. Furthermore, the Fear & Greed Index sits at 67 (Greed), while Smart Money Confidence is neutral ahead of major...