
SmartReversals
TA analyst covering SPY/QQQ and crypto with oscillators, Bollinger Bands and short‑term momentum shift analysis.
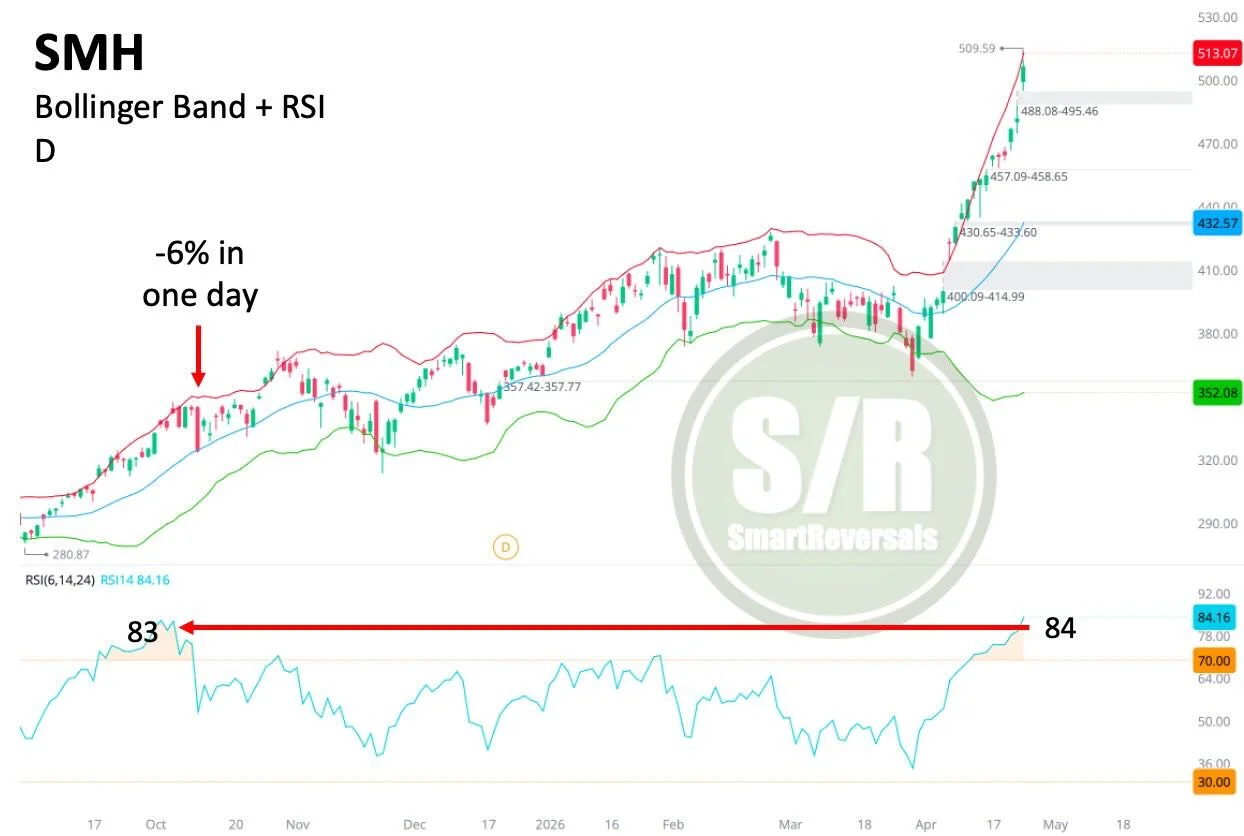
Breakouts Bullish, Yet High RSI Signals Potential Drop
SMH: Are breakouts bullish? They are. Just be aware that the last time the RSI for semiconductors was above 80, there was a -6% move in a single day as part of the consolidation. Back then, we didn't have three gaps below us, with the first one alone implying a -4% move. #AMD Like for more charts 💚
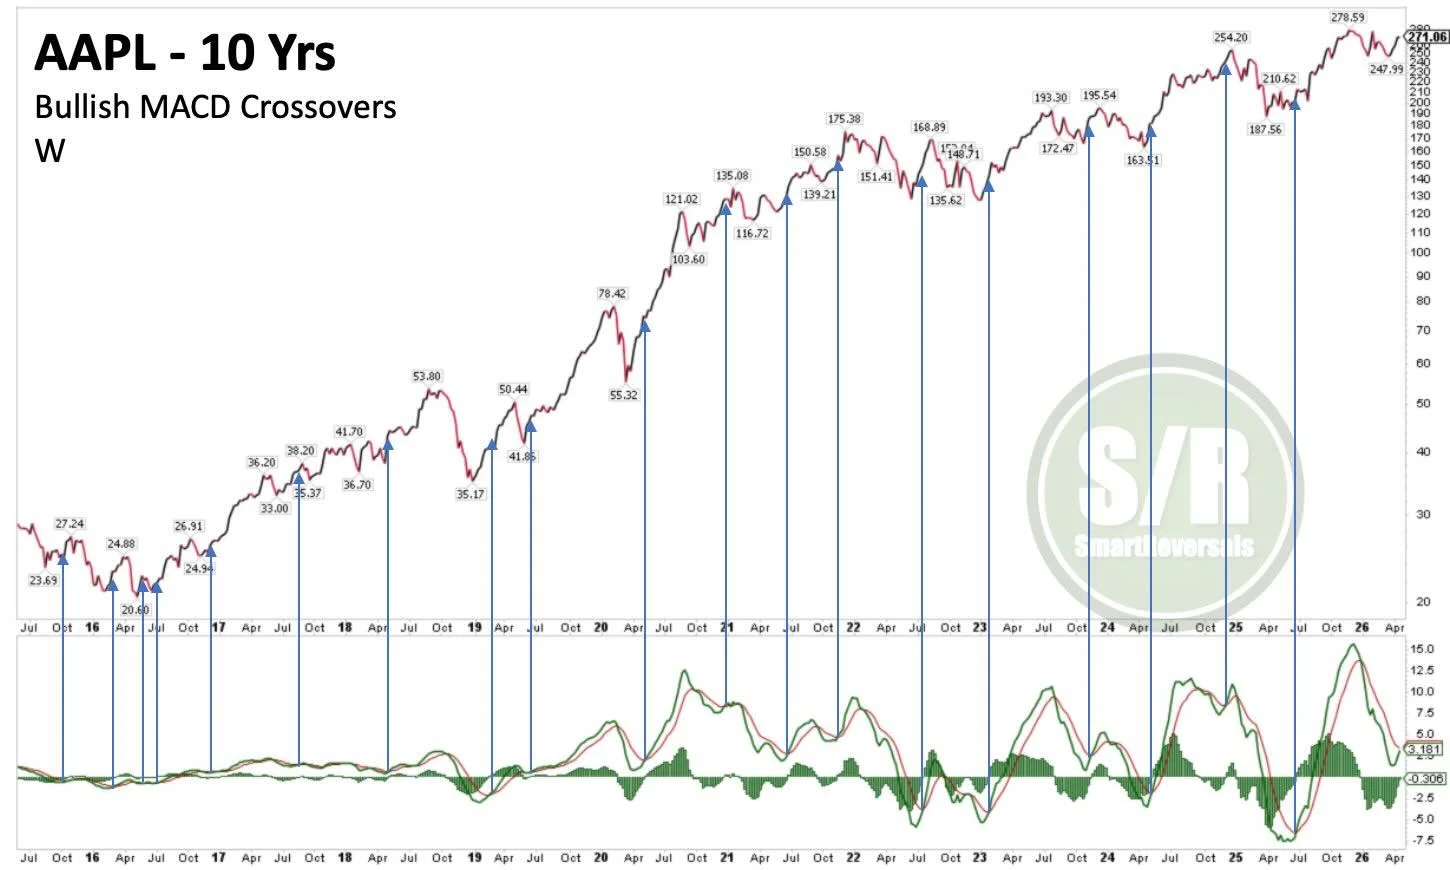
Apple MACD Bullish Crossover Signals Potential 5% Rise
AAPL: Weekly bullish MACD crossovers usually precede average moves of +5% within three weeks. With earnings scheduled for this Thursday, the week is key to confirm the signal, currently brewing.
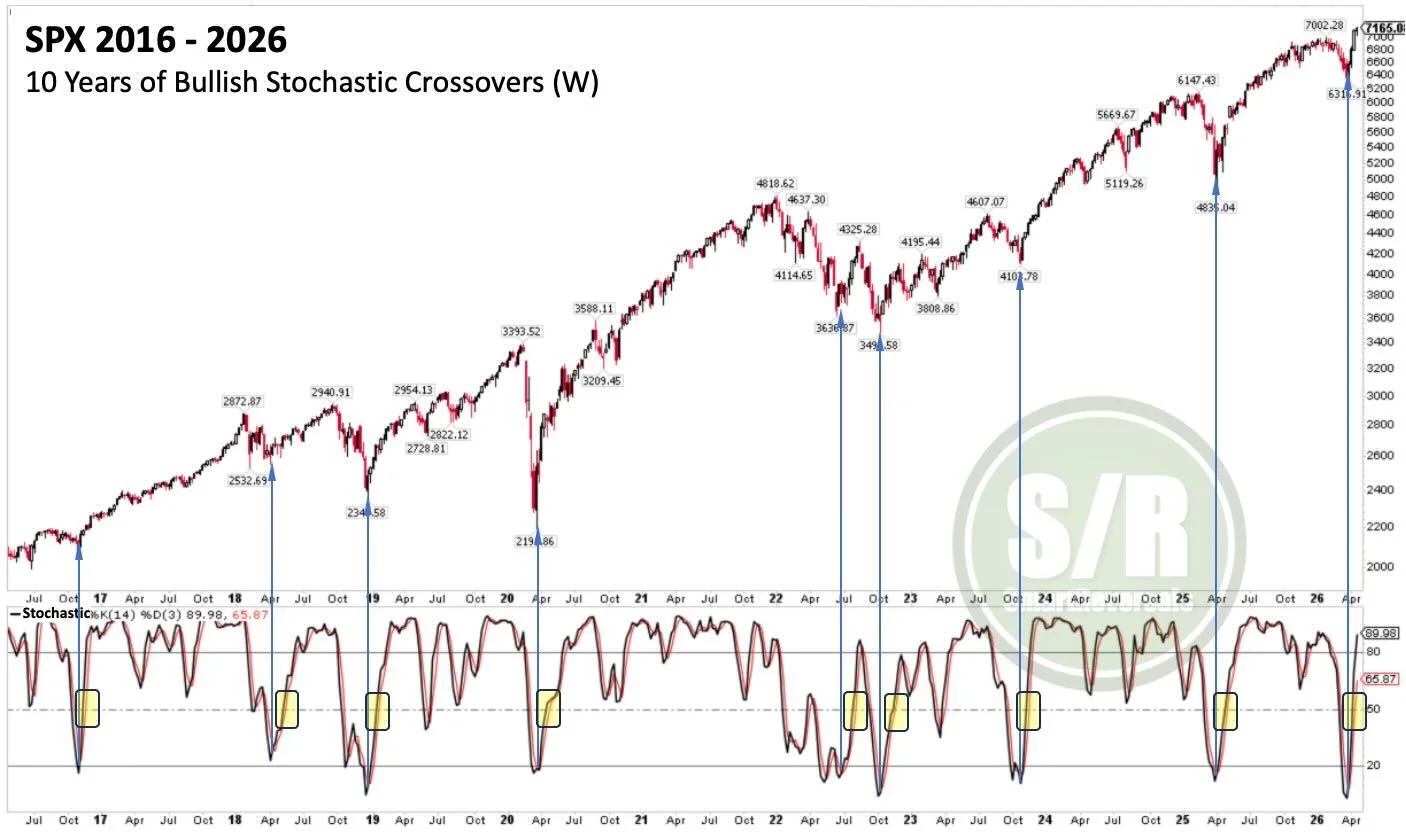
SPX Stochastic Signals Ongoing Bullish Momentum
SPX: During the last 10 years, every time the Stochastic bounced from oversold area and made it above 50, the index maintained bullish continuation and consolidated when the oscillator was overbought (+80) with both lines. There is room for further...
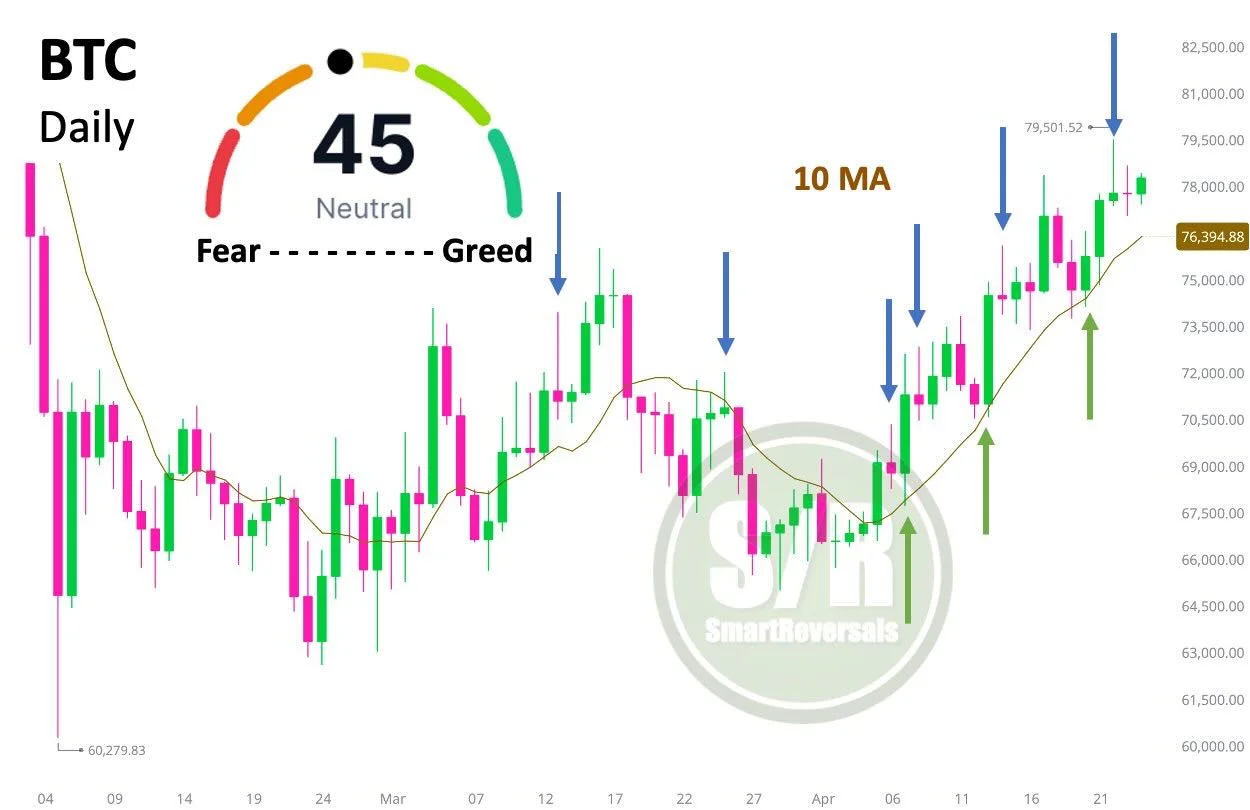
Bitcoin Bull Run May Hit $80.6K Soon
BTC: Bitcoin is in a bull trend consistently invalidating daily shooting stars as momentum continues. The 10-day moving average is carrying this move and the price is far from greed. Don’t rule out a test of $80.6K within the next...
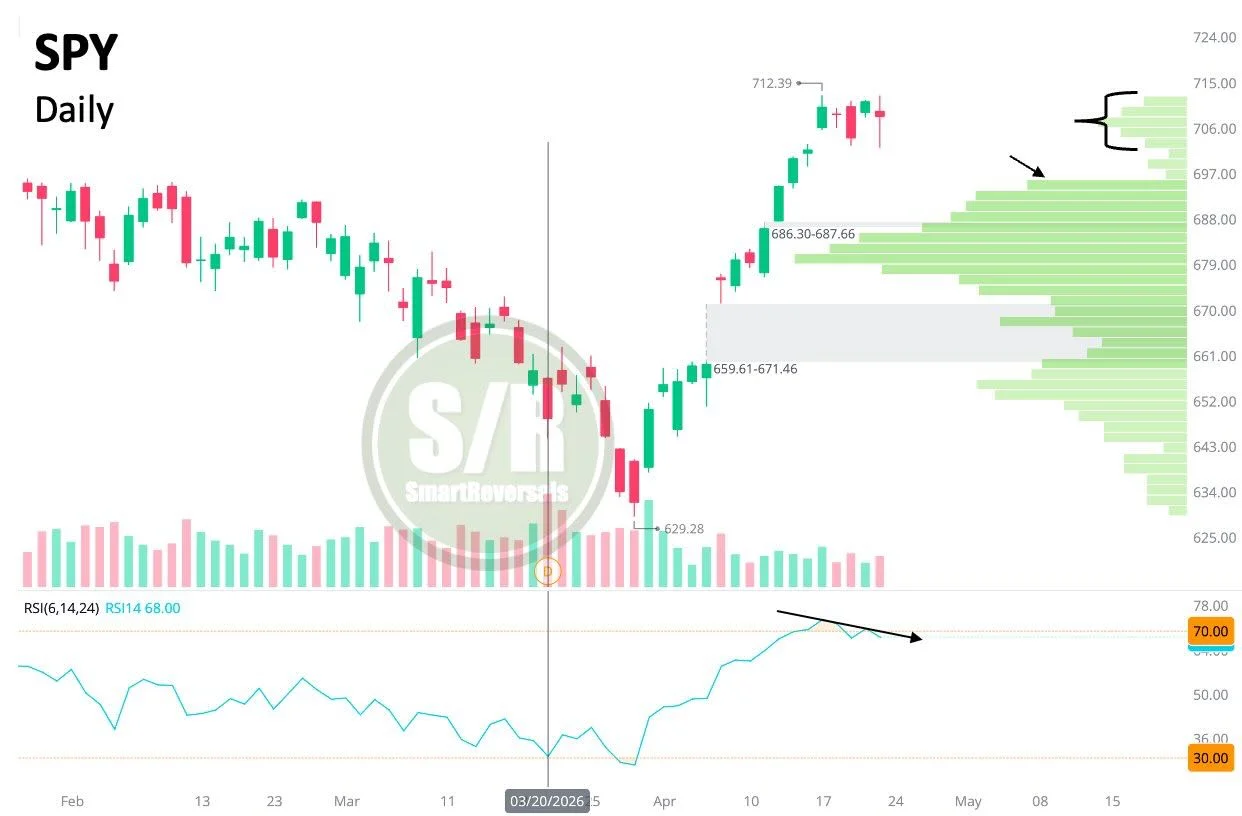
SPY's Range Signals Potential Drop to $695
SPY Indecision at the Top: The price has moved between 702.5 and 711 this week, building a small volume shelf. Any loss of today’s low could send the price to $695 (volume shelf below), validating the short-term bearish RSI divergence...
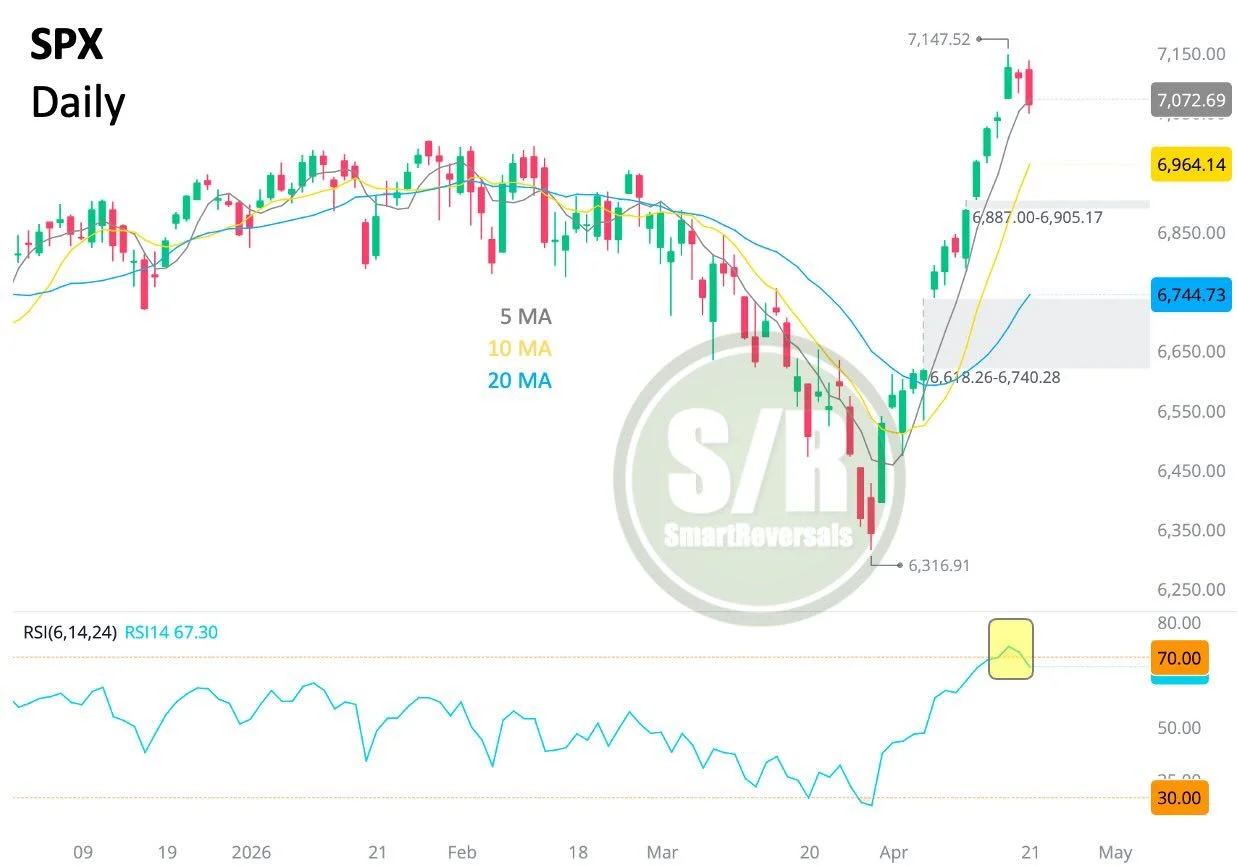
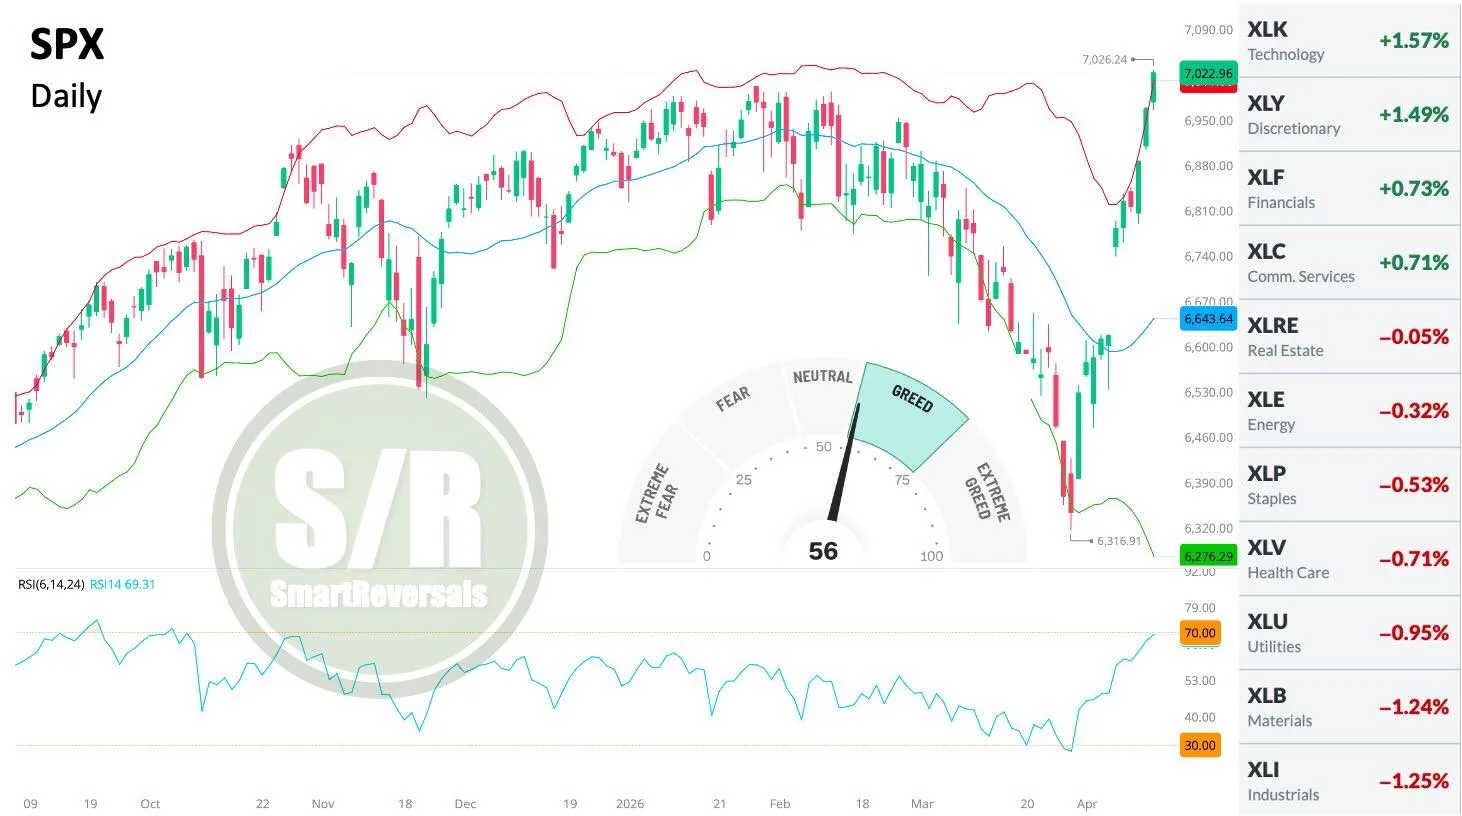
SPX Gap Filled, Bearish Engulfing Signals Pullback
SPX: The gap was filled with a bearish engulfing candle as the RSI fell from overbought levels (70). A tactical pullback/consolidation usually follows. Given the afternoon's indecisive price action, keep a close eye on $7,021; if lost tomorrow, the decline...
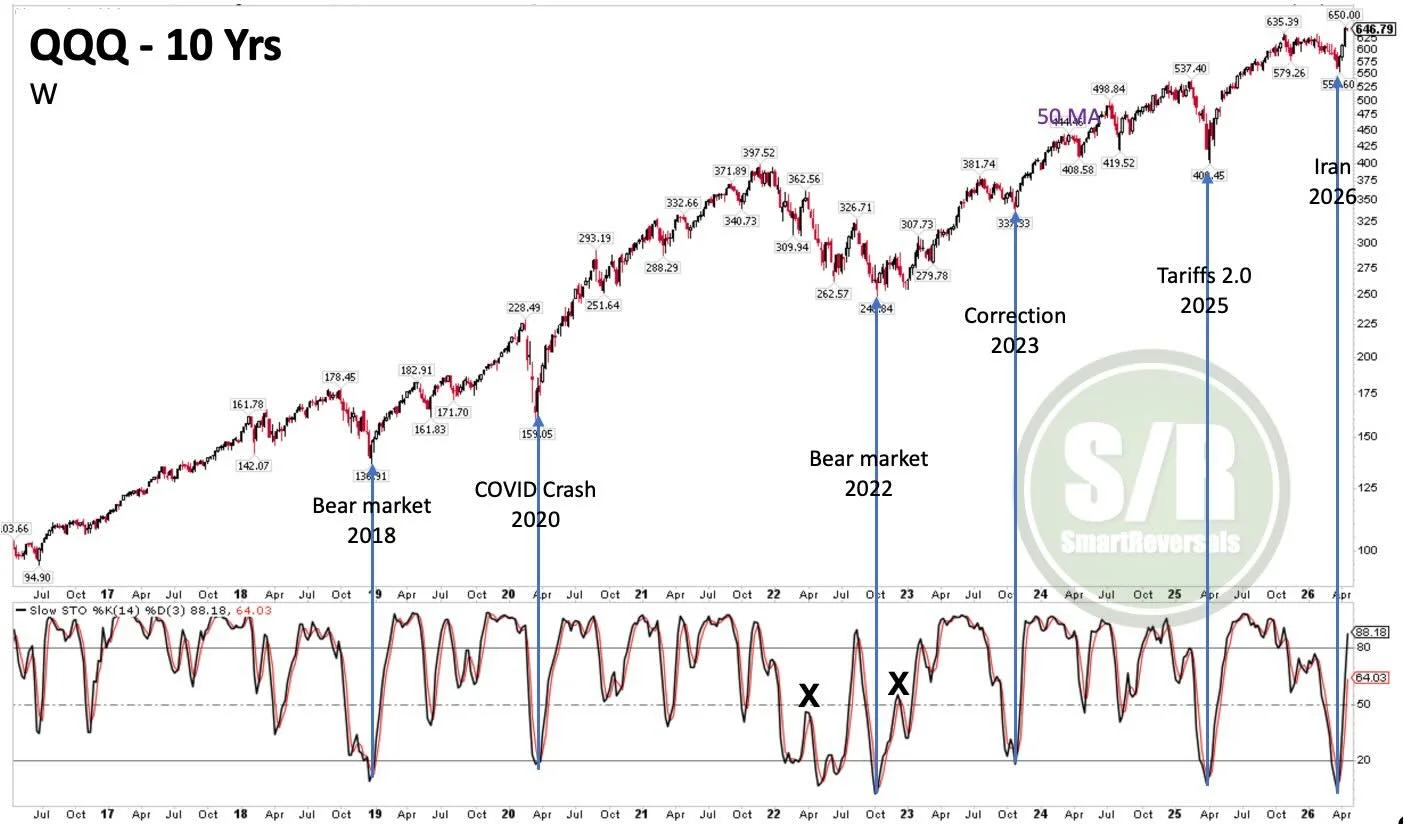
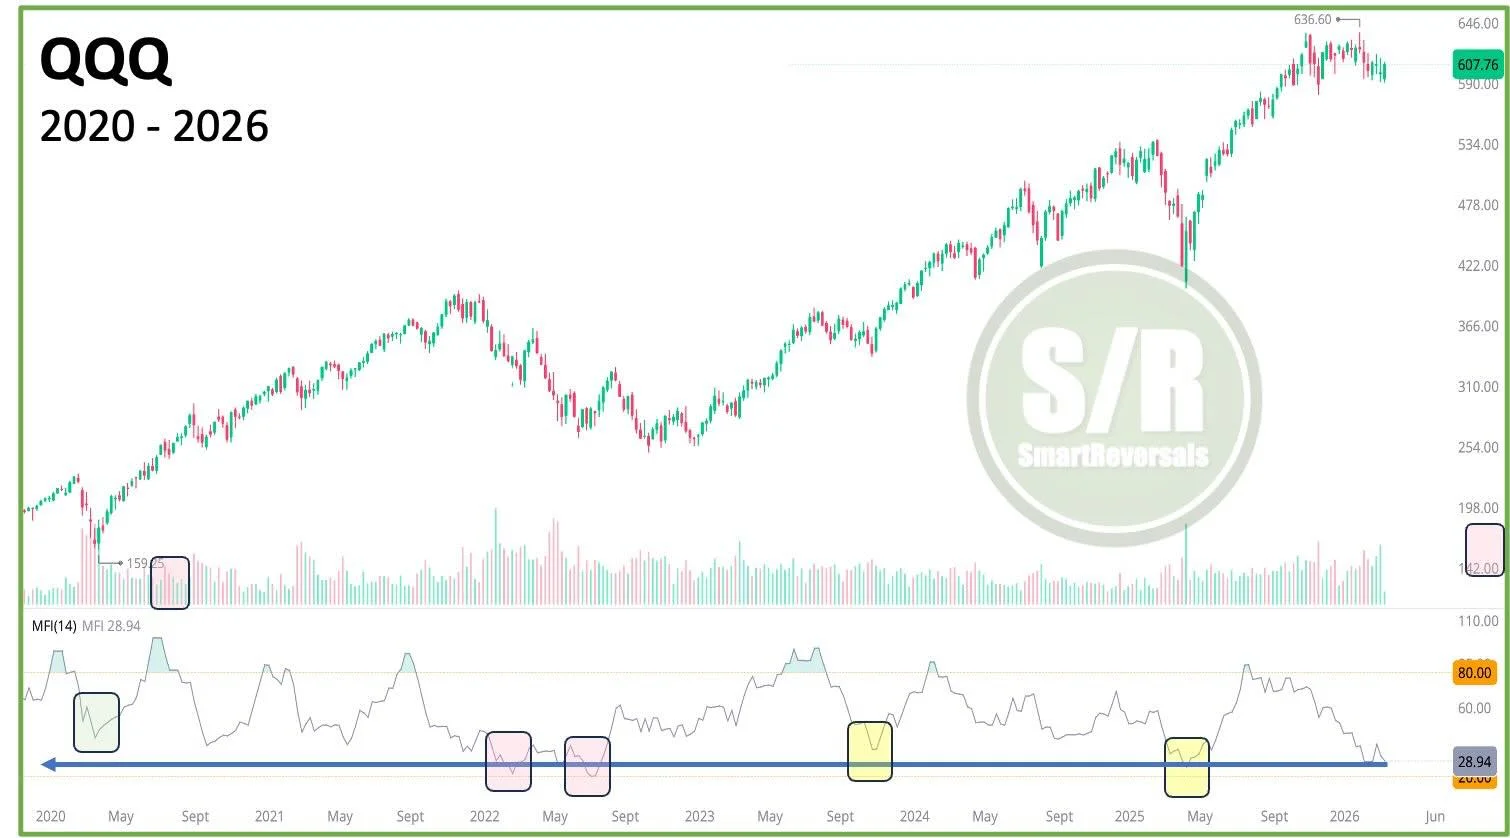
Weekly Stochastic Crossover Signals New Market Bottom
QQQ: Over the last 10 years, bullish Stochastic crossovers on the weekly chart have marked notable bottoms. The move is validated when the oscillator crosses 50, which is the case today. #NDX
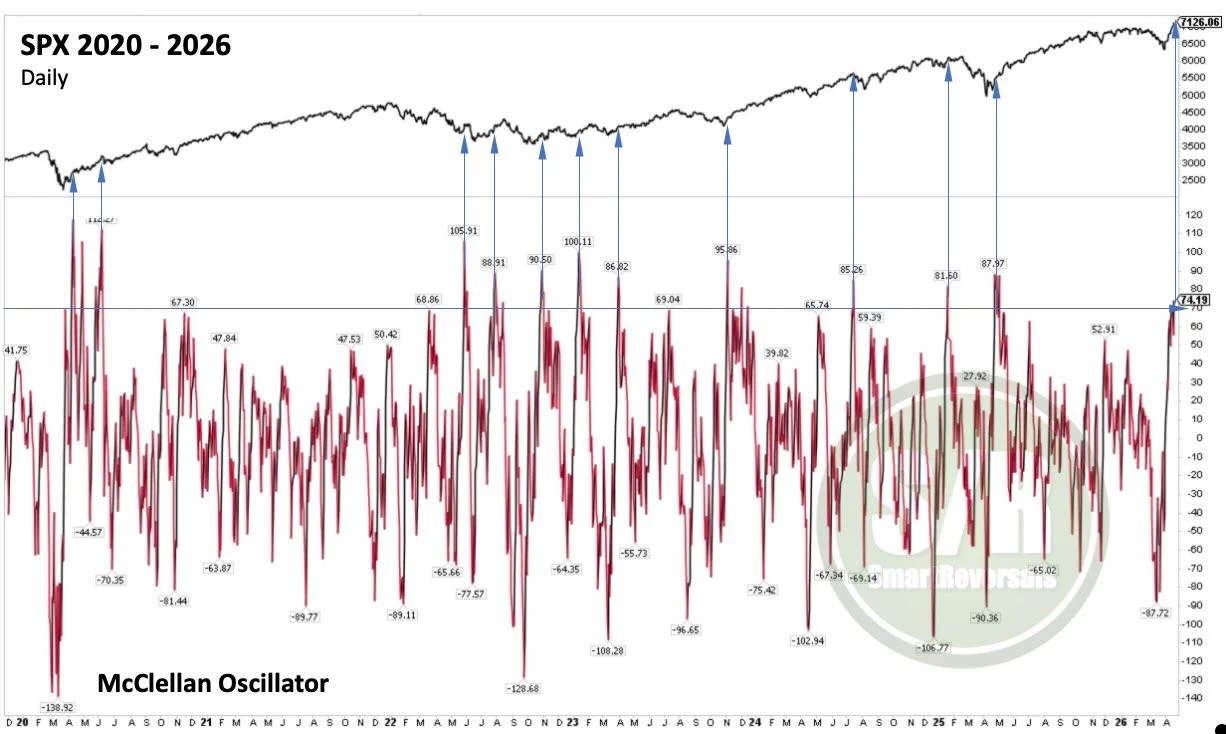
Overbought McClellan Signals Short-Term Pullback Ahead
SPX: Overbought McClellan Oscillator +70 following a market bounce signals a short-term consolidation before the bullish continuation resumes. When the overbought condition is reached in a mature uptrend, it can precede a major pullback. The current case is a market bounce...
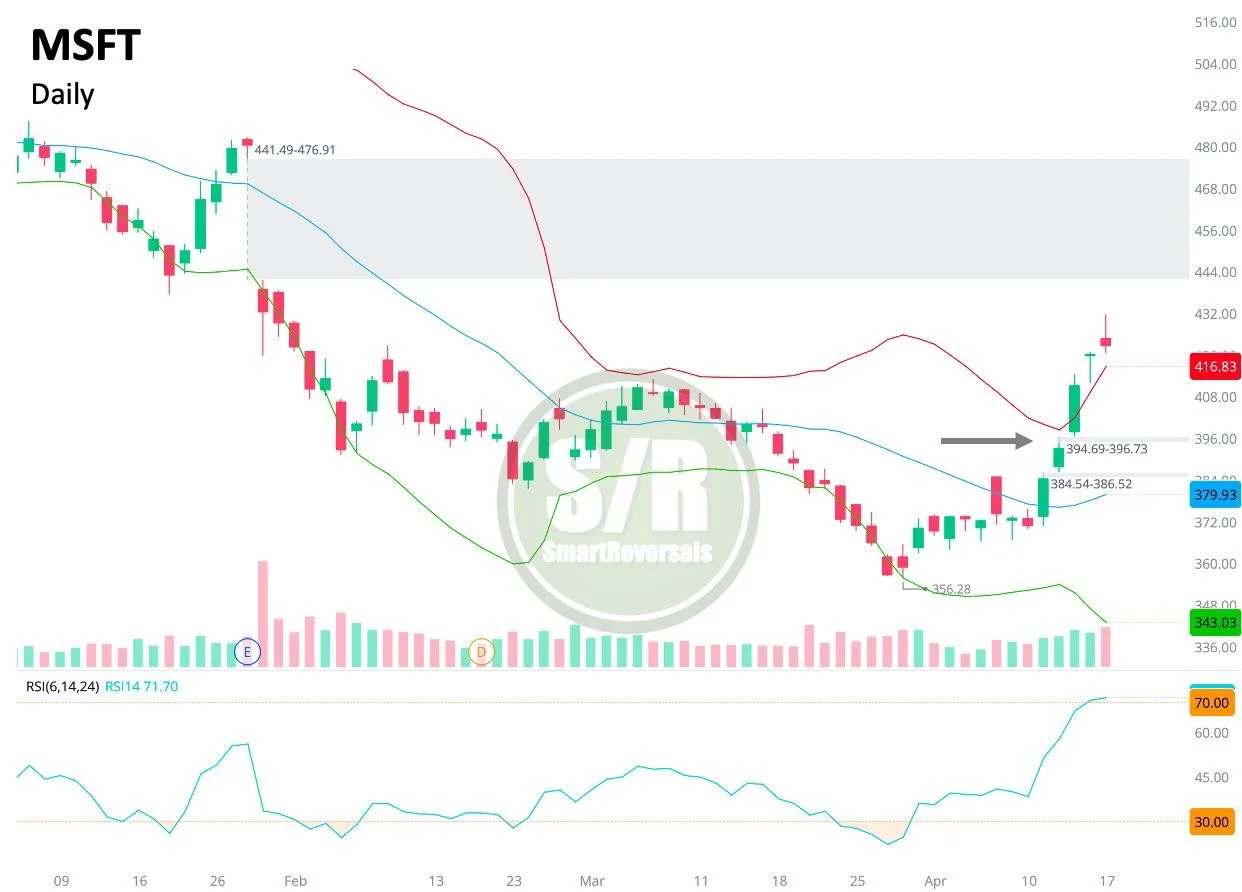
MSFT Poised for Pullback Before Next $441 Push
MSFT: A Shooting Star has formed above the upper Bollinger Band, leaving two open gaps below and RSI >70. A reset is likely before another attempt to reach the $441 gap. After a stellar weekly run of +14%, a pullback...
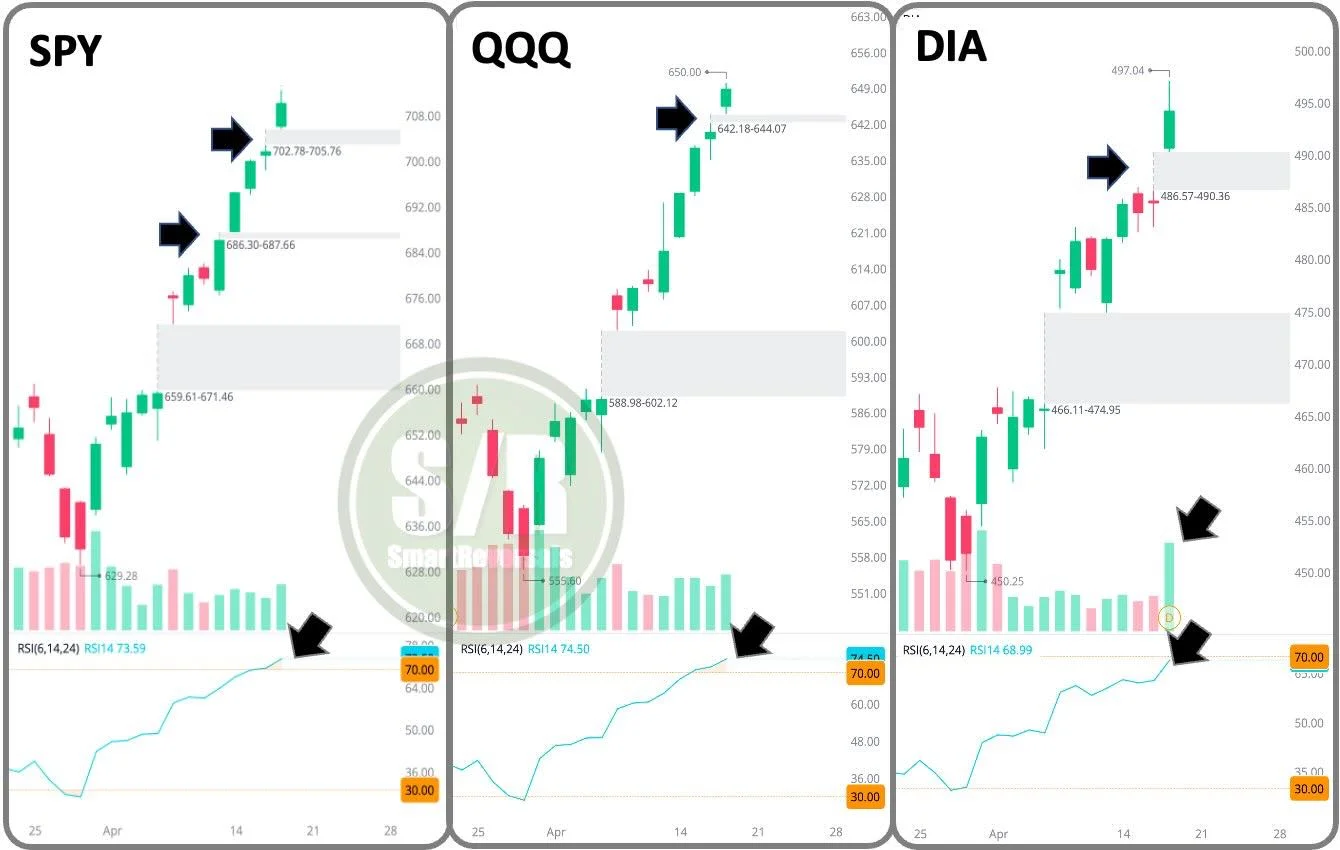
SPY Gap May Fill; DIA Shows Reversal Confirmation
GAP SYNCHRONY Distance vs. Friday Close: SPY: 702.78 (1.3%) RSI 73.5 QQQ: 642.18 (-1.2%) RSI 74.5 DIA: 486.6 (-2.1%) RSI 69 Daily Volume validating reversal candles, mostly on DIA. Healthy consolidation ahead. Will the $686.3 gap be filled for SPY? (-3.7% downside).
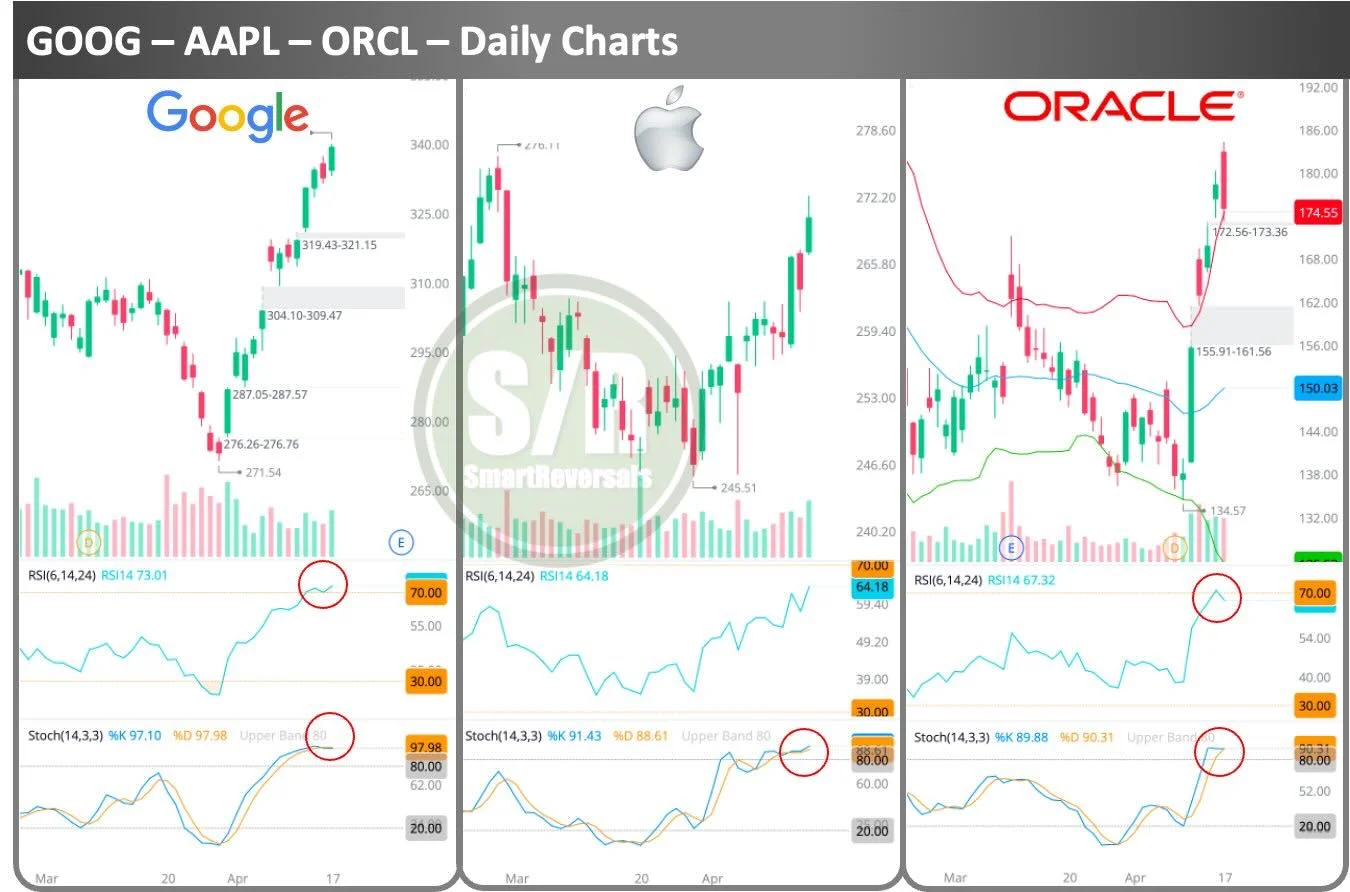
Solid Breakouts Ahead, Watch Consolidation Signals
Solid breakouts, be mindful of consolidations: #GOOG: Overbought RSI & Stochastic, $319 first gap #AAPL: Overbought Stochastic, RSI is ok, no gaps, some indecision #ORCL: Overbought RSI, Stochastic and Bollinger breached (big time), first gap at $172 💚🔁 for more
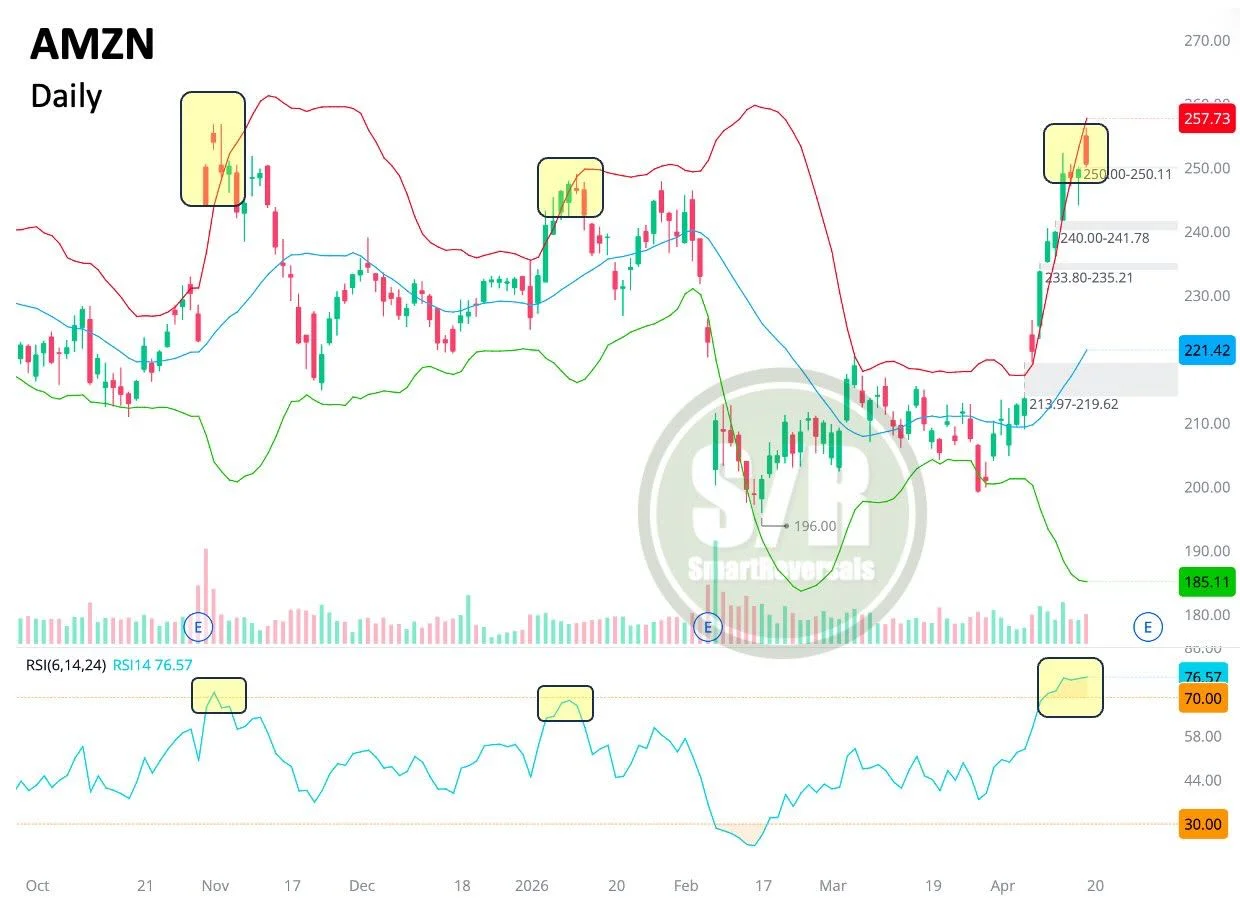
Amazon’s Overbought Signals Hint at Impending Pullback
AMZN: Upper Bollinger Band breached + overbought RSI have preceded notable pullbacks for Amazon. While the $213 may remain open (like $176 from 2025's bounce), other gaps are active magnets ahead of earnings: $250, $240, and $233. #QQQ
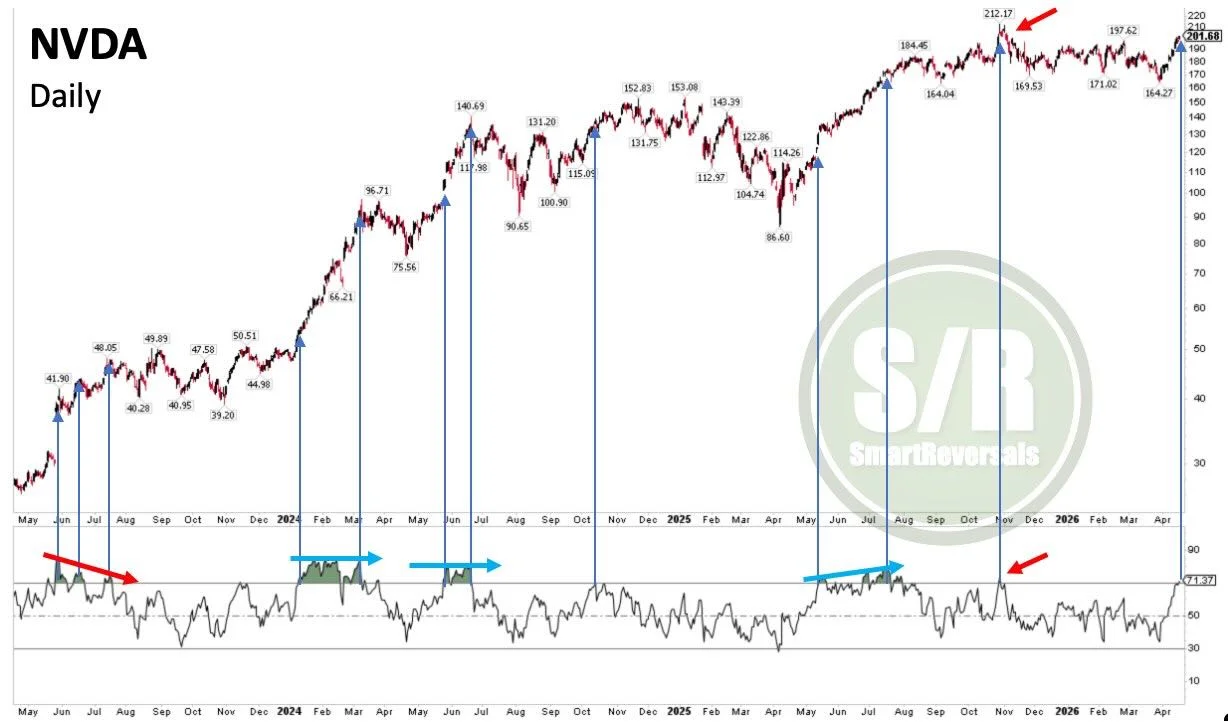
NVDA RSI Overbought Signals Potential Bullish Continuation
NVDA: The RSI is overbought for the first time since Oct2025. Next week will be key: Will the overbought condition persist, as in 2023, 2024, and 2025, or was this a "one-off" move before a decline similar to last October?...
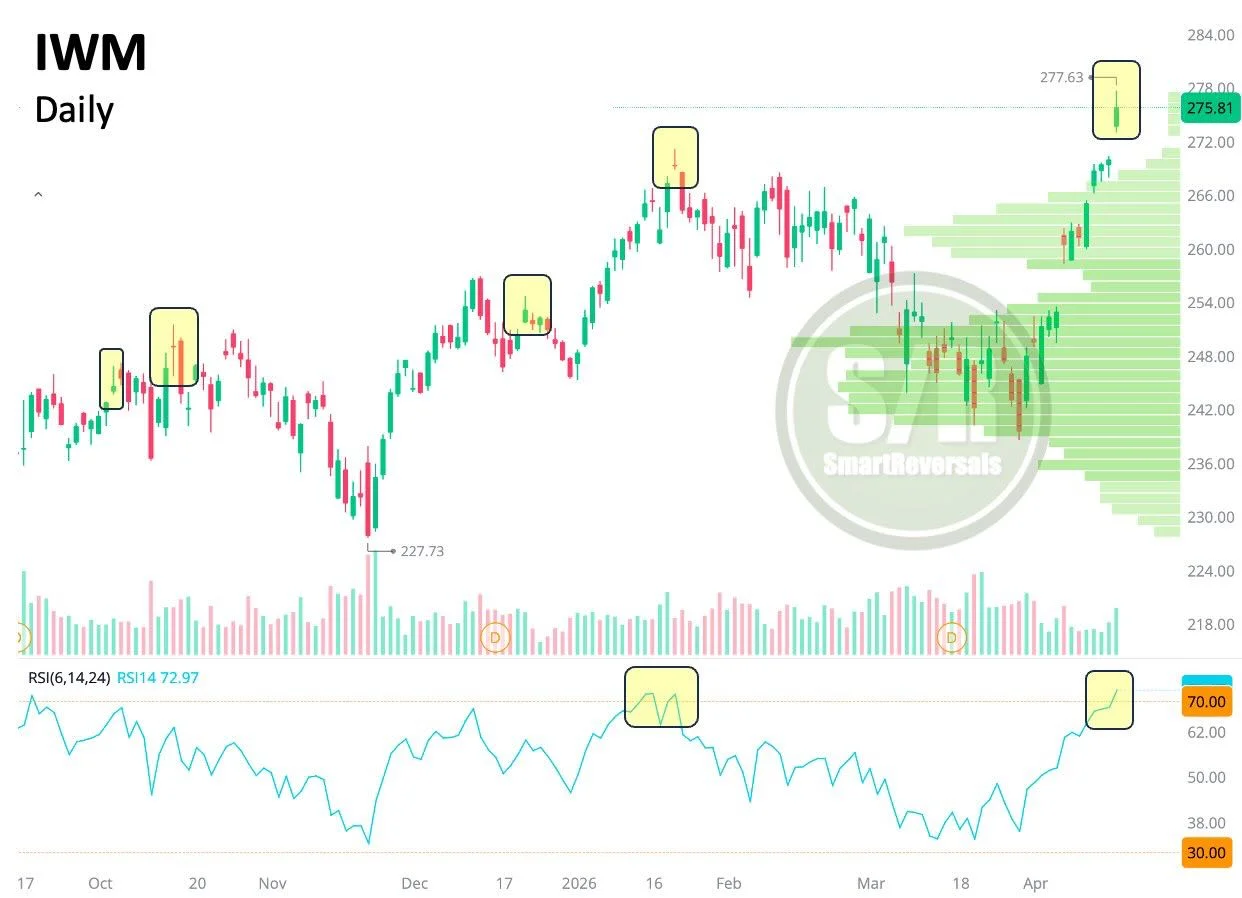
IWM Small Caps Overbought, Pullback Likely Ahead
IWM: After a strong +16% multi-week rally, small caps reached an RSI above 73, an overbought condition that suggest a healthy pullback. Today's gap and indecisive candle build on the thesis.
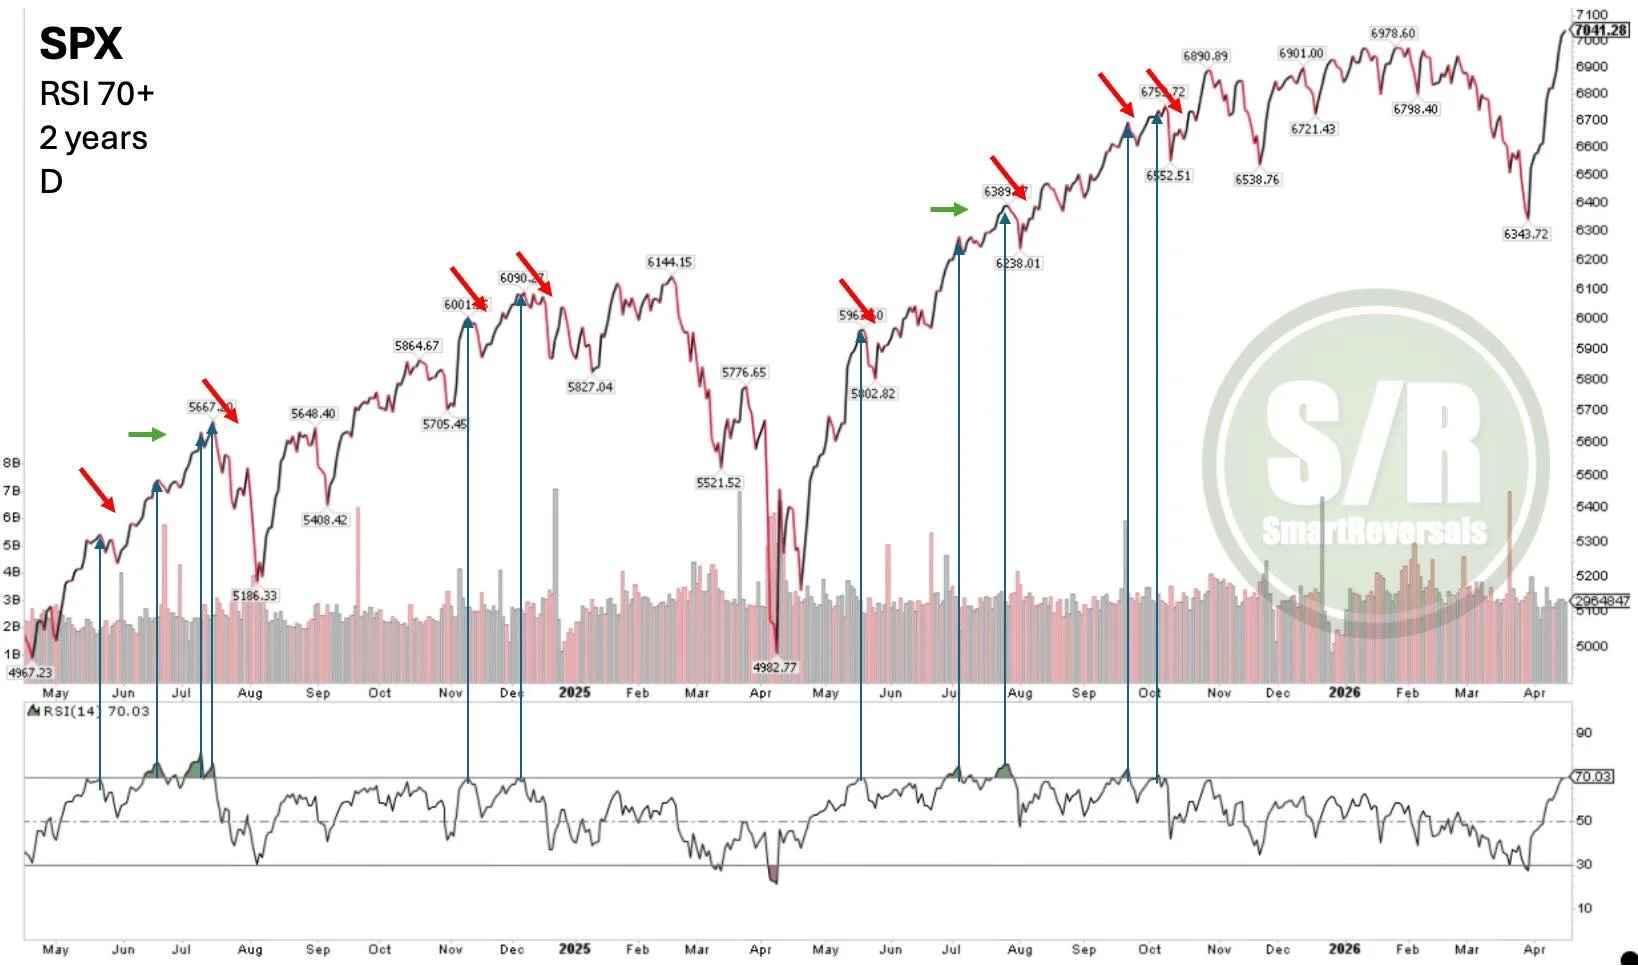
RSI 70+ Signals 80% Likelihood of Pullback
SPX: During the last 2 years, RSI 70+ triggered pullbacks 8/10 times. The other 2 instances saw flat consolidations. 80% chances for a healthy pullback? Pullbacks post-2025 rally were mild. #SPY
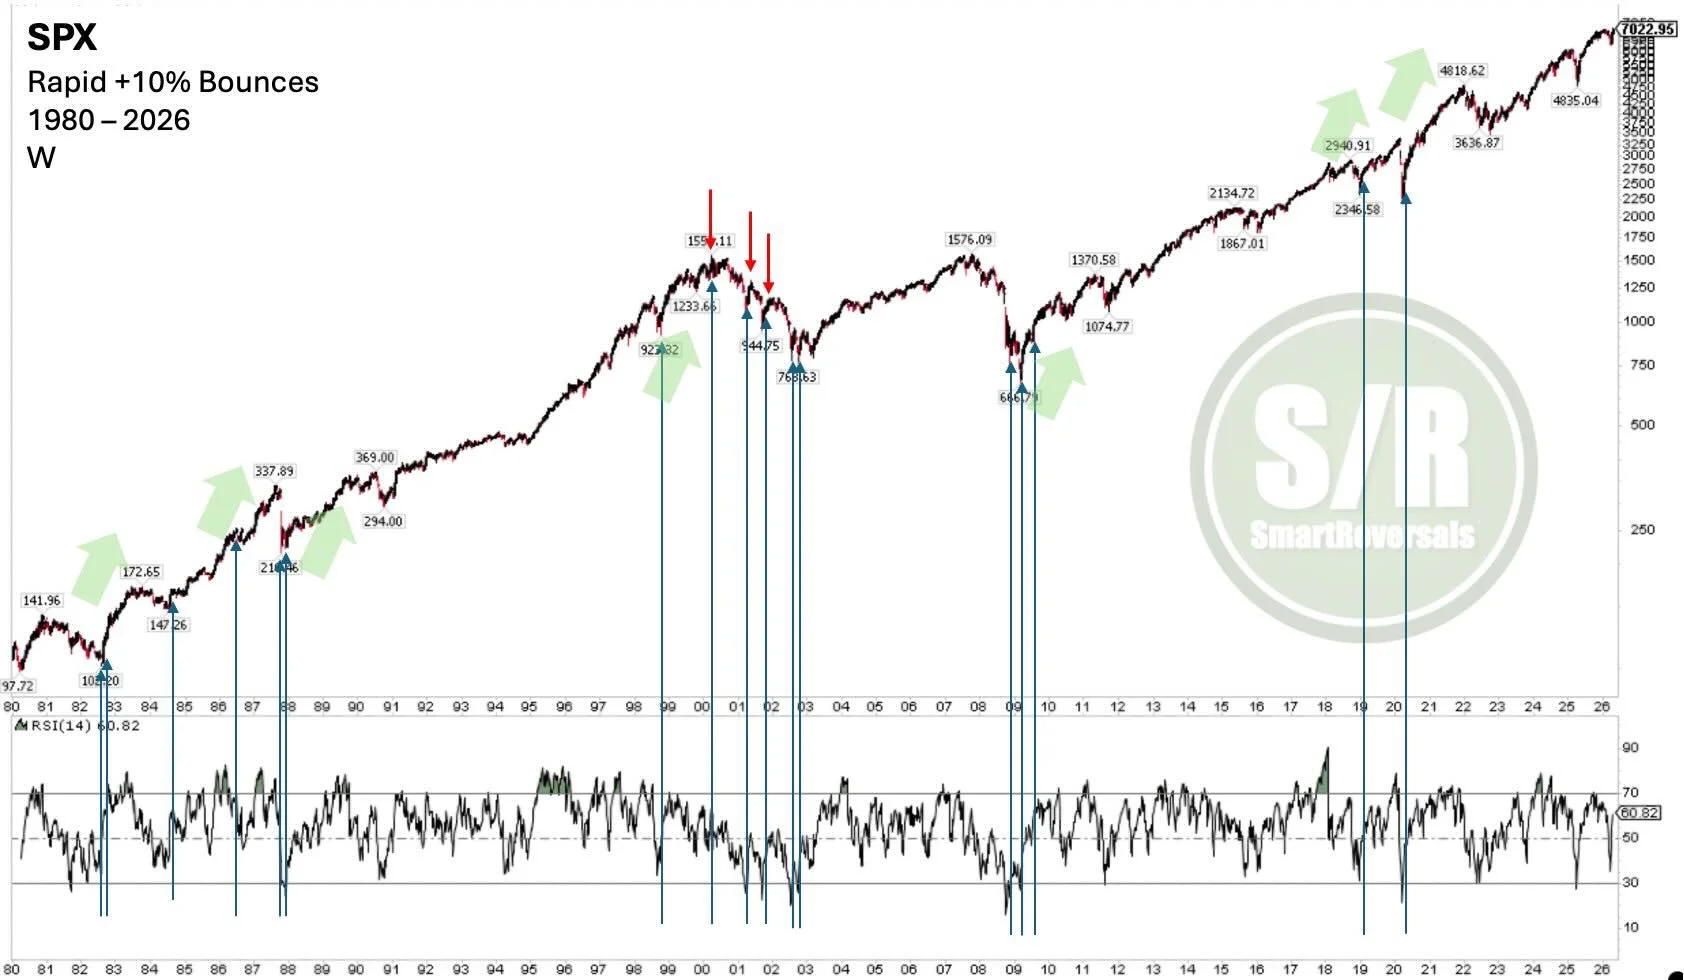
10‑Day 10%
SPX: Rapid 10% rallies in 10 days historically show strong follow-through. Data indicates a +0.6% average move 1 week later, +2.5% at 1 month, and +17% after a year. Even in exceptions like 2000, the trend holds for the first...
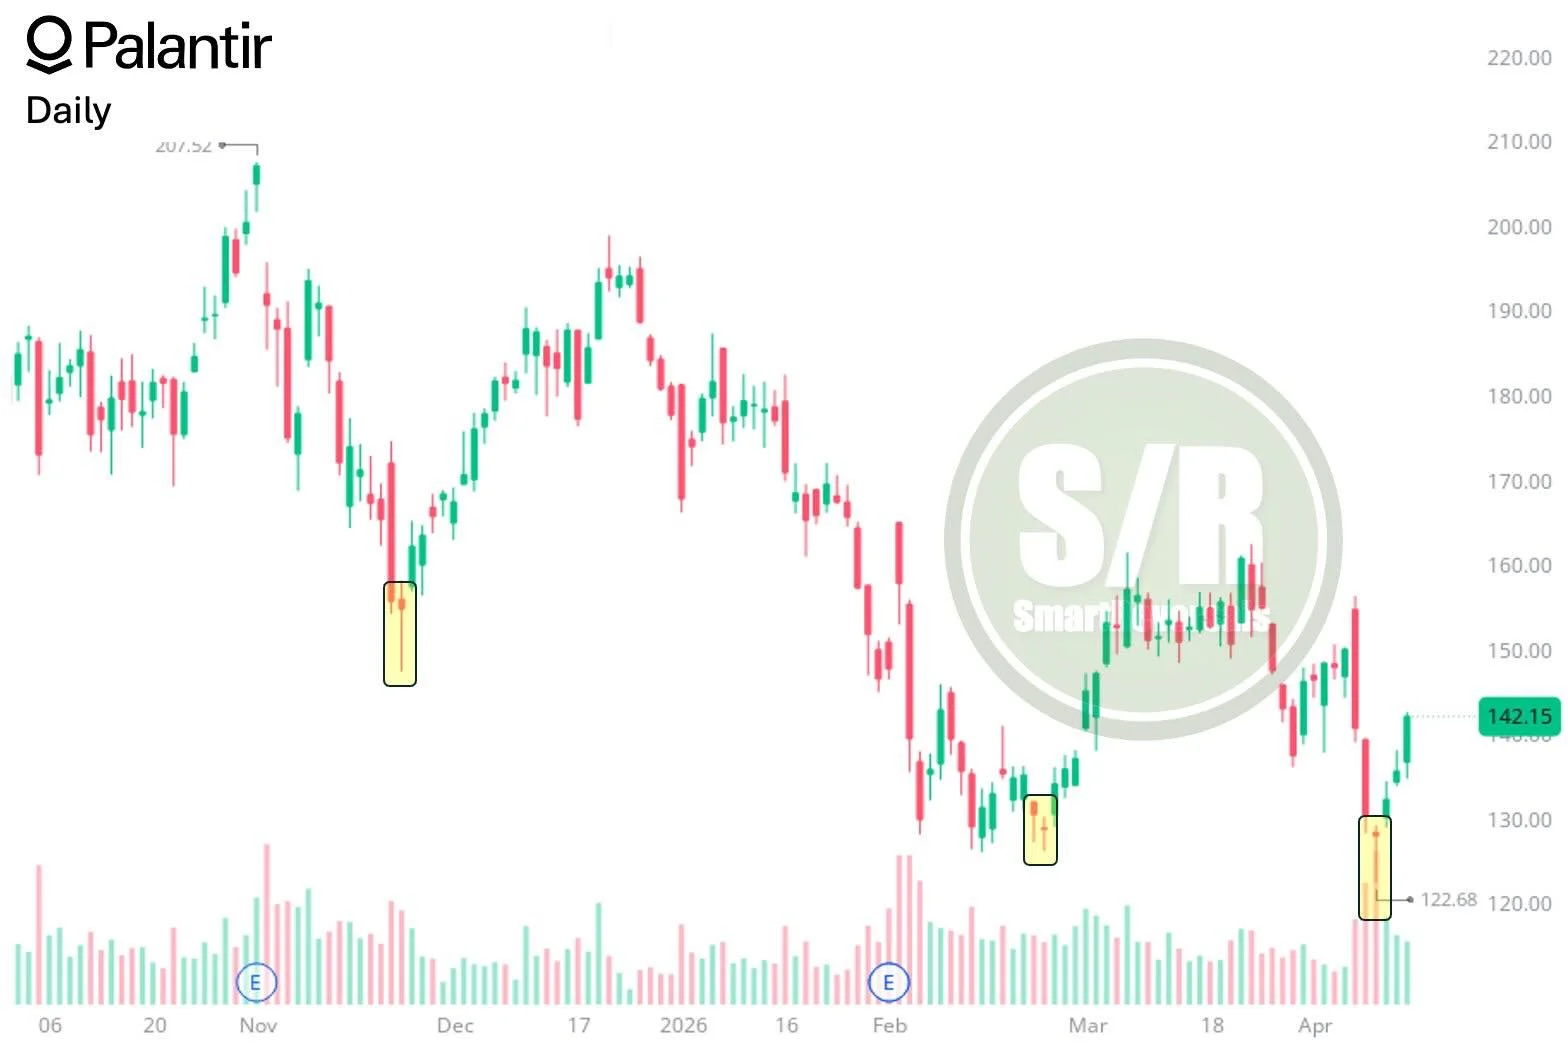
PLTR’s Bullish Candle Signals Bottom, Targets $145
PLTR: Price action is golden. The bullish candle printed on Friday validated by volume was a powerful bottoming signal I analyzed here for everyone. After the current +11% rally, $145 may serve as a consolidation zone. Software is coming back....
SPX Hits New Highs, Greed Signals Yet Consolidation Likely
SPX: Fresh all time highs and the price has just entered early greed territory. The RSI is not yet overbought, and the upper B. band suggests continuation. The bull train could offer soon a consolidation since market participation was low,...
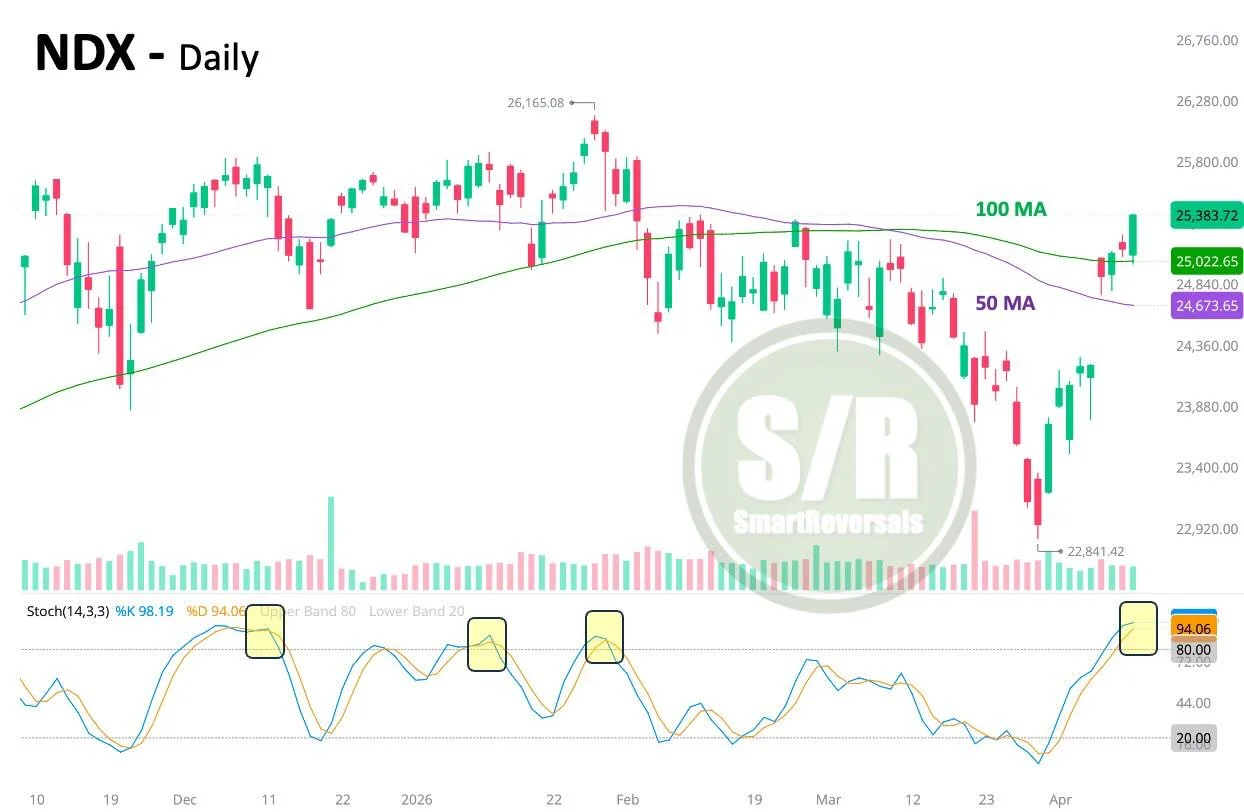
NDX Gap-Up Expected; Avoid Longs Near Resistance
NDX: A gap-up at the open is coming. Given the overbought oscillator, it's prudent to avoid chasing longs. Price action remains bullish above $25,256.6, while $25,514.1 is a key daily resistance level worth watching. The complete set of daily levels...
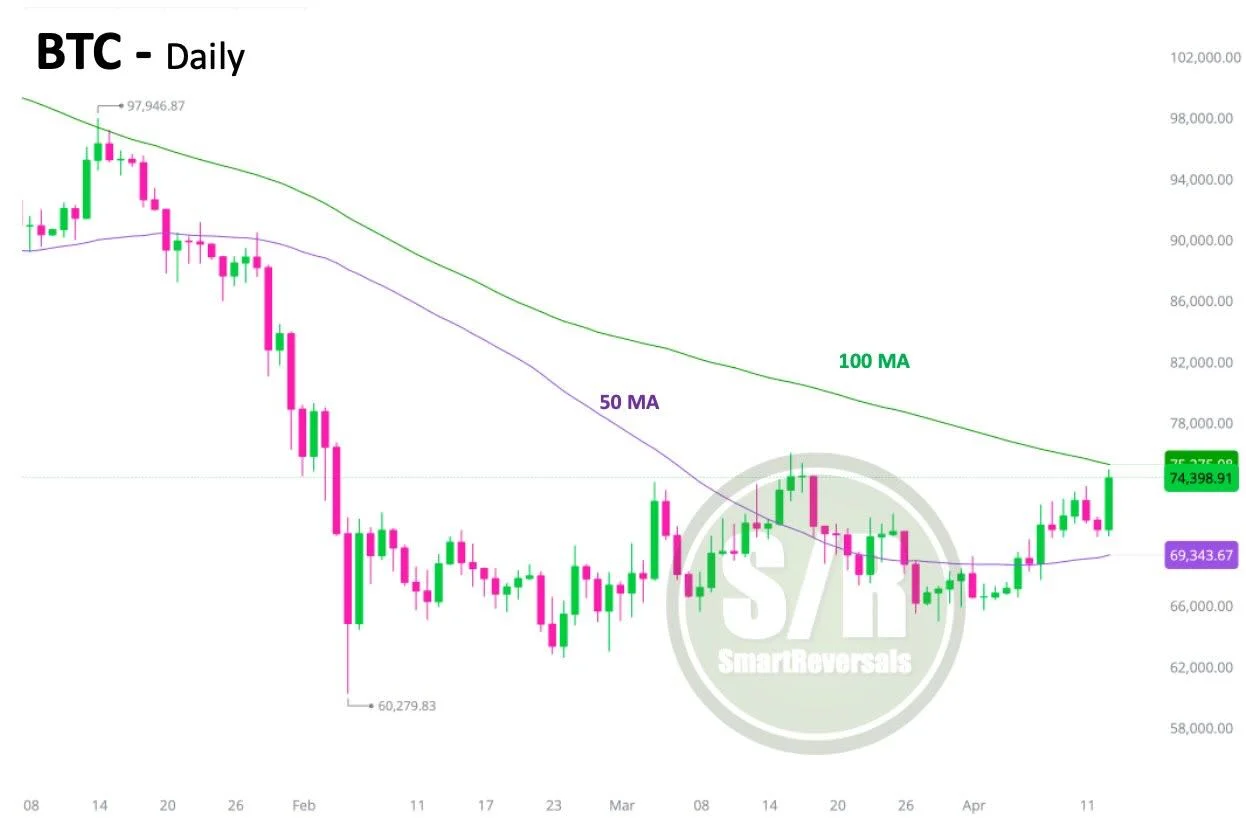
Bitcoin Breaks 50‑Day MA, Eyes 100‑Day Target
BTC: Bitcoin continues printing constructive price action, after conquering the 50DMA, the next stop is the 100DMA. There is no doubt the bottom is in. #Crypto #Bitcoin $ETH
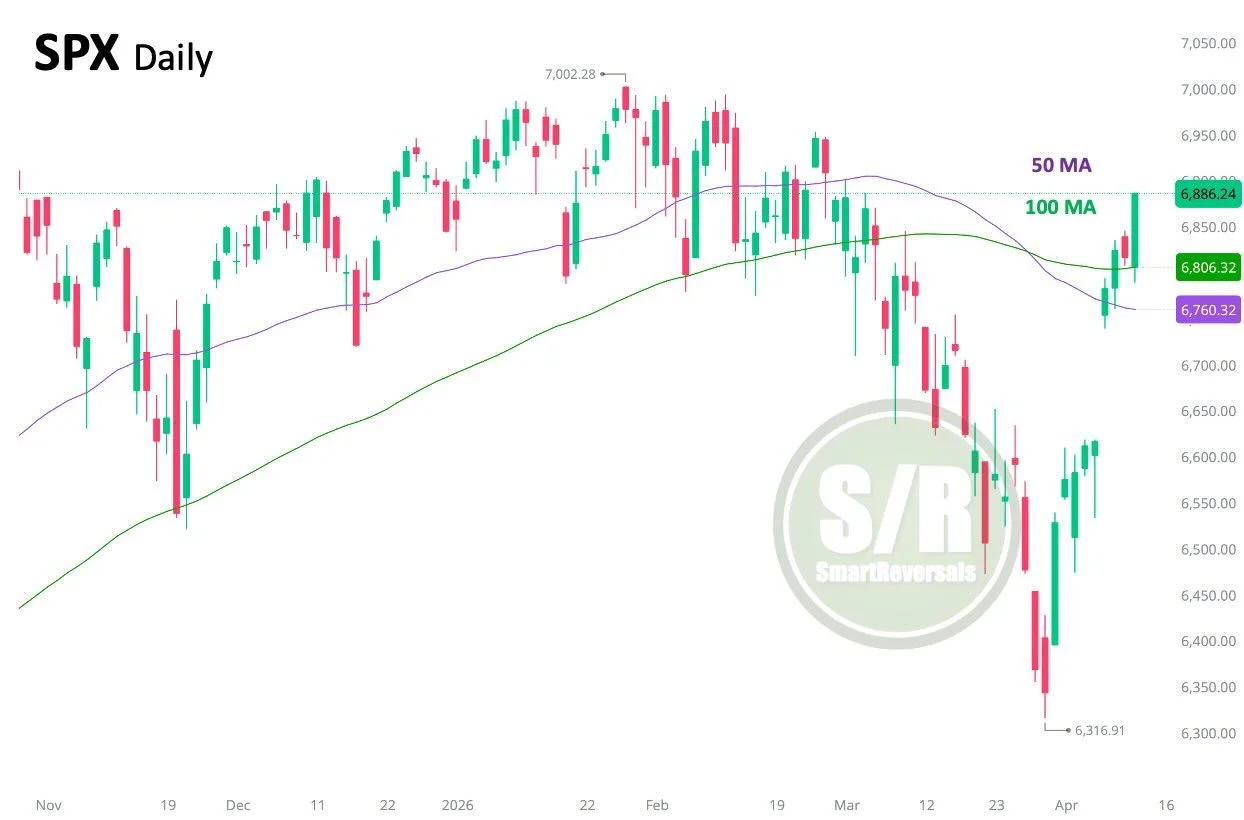
SPX Bounce Turns Key Level Into Support, Continuation Likely
SPX: Even bulls didn't expect this. Once the price bounced from the daily support zone of 6,786, it began gaining traction, then the key daily level of 6,823 flipped to support. With the 100DMA now recovered, the move suggests...
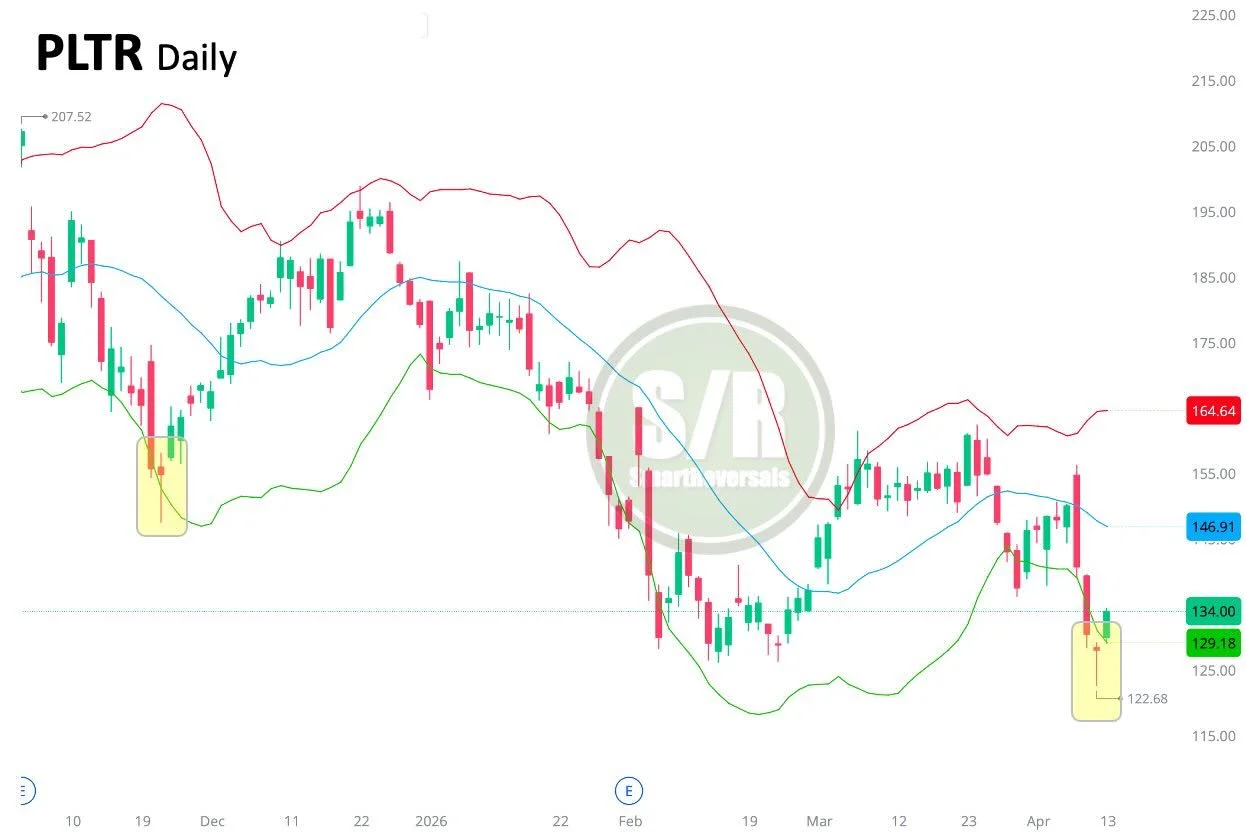
Palantir Poised for Reversal, +4.5% Surge Confirmed
PLTR As noted in Saturday’s Weekly Compass (link attached), price action was primed for a reversal. Following today's +4.5% surge, the full analysis is a must-read to manage risk and identify potential targets. Daily Levels for Palantir are posted in...
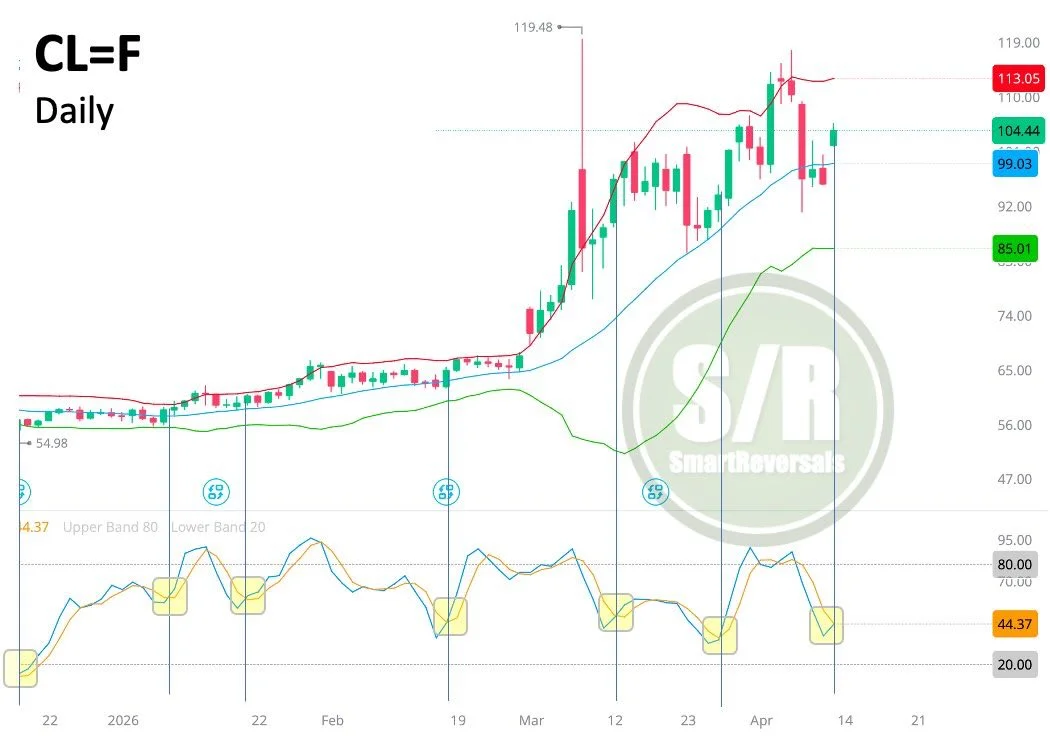
Stochastic Bullish Crossover Signals Crude Spike, SPX at Risk
#Oil: A bullish Stochastic crossover is forming, typically preceding multi-day spikes in #CL_F. The recovery of the 20DMA is concerning for #SPX bulls. The key weekly level is $101.4; if lost, the SPX could spike again. Otherwise, expect pressure on...
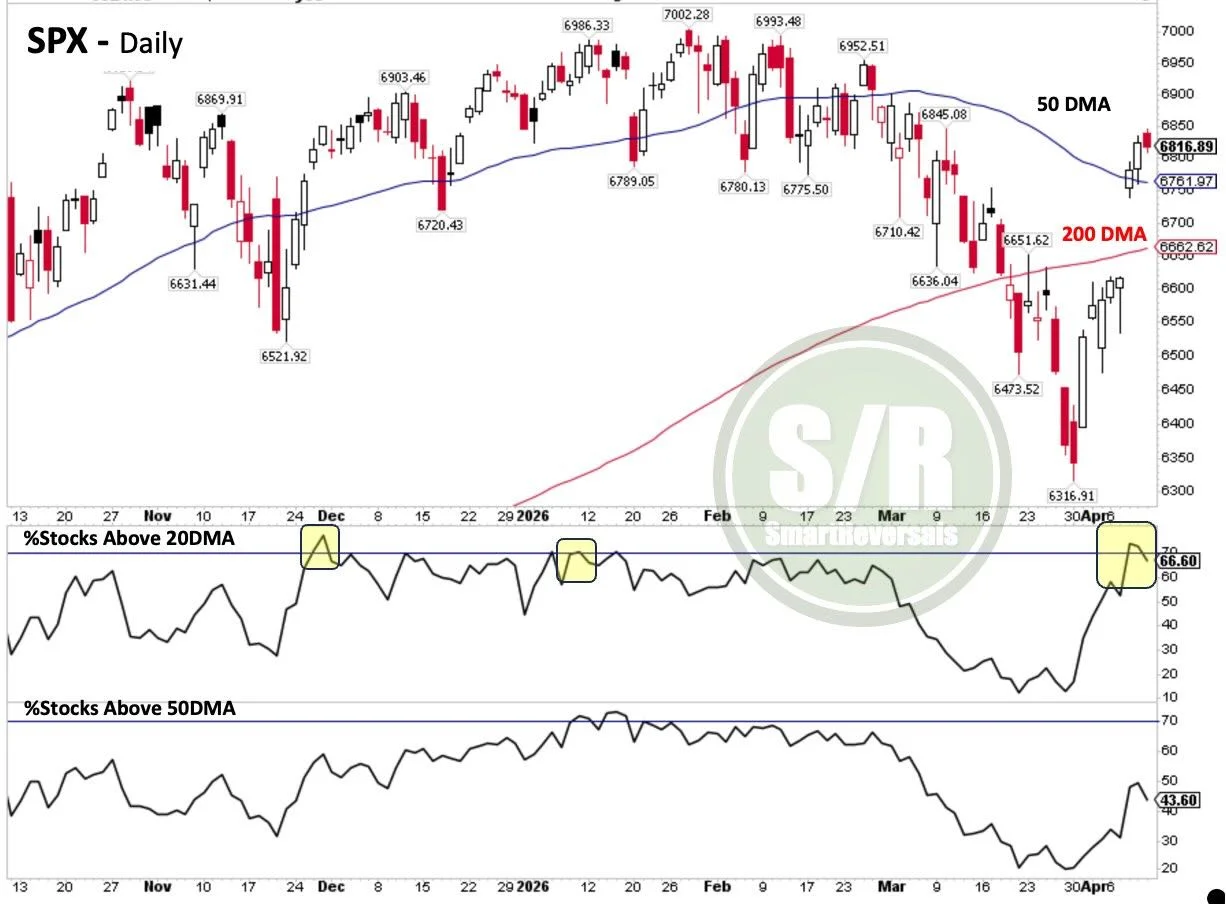
Stocks Above 20DMA Plunge, Consolidation Likely
SPX: The percentage of stocks above their 20DMA has reversed from 70%, usually a consolidation follows; this time potentially below the 50DMA. The market was driven by strength in Tech and Materials, overall participation was negative. #SPY
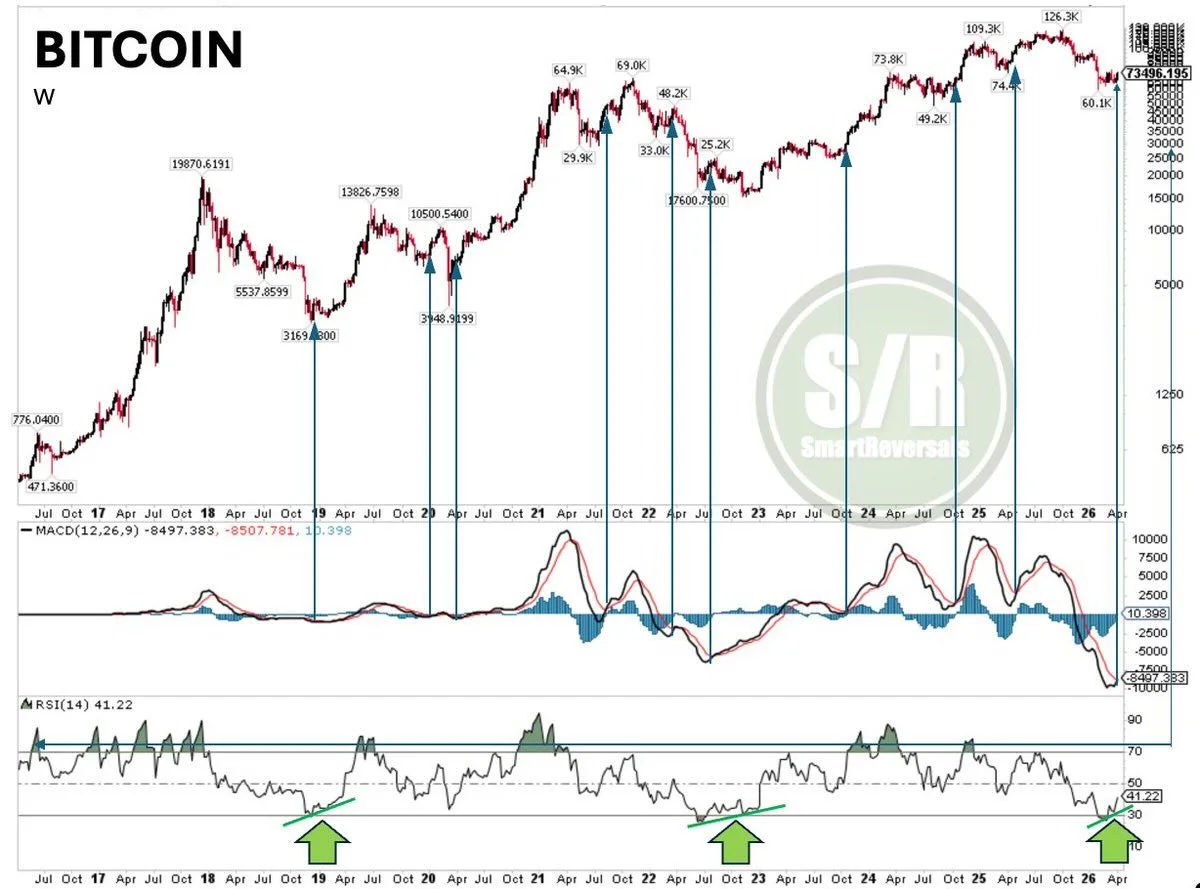
MACD Crossovers Plus RSI Divergences Boost Bitcoin Bullishness
#BTC: MACD crossovers have been a reliable bullish signal during the last three years. Occurrences before 2023 have preceded mixed outcomes. However, when combined with RSI divergences, the bullish thesis strengthens exponentially. #Crypto #Bitcoin #ETH
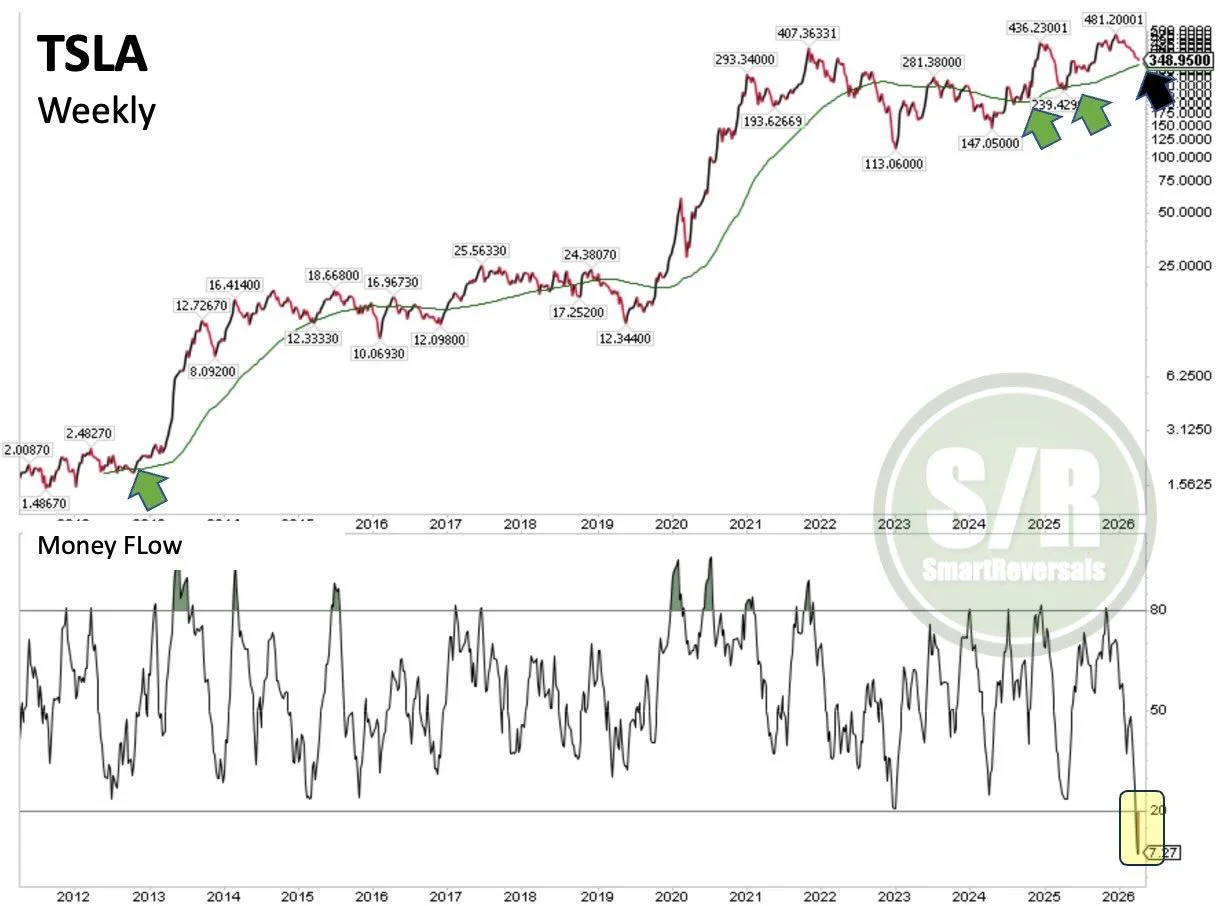
Tesla Near 100‑Week MA, Money Flow at Historic Low
#TSLA: Bounce Ahead? Money Flow is at historical lows on the weekly, and the price is sitting at the 100 week moving average which has supported the trend since August 2024. The bullish above/bearish below weekly level for Tesla is...
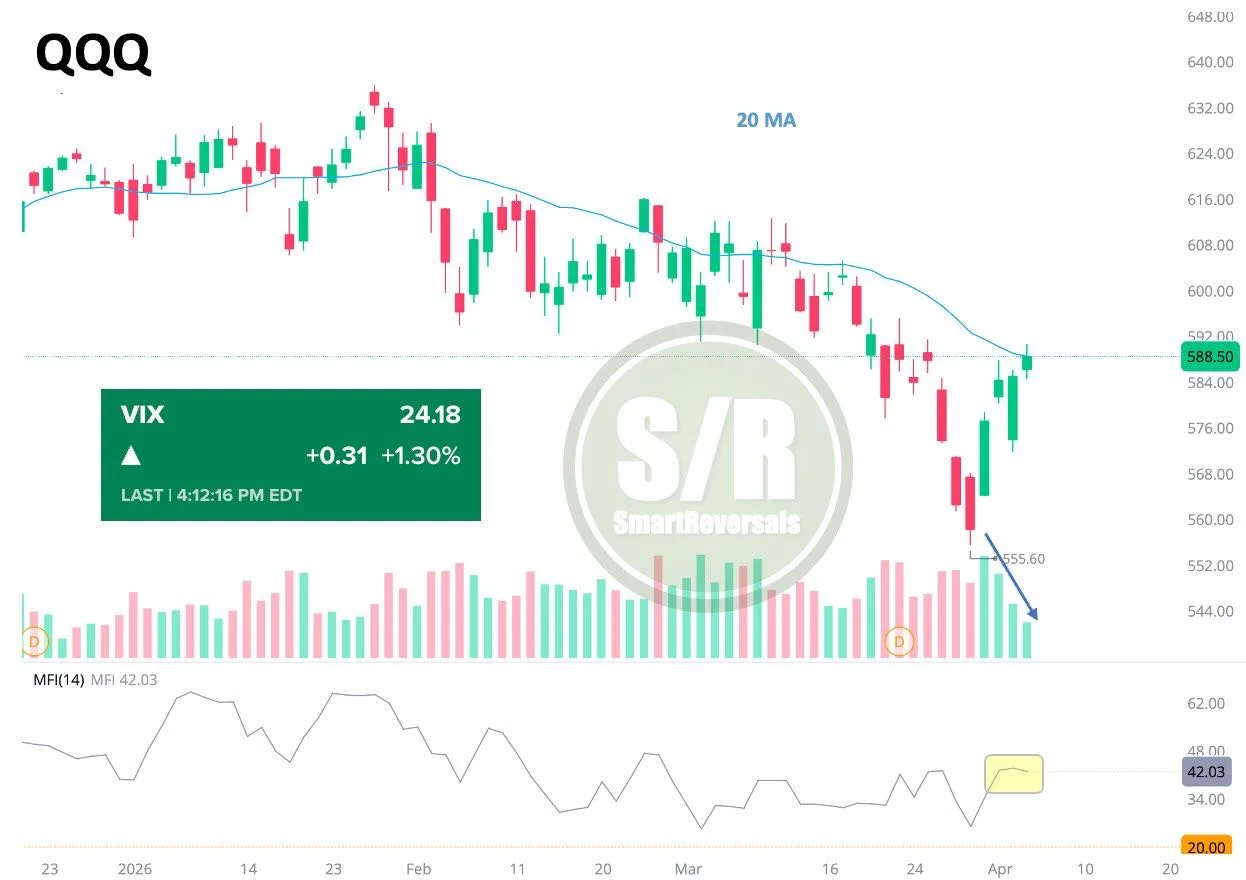
QQQ Holds, VIX Spikes Amid Iran Tension Risks
QQQ: +0.6%, not bad for Black Monday. Anyway, the price must stay resilient reclaiming levels. The 20DMA acted as resistance today. The setup is open to escalations in Iran with the daily volume and Money Flow both diverging from the...

Extreme Bearish Sentiment Triggers Relief Rally, Signals Bottom
SPX: Over the last 30 years, we have seen this level of bearish sentiment (55%) only a few times. Relief rallies have followed without fail; even when those rallies were short-lived A major bottom materialized few weeks after. #SPY #QQQ #NVDA...
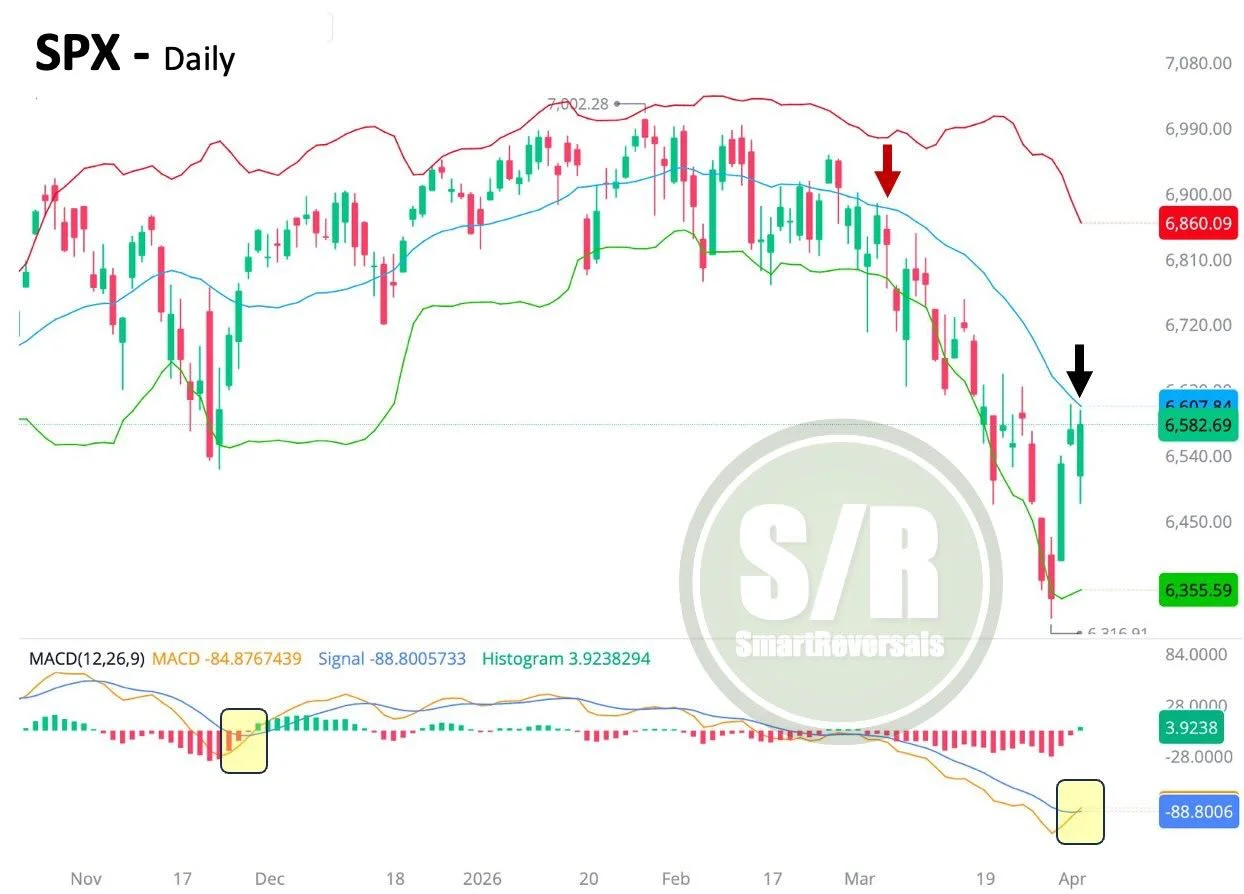
SPX MACD Cross Signals Potential Rally Above 20‑DMA
SPX: The bounce on Thursday completed a MACD cross that is worth watching even if there is a red opening this Monday. The new hurdle is the 20DMA, not touched for a month. Consolidation is likely, but even bear market...
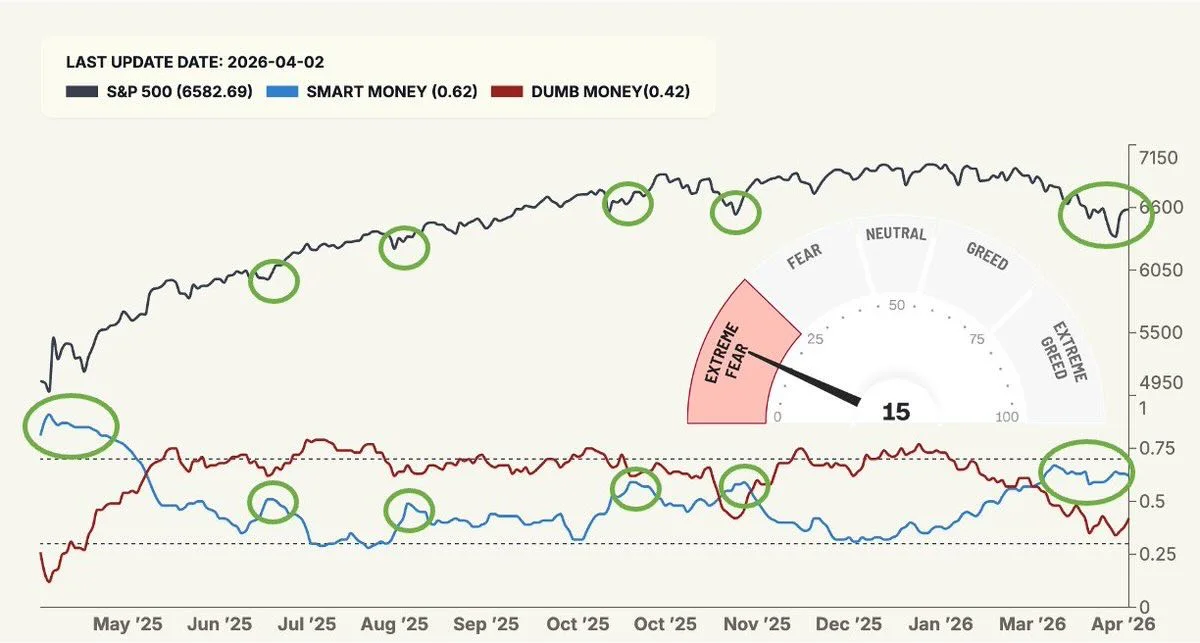
Smart Money Optimism Sparks Potential SPY Bounce
#SPX: Smart money confidence is optimistic while dumb money is neutral. The Fear & Greed Index continues at Extreme Fear. Green circles highlight increase in smart money confidence and bullish moves that followed. The bounce could have more fuel. $SPY
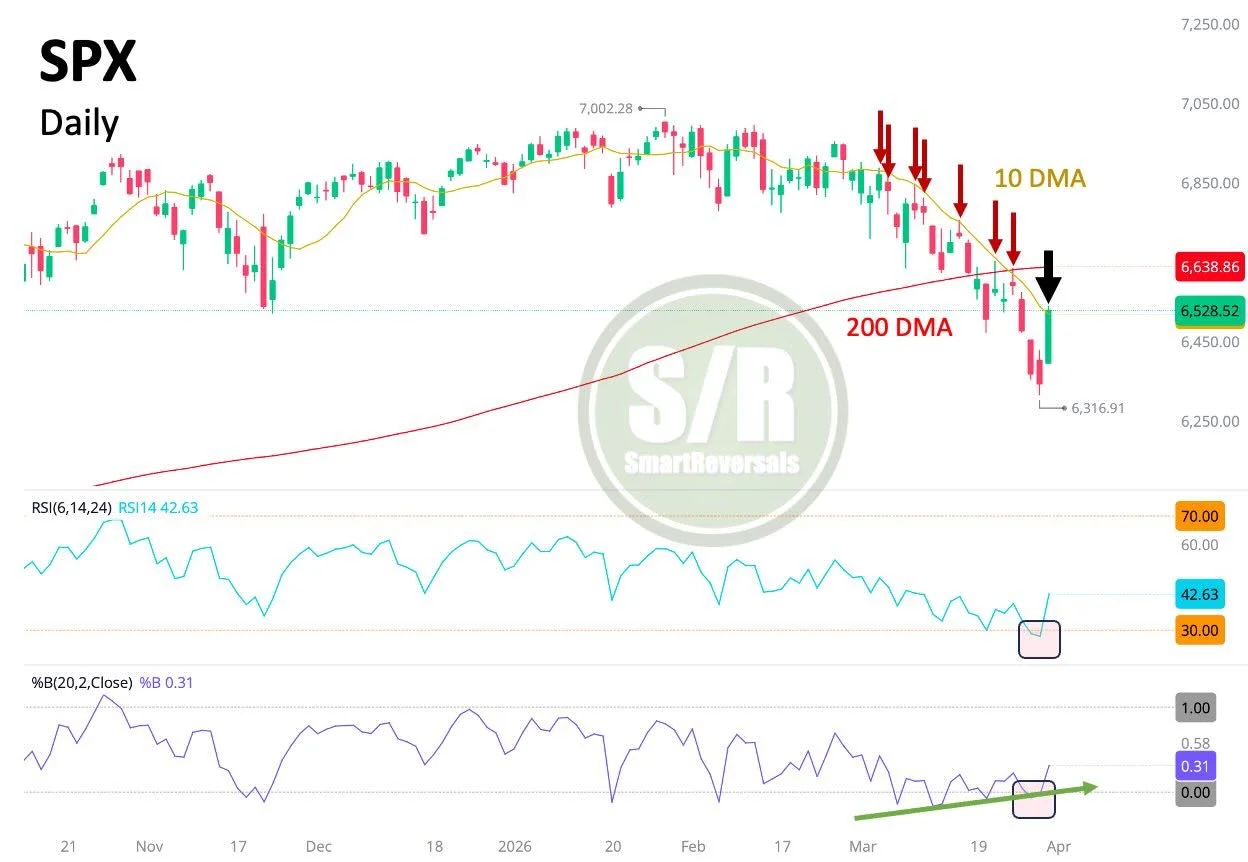
SPX Rebounds From Oversold, Eyes 200DMA Resistance
#SPX: As mentioned this weekend and yesterday, oversold conditions were extreme. Moment of Truth: Price filled the gap and hit the 10DMA, the dominant March trendline. Today’s difference: the candle shows bullish conviction. Next major hurdle: the 200DMA. #SPY
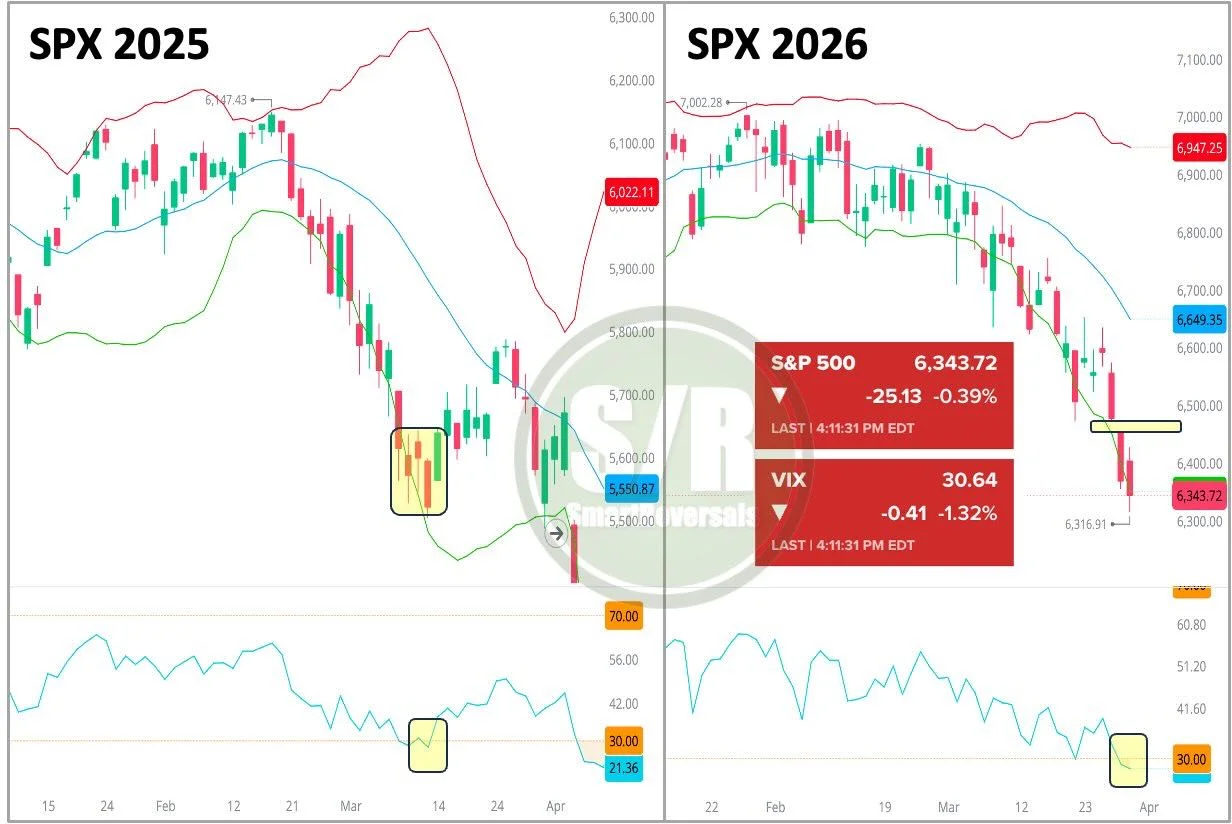
Oversold SPX Signals Potential Bounce, VIX Also Falling
#SPX: Be careful about being too bearish in the short term, as the $VIX also closed in the red. The similarity to 2025 is impressive, especially with the RSI below 30 and the lower Bollinger Band breached; both oversold conditions...
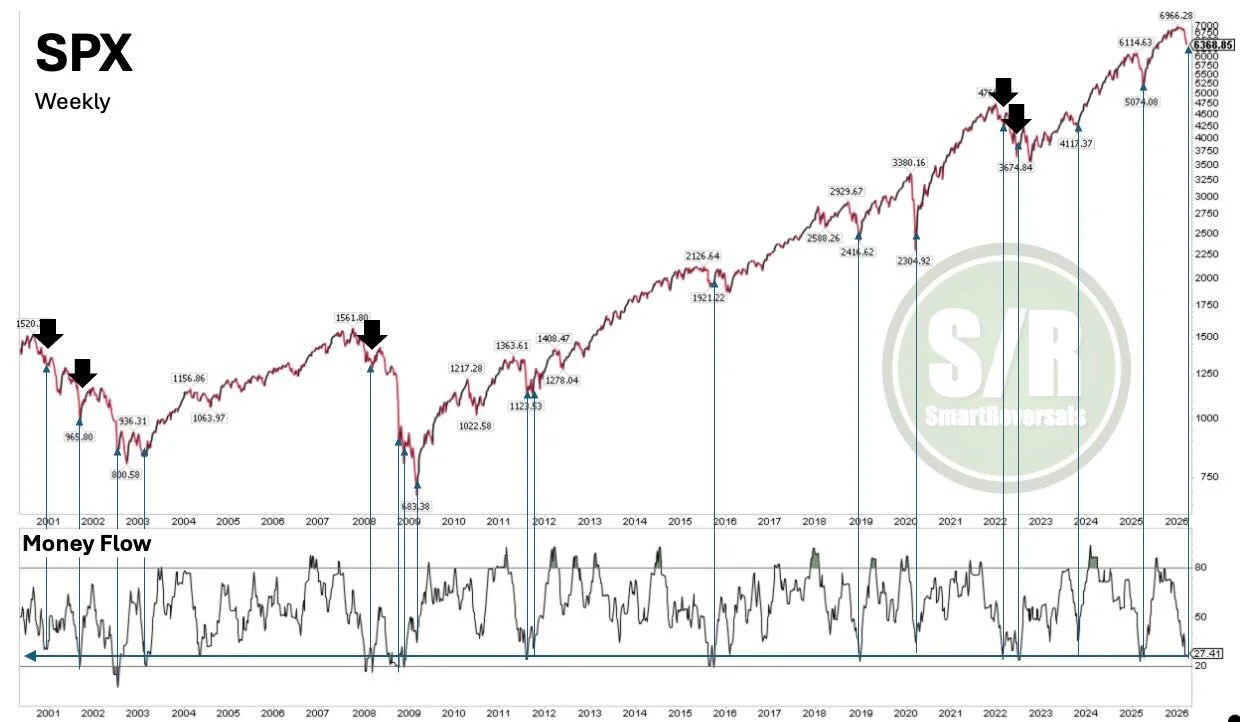
Low Money Flow Index Signals Imminent SPX Bounce
#SPX: The Money Flow Index is at significant lows, suggesting a tactical bounce is nearby as analyzed since 2000. Black arrows highlight relief bounces even in bear markets. While major bottoms have also followed (2023), the price must recover key...
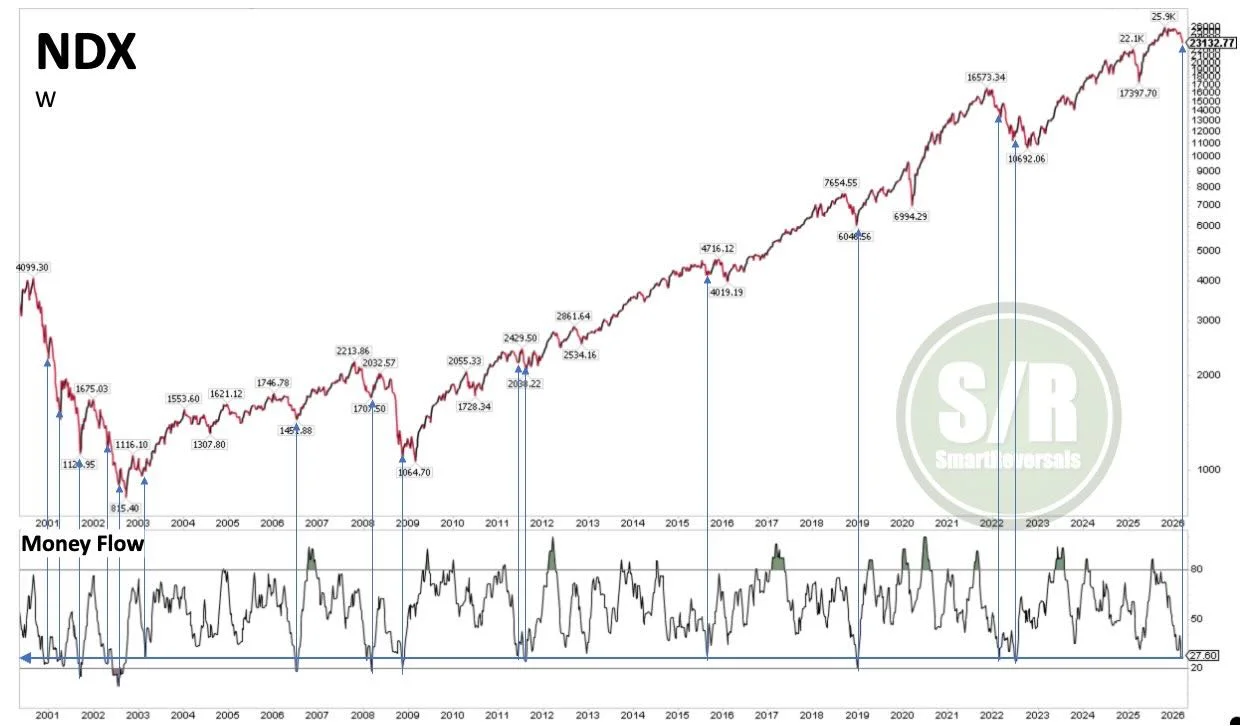
MFI at 25‑year Lows Signals Imminent Relief Rally
#NDX: Over the last 25 years, a relief rally has followed when the Money Flow Index reached current levels. There have been no exceptions, including the dot-com bubble in 2000, the 2008 Financial Crisis, and the 2022 bear market. The...
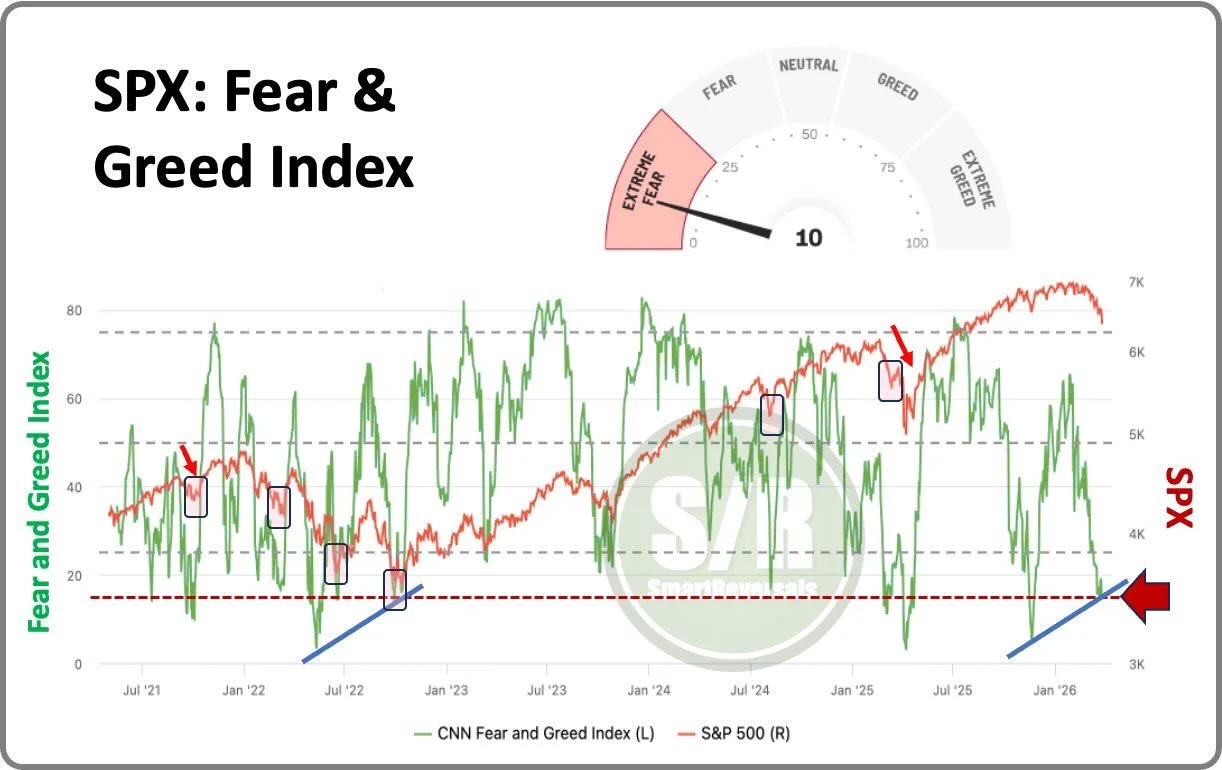
Extreme Fear Level 10 Signals Upcoming Bullish Turn
#SPX: This level of extreme fear (10) has been seen at previous bottoms, including those that preceded bear market rallies in 2022. The shortest bounce before lower lows occurred in 2025. A bullish divergence is now appearing, which validates the...
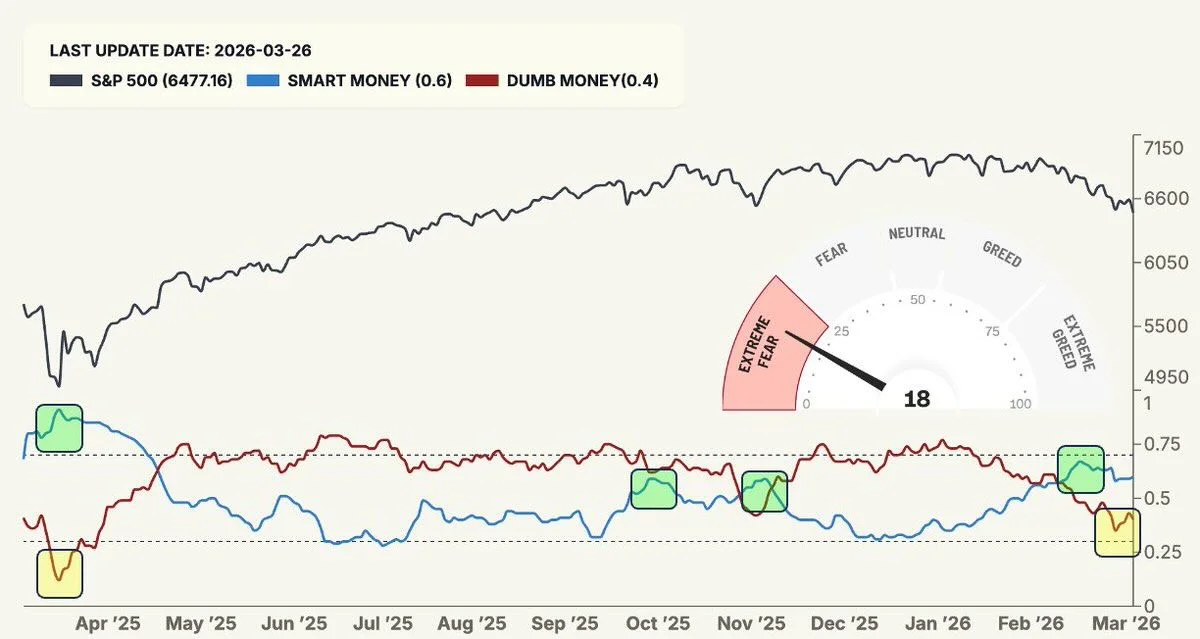
Smart Money Gains Confidence; Patience Beats Shorts
#SPX: Smart money confidence is growing while dumb money confidence falls. Meanwhile, the Fear & Greed Index has hit Extreme Fear. Yes, the setups across the board look ugly, but chasing shorts here is riskier than remaining patient.🌮
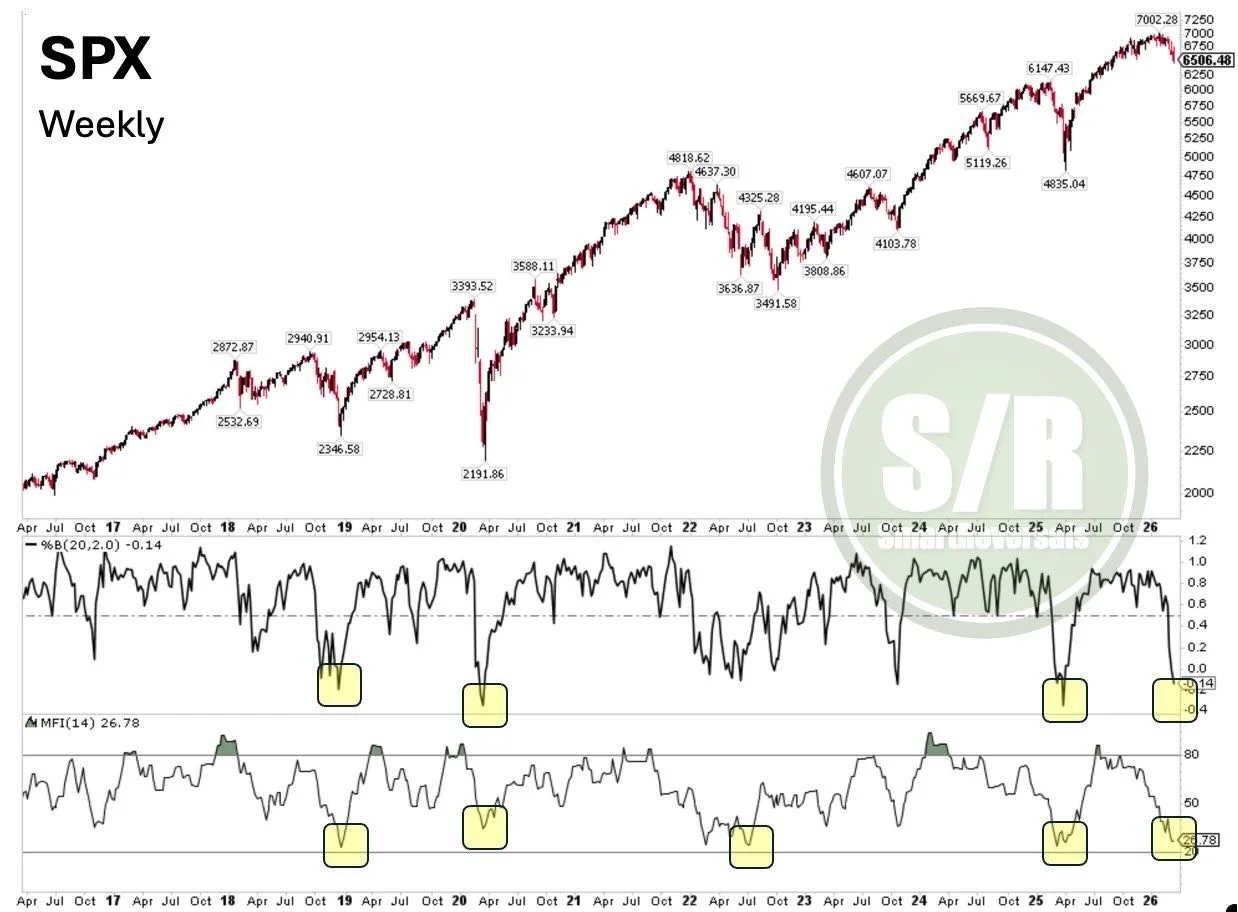
Time‑Based S&P Bottom Near; Money Flow Signals Reversal
#SPX: A bottom is near in terms of Time, not necessarily in terms of Price. Money Flow is nearing the 2018, 2022, and 2025 lows and has already dropped below the 2020 levels. While the %B is also oversold. After...

Volatility Confounds Bears; Navigate With Clear Criteria
The Weekly Compass is Live: Volatility has dominated over the last weeks confusing even the bears, despite the clear bearish resolution. I break down the essential criteria and the specific levels you need to navigate this environment without getting caught in...
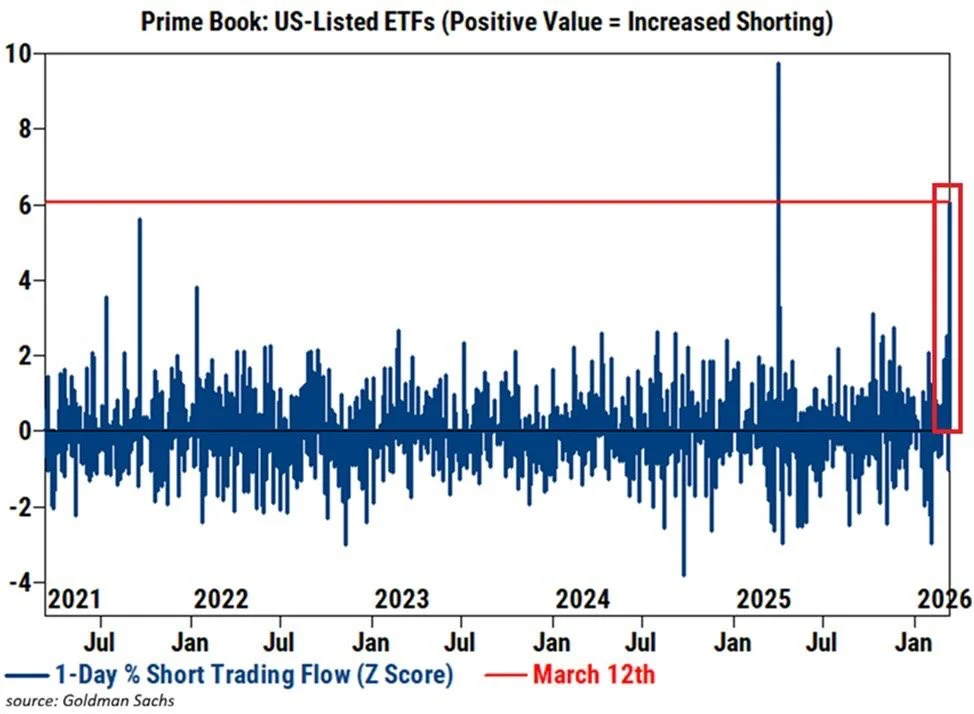
Record Hedge Fund Shorts Signal Imminent Squeeze
Bearish hedge fund positioning is extreme: Shorts in US-listed ETFs +10% Thursday—2nd-biggest daily jump since 2016 (only topped by +16% on April 2, 2025 “Liberation Day”). ETF shorts +12% this week (after +8% last), +23% in last month. US macro shorts (incl. index...
QQQ Money Flow Index Ultra‑Oversold, Bearish Slide Likely Over
QQQ: The Money Flow Index is as oversold as the 2023 correction and the 2025 bottom. It sits BELOW COVID crash levels, exceeded only by the 2022 bear market lows. Most of the bearish move is likely in.

Systematic Strategy Hits 8 of 9 Targets Amid Volatility
The Weekly Compass is Live In a week defined by high volatility, our systematic approach delivered results: 8 of 9 high-probability setups reached their targets 🎯. Access the new weekly plan and a neutral volatility assessment. https://open.substack.com/pub/smartreversals/p/tension-at-the-gate
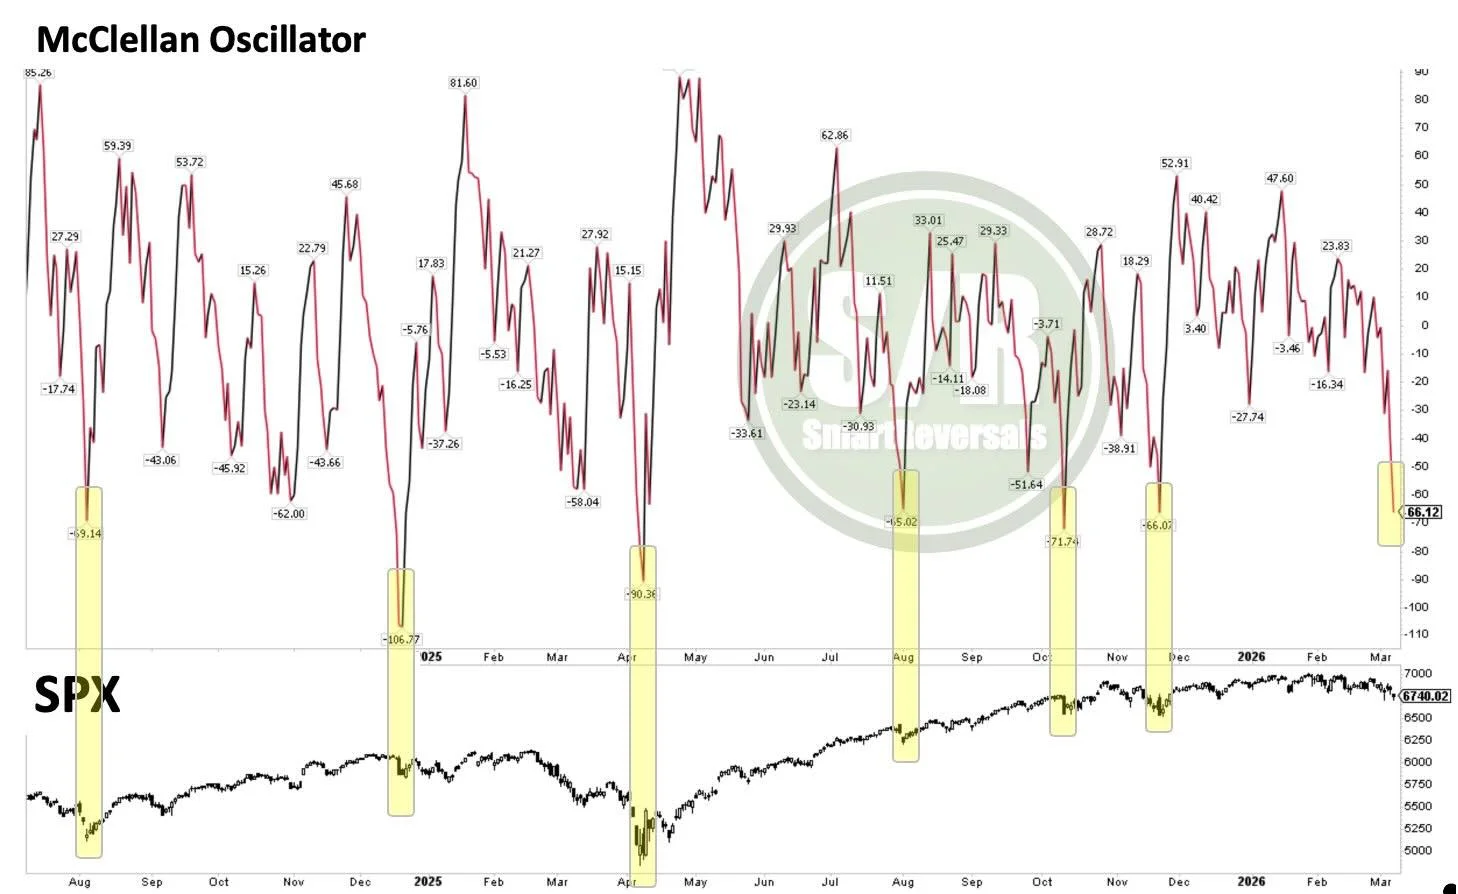
McClellan Oscillator Signals Bounce After 2024 Carry‑Trade Selloff
#SPX: The McClellan Oscillator has reached levels where price action begins to form a bounce, including the August 2024 Carry Trade selloff and the 2025 Tariff Crash.
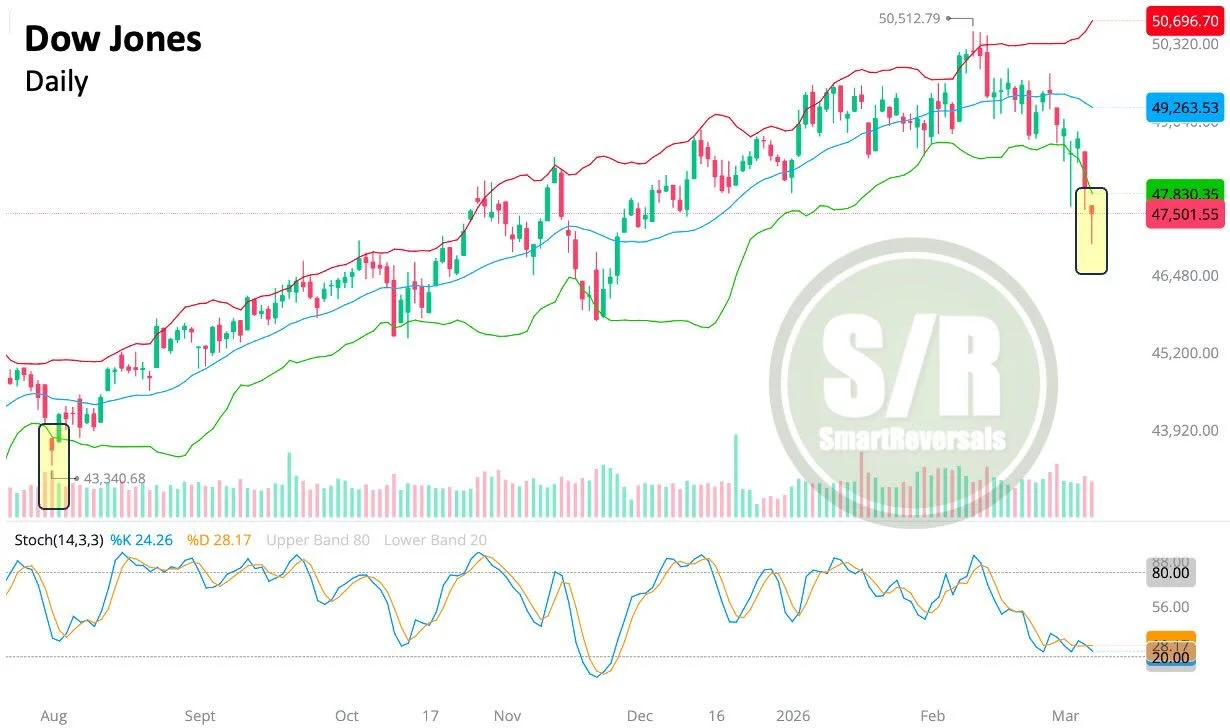
Bullish Candle Below Bollinger Signals Dow Bounce
#DJI: Buyers stepped in forming a bullish candle below the Bollinger band; a rare condition that typically triggers a bounce in the #DowJones. The Oscillator is oversold.