Customize Preconfigured Views for AWS, Azure, and Google Cloud with Cloud Provider Observability in Grafana Cloud
Why It Matters
The feature lets enterprises align multi‑cloud monitoring with internal workflows, speeding up troubleshooting and reducing context‑switching across observability tools.
Key Takeaways
- •Custom dashboards can be set as default for any cloud service.
- •AI can generate ready‑to‑use dashboards with correct variables.
- •Instance drill‑down panels are editable from a single configure page.
- •Quick links let users switch between prebuilt and custom views instantly.
- •Changes propagate across services tab, entity graph, and Database Observability.
Pulse Analysis
Enterprises running workloads on AWS, Azure, and Google Cloud rely on Grafana Cloud’s prebuilt observability dashboards to get a quick health snapshot. While those out‑of‑the‑box views are useful for rapid onboarding, many organizations already maintain internal monitoring standards, naming conventions, and alerting logic. A single, consistent UI across multiple cloud providers is essential for reducing cognitive load and ensuring that engineers can focus on root‑cause analysis rather than re‑creating familiar panels.
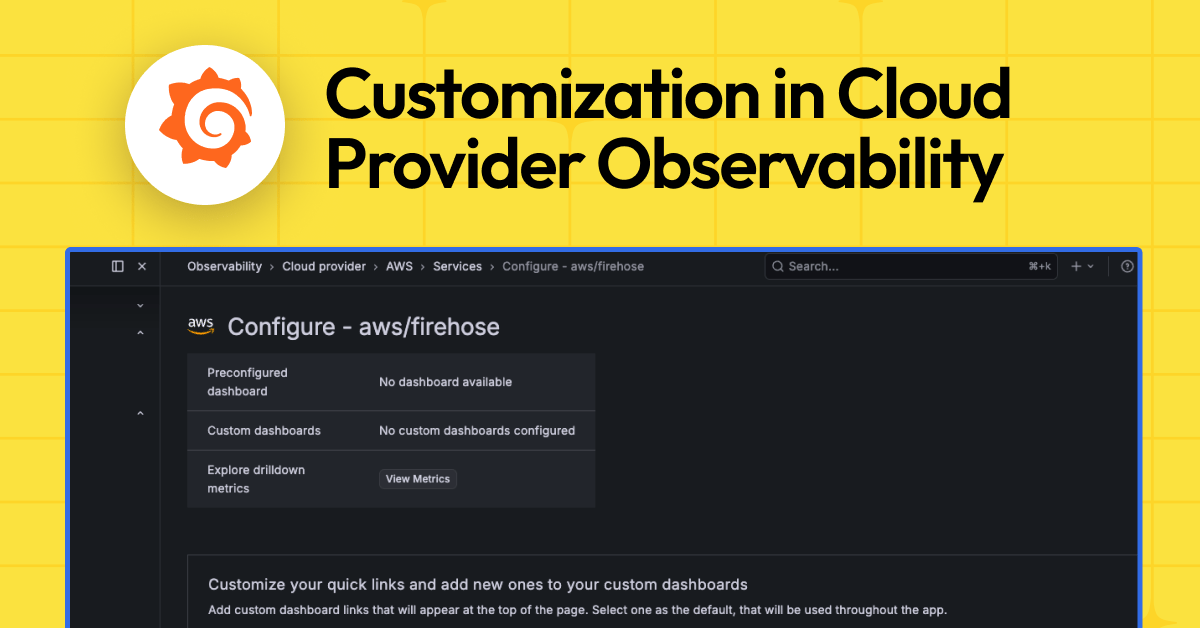
Grafana’s new customization layer centers on the service‑specific "Configure" page, where three distinct pathways let teams tailor their experience. First, any existing Grafana dashboard can be linked as a quick‑access option and promoted to the default view, instantly replacing the generic panel set. Second, the integrated AI assistant can generate a fully‑featured dashboard with appropriate variables and RED/USE‑style panels, offering a fast‑track for teams lacking a ready‑made view. Third, the instance drill‑down layout—displayed when clicking an individual RDS instance, Lambda function, or VM—can be edited directly, allowing custom queries, panel ordering, and formatting to be defined once and reused across the services tab, entity graph, and Database Observability modules.
The business impact is immediate: engineers spend less time navigating disparate dashboards and more time resolving incidents. Consistent default views streamline onboarding for new hires and enable cross‑team collaboration, while AI‑generated dashboards lower the barrier for smaller teams to achieve enterprise‑grade observability. As multi‑cloud strategies become the norm, Grafana’s flexible customization positions it as a go‑to platform for organizations that demand both out‑of‑the‑box speed and deep, policy‑driven control over their monitoring stack.
Customize preconfigured views for AWS, Azure, and Google Cloud with Cloud Provider Observability in Grafana Cloud
Comments
Want to join the conversation?
Loading comments...