Jan Kristof Nidzwetzki: Tracing PostgreSQL Using eBPF and Hardware Breakpoints
Companies Mentioned
Why It Matters
Lower‑overhead tracing enables DBAs and developers to gain fine‑grained visibility into PostgreSQL performance without significantly degrading throughput, facilitating proactive tuning and debugging.
Key Takeaways
- •Hardware breakpoints trigger eBPF without modifying function code.
- •They reduce overhead compared to uprobes, ~30% vs 38% slowdown.
- •Used to monitor PostgreSQL transaction IDs and OID assignments in real time.
- •Limited to ~4 breakpoints per CPU, requiring careful address selection.
Pulse Analysis
eBPF has become a cornerstone for observability on Linux, allowing user‑space programs to run custom code in the kernel when specific events occur. Traditional uprobes insert a software interrupt at function entry or exit, which, while powerful, forces the kernel to replace instructions and incurs a noticeable mode‑switch cost. Hardware breakpoints, by contrast, exploit the CPU's built‑in debug registers to watch memory accesses directly, eliminating the need for instruction patching and reducing the per‑event overhead. This distinction is critical for workloads that trigger probes thousands of times per second.
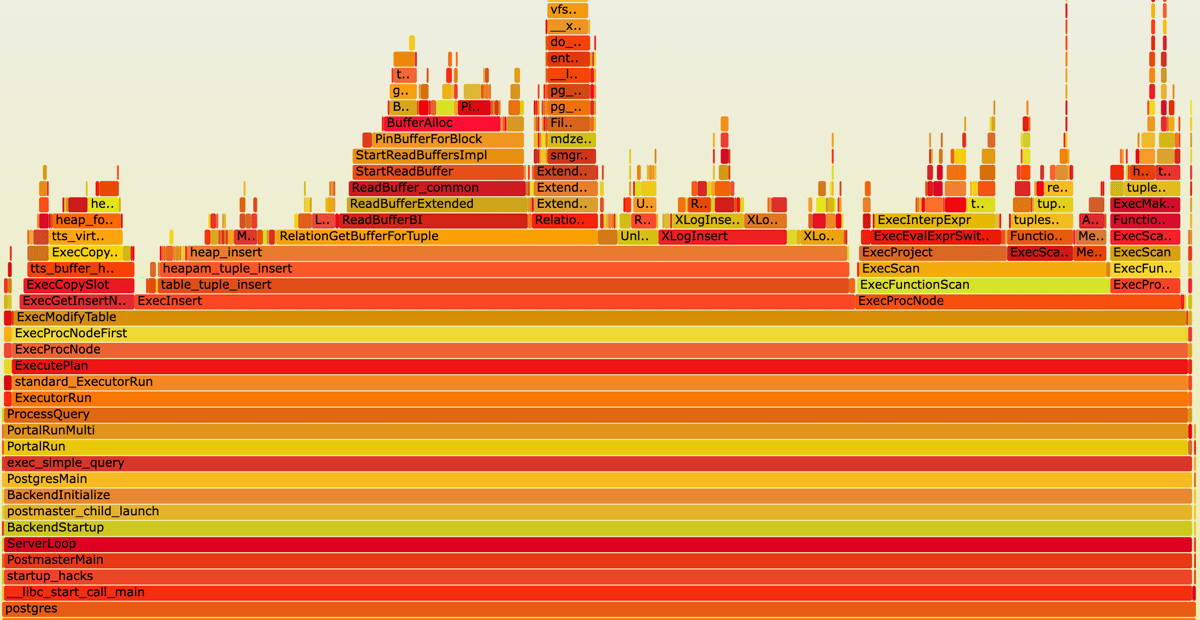
In PostgreSQL, internal counters such as nextXid (transaction IDs) and nextOid (object identifiers) are updated on virtually every transaction or DDL operation. By locating the memory address of these variables with gdb and attaching a bpftrace watchpoint, operators can emit real‑time metrics—e.g., transactions per second or OID consumption per backend—without recompiling or restarting the database. The blog post’s examples show simple one‑liner commands that print PID, process name, and the new counter value, as well as aggregate counts over configurable intervals, turning low‑level kernel events into actionable database performance data.
The broader implication is a new class of ultra‑lightweight tracing for production databases. While the number of hardware breakpoints is limited (typically four per core), careful selection of high‑value variables can yield deep insight with only a 30% performance hit, compared to the 38% hit from uprobes. As cloud providers and SaaS platforms demand ever‑more granular telemetry without sacrificing SLA guarantees, techniques that blend eBPF with CPU debug features are poised to become standard tooling for DBAs, performance engineers, and security auditors alike.
Jan Kristof Nidzwetzki: Tracing PostgreSQL Using eBPF and Hardware Breakpoints
Comments
Want to join the conversation?
Loading comments...