Market on Close - May 29, 2026
The Bar Charts "Market on Close" episode highlighted a market perched at all‑time highs, with the S&P 500 sitting near 7,500 and investors split on whether it will first reach 7,000 or 8,000. Host John Roland and co‑host Thomas gauged bullish sentiment through a poll, noting that 60% expect the higher target, while technical gauges such as RSI remain flat, suggesting momentum still favors the upside. The discussion turned to macro risks, especially dwindling oil inventories that could push diesel and jet‑fuel prices higher, potentially acting as a black‑swans that dampen equity enthusiasm. While the Fed’s Dallas president echoed concerns about supply constraints, the hosts argued that U.S. buffers may soften immediate impact, yet the broader energy squeeze remains a watch‑list item for risk‑averse investors. A deep dive into Microsoft revealed a technical rebound: the stock broke out of a weekly flag pattern, approaching its 200‑day moving average around $460 and closing near $481 after an earnings gap. Catalysts include clarified AI‑capex strategy, utility‑style billing, and a new forward‑deployment‑engineer program projected to generate up to $600 billion in revenue over the next three to five years. The TTM squeeze on the broader market signals a two‑week volatility expansion, offering a short‑term trade setup for disciplined traders. Overall, the episode underscored that while bullish momentum persists, investors must balance it against energy‑price headwinds and monitor key technical thresholds. Microsoft’s resurgence and the TTM squeeze present actionable opportunities, but proper risk management remains essential as the market navigates potential black‑swan events.
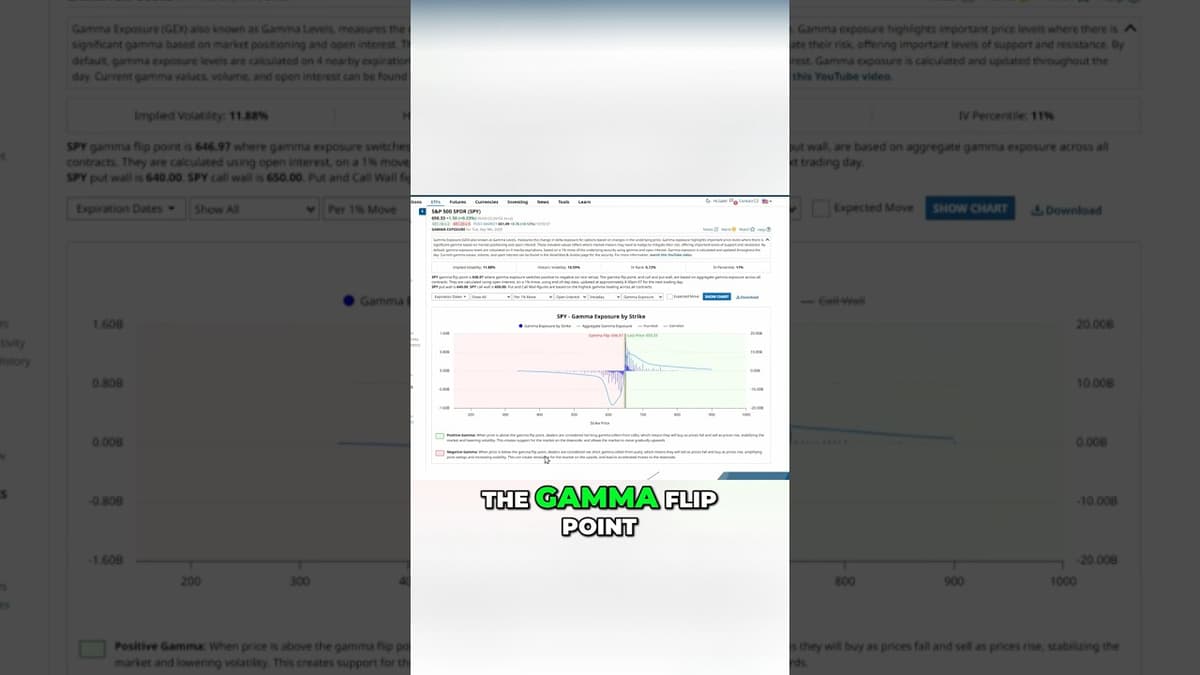
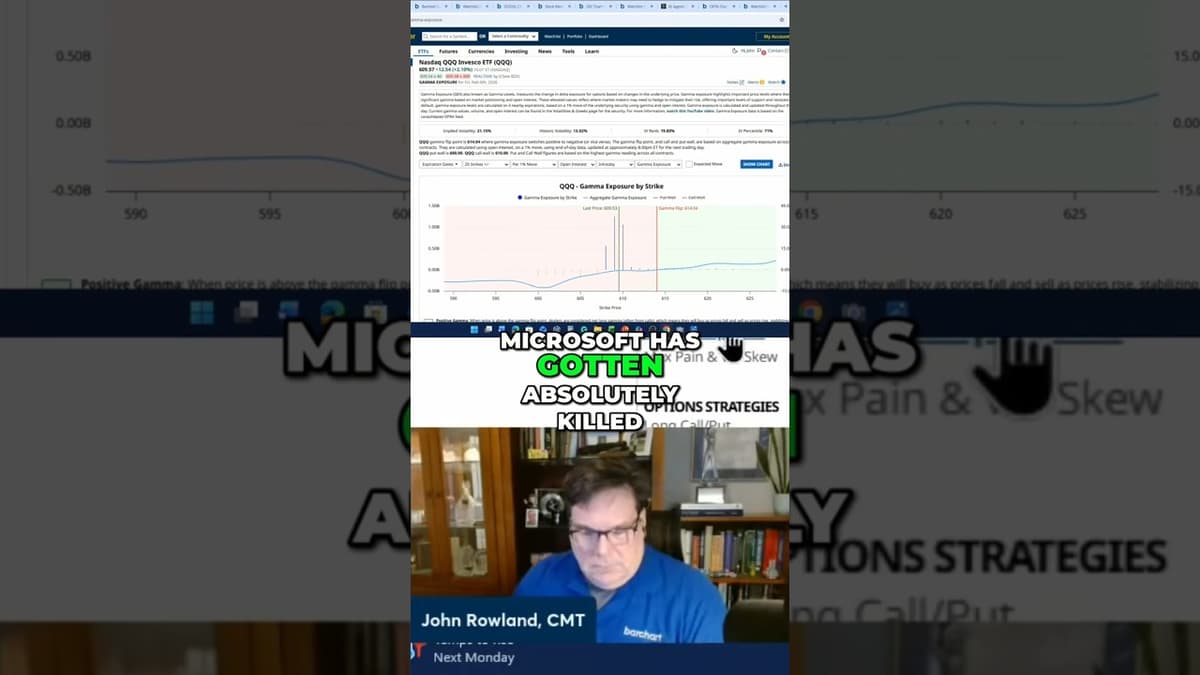
The Gamma Squeeze Cheat Sheet Every Trader Needs 📊 #optionstrading #gex #gammaexposure #gammasqueeze
The video presents a concise cheat sheet for traders on gamma exposure, explaining the concept of a gamma flip point where dealers shift from net short to net long gamma. It distinguishes negative gamma—typically arising from put positions below the...
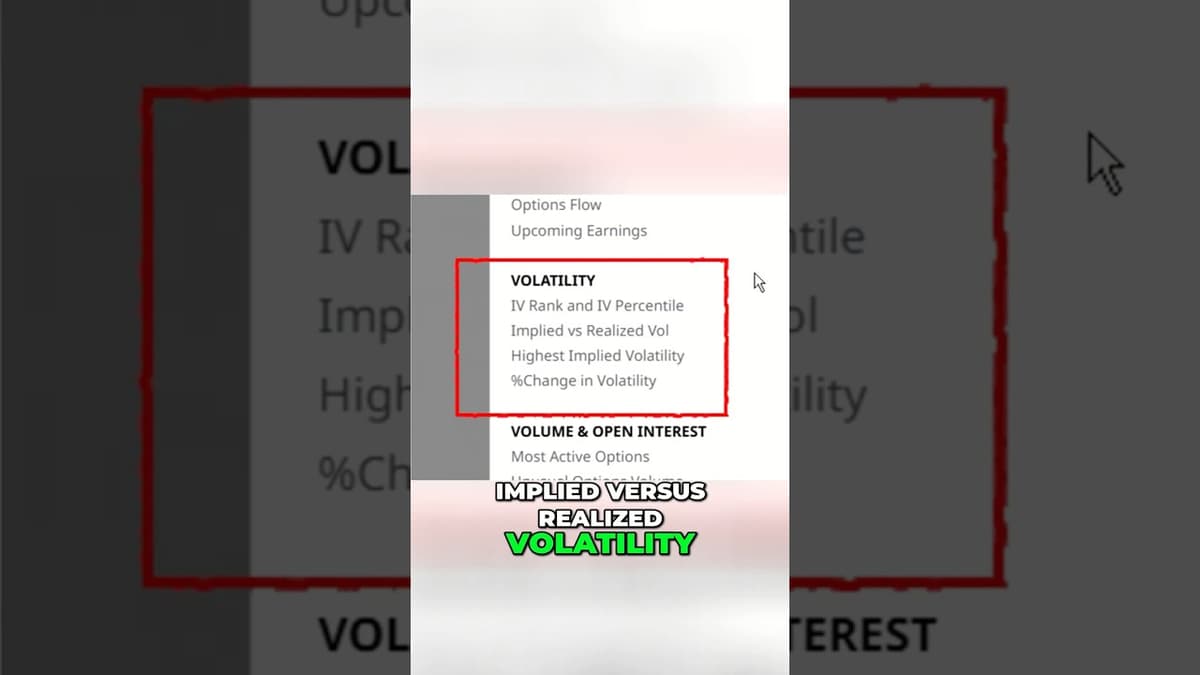
Why Most Options Buyers Get Wrecked by Volatility 🛑#optionstrategy #volatilitytrading #barchart
The video teaches traders how to match option‑type strategies with the right volatility environment, emphasizing that misreading volatility is why most option buyers lose money. For long calls or puts, the presenter recommends entering when implied volatility (IV), IV rank, and...
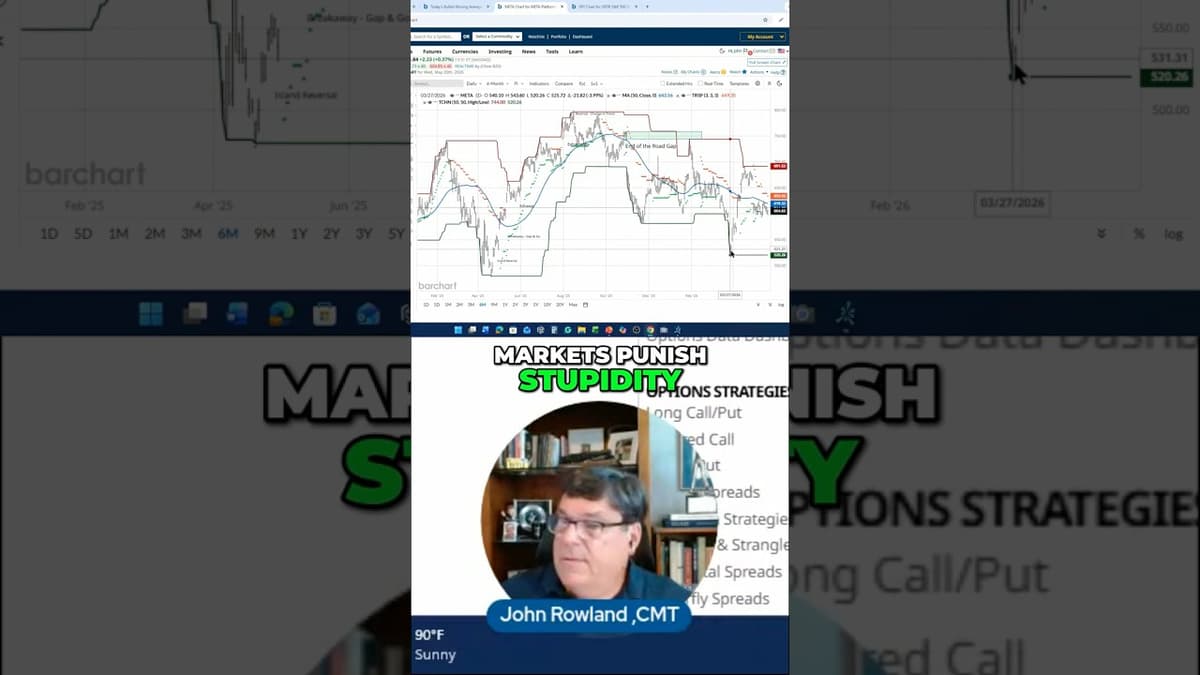
The "End of the Road Gap" That Wipes Out Accounts ⛔️📉💸 #Barchart #Screener
Traders were warned about the perils of ignoring rule‑based risk management after a dramatic “end‑of‑road” gap wiped out a sizable Meta profit. The video walks through a hypothetical Meta trade bought near $500, rising past the 50‑day moving average, and...
0DTE Options: Easy Money or a $50M Nightmare? 💸⚠️
The video warns that zero‑day‑to‑expiration (0DTE) iron condors, popularized on social media as a "easy money" play, are fraught with hidden danger. While the strategy offers an upfront credit for a trade that expires within hours, its repeatability is questionable,...
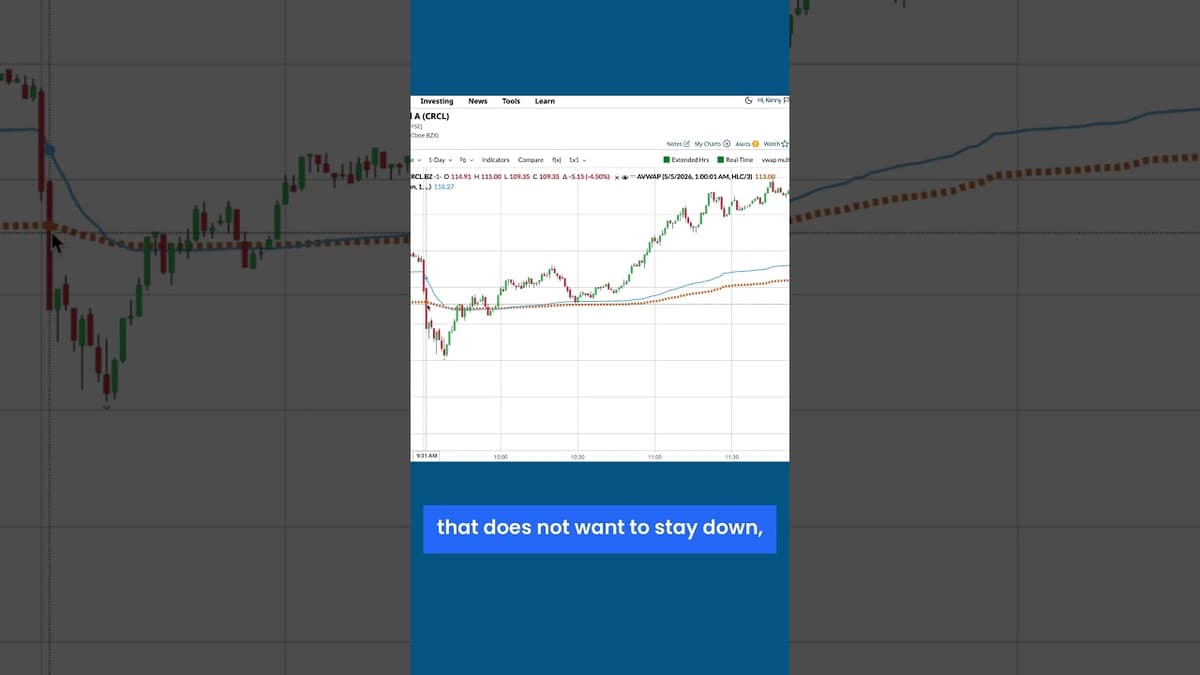
Terrorize the Shorts with This 90-Second Day Trade Setup #stocks #crcl #trading #vwap #daytrading
The video walks viewers through a 90‑second day‑trade setup that hinges on earnings‑gap stocks and the volume‑weighted average price (VWAP). Kenny Glick explains how he isolates one or two names after earnings releases, watches the stock gap up, and then...
How to Find Winning Stocks Using Barchart's Top Stock Picks
Barchart’s Top Stock Picks service is a nightly‑run, algorithm‑driven screen that surfaces stocks generating fresh technical buy or sell signals before they post large price moves. The engine scans for moving‑average crossovers, MACD flips, momentum and relative‑strength triggers, then applies strict...
The Real Reason Traders Fail (It's Not Strategy)
In this Bar Chart webinar, senior market strategist John Roland argues that the primary cause of trader failure is not the market, capital, or even the strategy itself, but the trader’s own psychological habits. He stresses that emotional discipline and...
Berkshire Hathaway: Buy the Dip or Avoid the Trap? 🪤💎 #barchart #investing #buffett #stocks
The conversation centers on Berkshire Hathaway’s recent underperformance and whether investors should buy the dip or wait. Despite a roughly 5% year‑to‑date decline, the conglomerate’s biggest positions—Apple, American Express, Coca‑Cola, Chevron and others—are delivering returns that beat the S&P 500. Panelists note...
This Secret RSI Screener Spots Reversal Trades Early
The webinar introduced Bar Charts’ newest tool – an RSI divergence screener designed to flag potential trend reversals before they fully develop. By pairing the Relative Strength Index with MACD crossovers and anchoring the analysis to six‑month swing highs or...
The "Safe" Trade That Lost Traders $50 Million
The video dissects a trading group’s catastrophic $50 million loss from selling zero‑day‑to‑expiration (zero‑DTE) iron condors, a strategy many social‑media influencers tout as “safe” and easy‑income. It explains that the group relied on a Martingale‑style scaling—doubling position size after each loss—while trading...
This Indicator Predicts How Far a Stock Can Move 📏📊 #Trading #Investing #Strategy
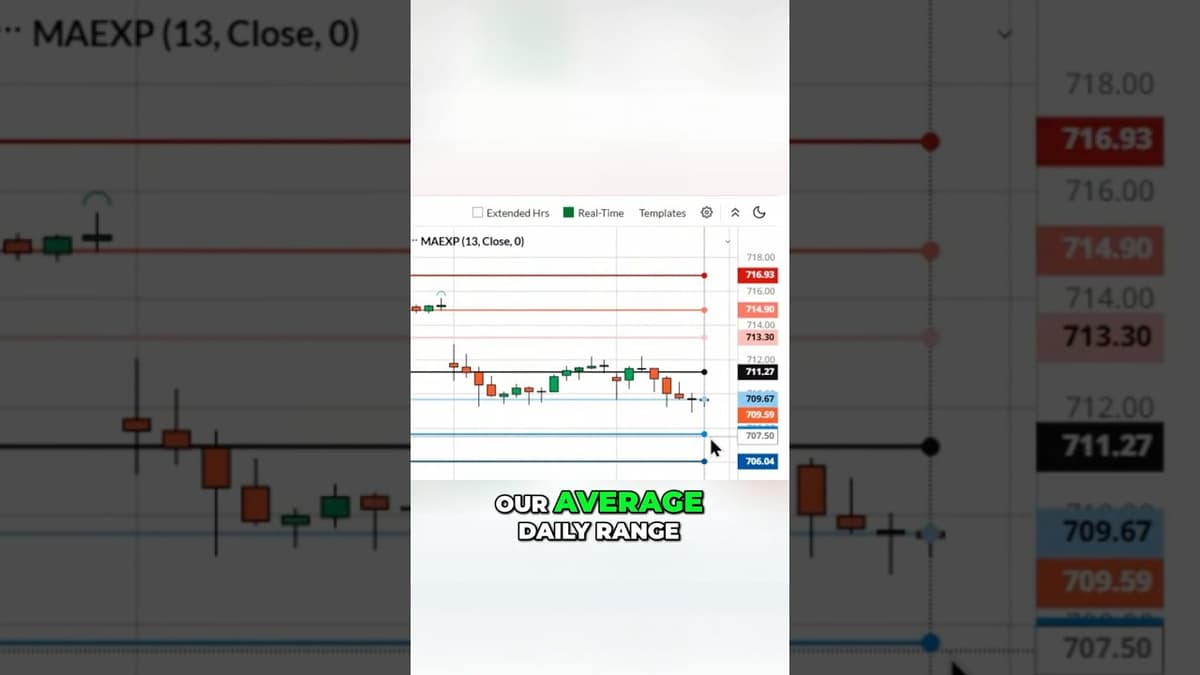
The video explains how the Average True Range (ATR) and the Average Daily Range (ADR) can serve as a probabilistic ruler for traders, helping to gauge volatility and anticipate price moves. A shrinking ATR indicates a contraction in volatility, which often...
This Option Strategy Pays You When Nvidia Tops Out
The video walks viewers through a bear call spread – a defined‑risk, income‑generating option strategy – using Nvidia (NVDA) as a live case study. After Nvidia’s three‑year rally stalled around $167, the presenter shows how to sell a call spread...
Better Than The Wheel Strategy? Auto-Callable ETFs Explained 🎡
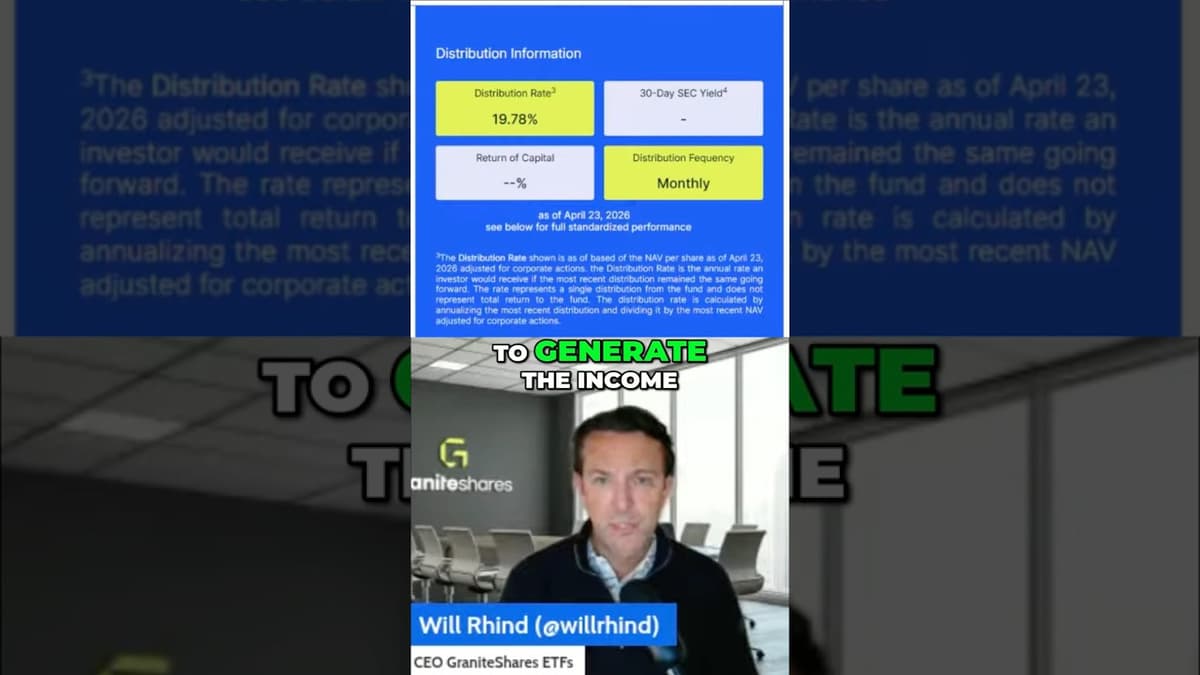
The video explains auto‑callable ETFs, a new vehicle that bundles option‑based income strategies—most notably covered‑call and cash‑secured put positions—into an exchange‑traded fund. Historically, advisors accessed similar exposure through structured notes issued by banks, but the ETF wrapper offers daily liquidity...
How to Dial In the Zig Zag Indicator Using Volatility & ATR
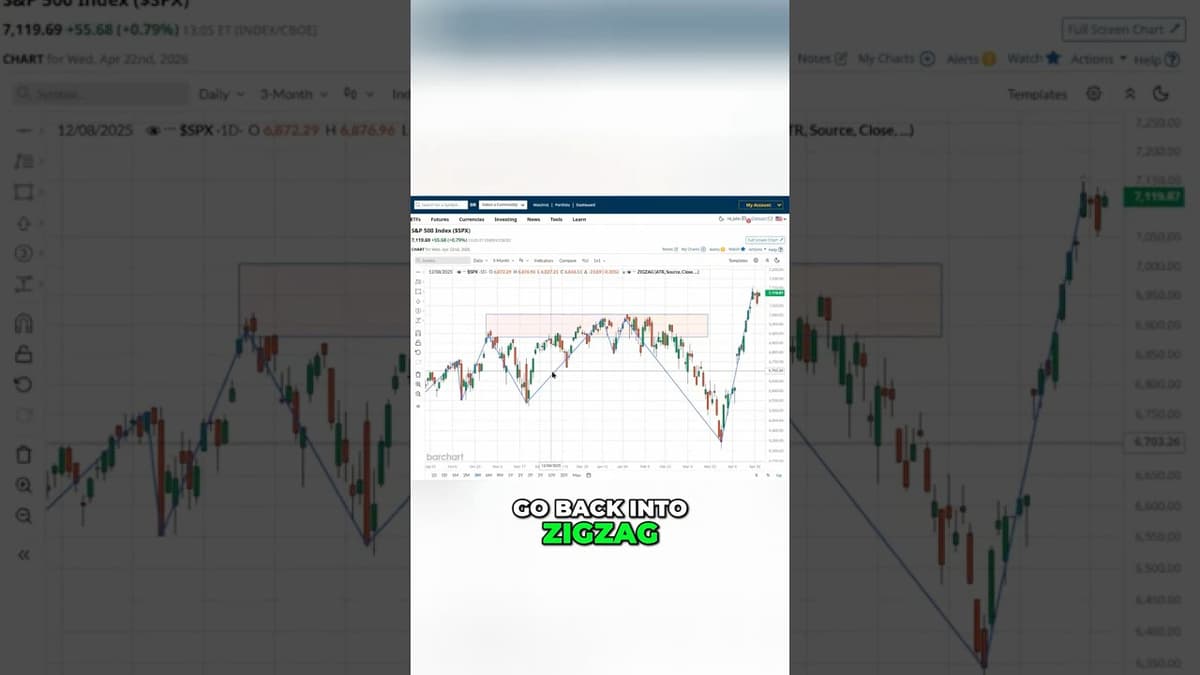
The video walks viewers through configuring the Zig Zag indicator by leveraging volatility measures, specifically the Average True Range (ATR), alongside traditional percentage‑based reversals. It explains that the default ‘percentage mode’ can be replaced or complemented with ATR‑derived thresholds, allowing traders...
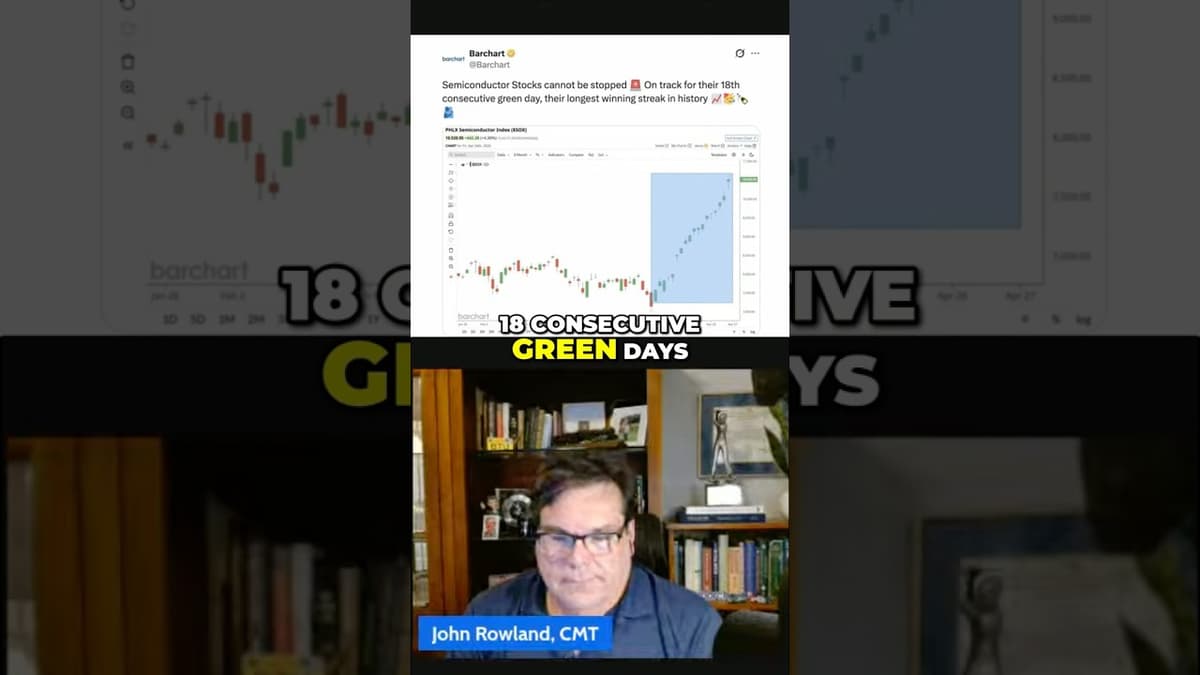
Is This the Dotcom Bubble 2.0? (Semiconductors Warning) ⚠️ #Micron #Intel #Nvidia
The video examines the recent surge in semiconductor equities, highlighting an 18‑day streak of gains that marks the longest winning run in the sector’s history. The host points to smaller players such as GlobalFoundries, which have jumped roughly 50% since...
The Wheel Strategy Explained (Step-by-Step) ☸️ #WheelStrategy #Apple #OptionsTrading
The video walks through the “Wheel” options strategy, using Apple (AAPL) as a live illustration. It shows how an investor can systematically sell cash‑secured puts, acquire shares at a target price, and then write covered calls to generate recurring premium. The...
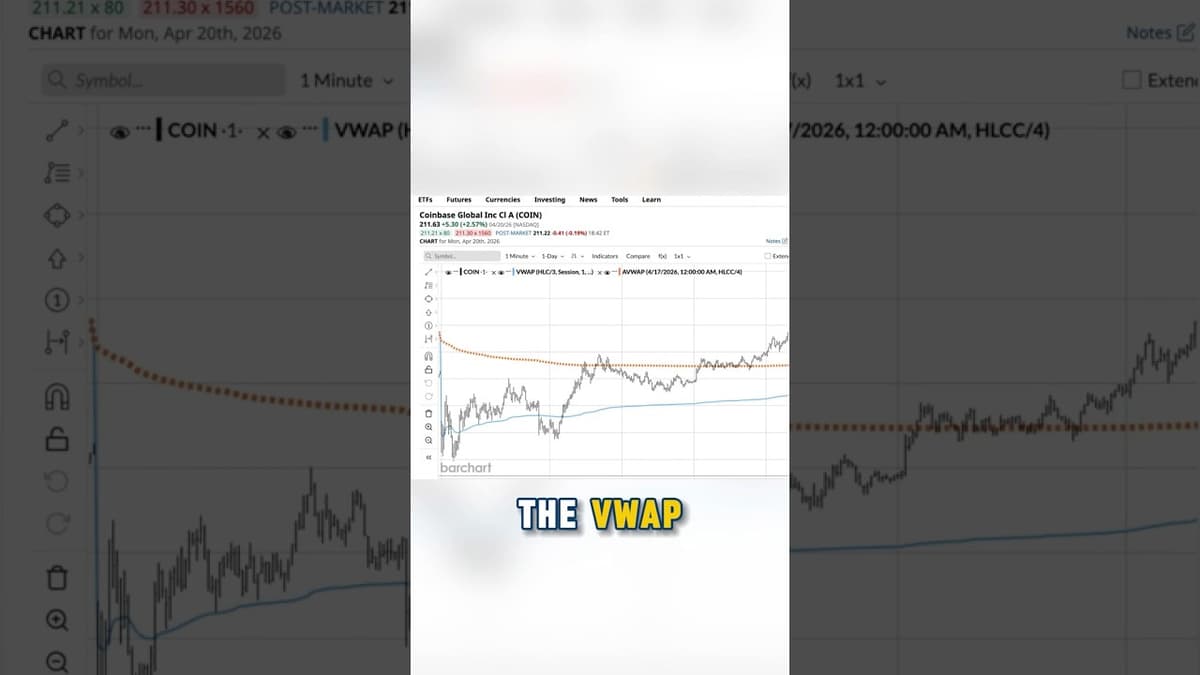
Steal This Trade Strategy Using Only VWAP #vwap #coin #barchart
The video demonstrates a VWAP‑centric trade on Coinbase, highlighting a fake‑out breakout below VWAP and subsequent rebound. The presenter explains that when price pierces a recent low after crossing VWAP, traders should buy near the VWAP level, set stops at the...
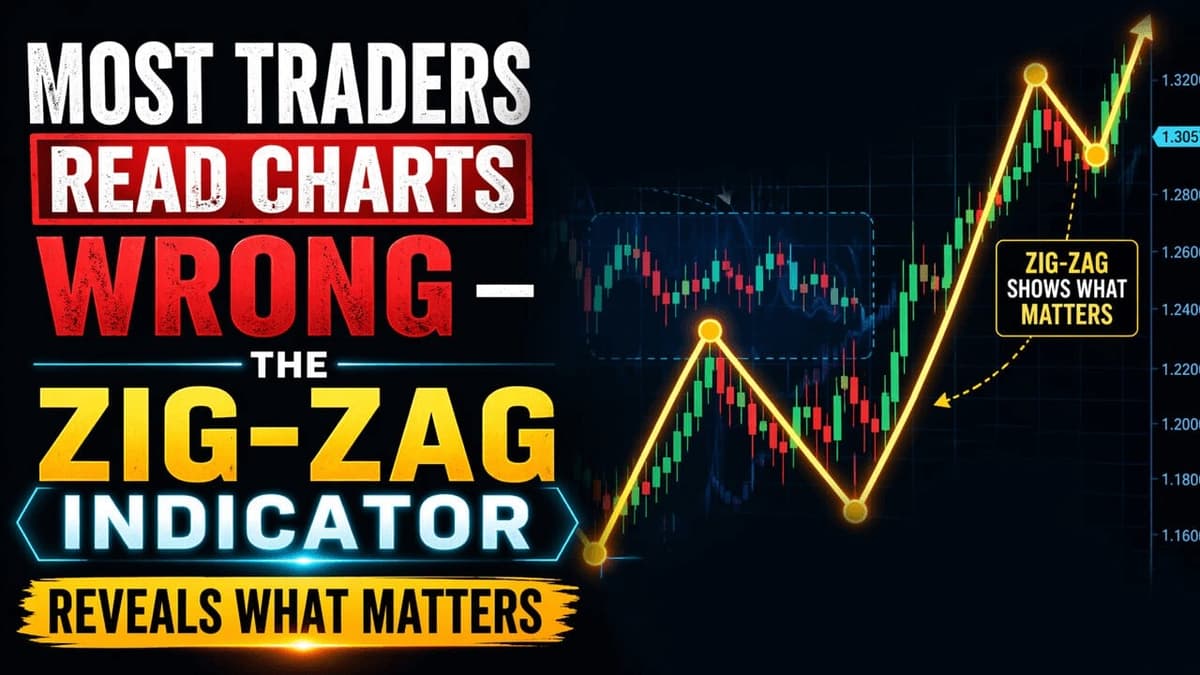
Most Traders Read Charts Wrong – The Zig Zag Indicator Reveals What Matters
The webinar introduces the Zig Zag indicator as a price‑filtering tool that removes market noise and connects only the most meaningful highs and lows. It emphasizes that Zig Zag operates in perfect hindsight, serving as a structural interpreter rather than...
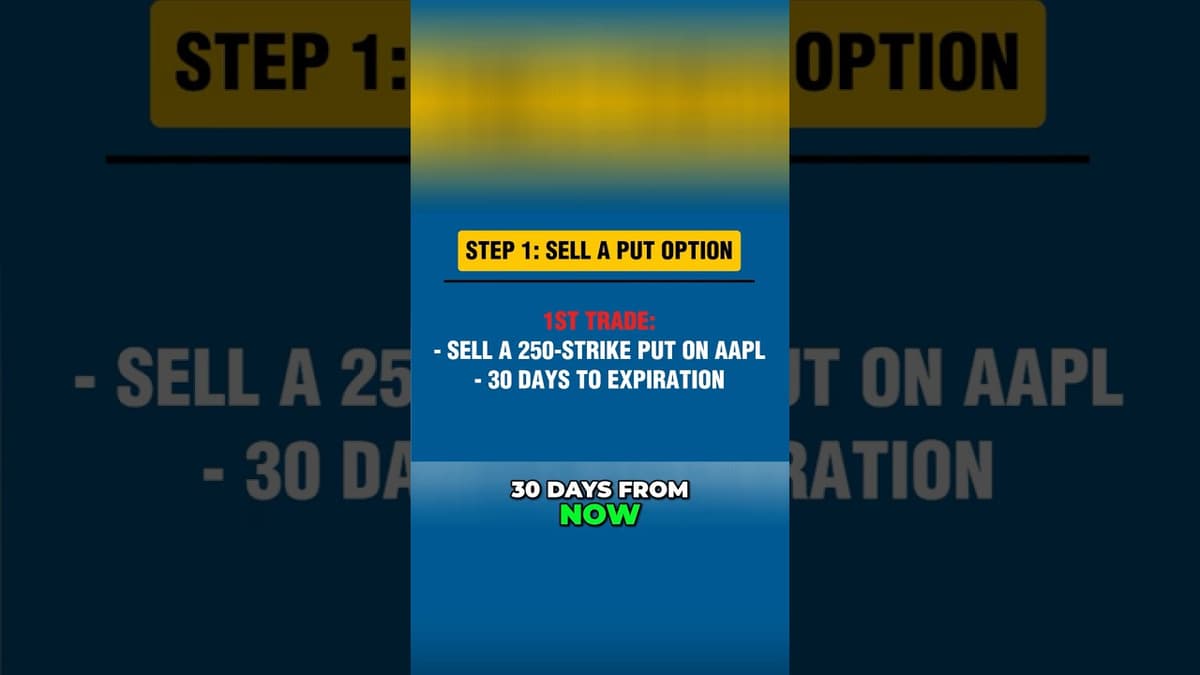
How to Get Paid Before You Buy a Stock (The Wheel Strategy)
The video introduces the “wheel” – an options‑based income loop that lets investors collect premiums before and after acquiring a stock. It breaks the process into four steps: sell a cash‑secured put at a comfortable strike, wait for the option to...

Market on Close - April 17, 2026
Barchart’s Market & Close opened with senior strategist John Roland flagging a historic rally: the Nasdaq is on track for a 13‑day winning streak and more than 300 stocks are posting new 52‑week highs. The show also highlighted the SEC’s decision to...
First Solar (FSLR): The AI Power Trade Nobody’s Watching ☀️ #FSLR #SolarEnergy #TTMSqueeze
First Solar (FSLR) is being highlighted as a hidden AI‑power play, as recent U.S. Energy Information Administration data shows solar accounted for roughly 65‑70% of all new generation capacity. The commentator argues that expanding AI workloads will strain the grid,...

SpaceX IPO Explained: Why Smart Money Is Staying Away
The video dissects SpaceX’s upcoming initial public offering, highlighting a $1.5 trillion valuation that translates into a mere 5 percent public float. The hosts note that while the company promises retail participation, the limited share pool and a planned Nasdaq rule change...

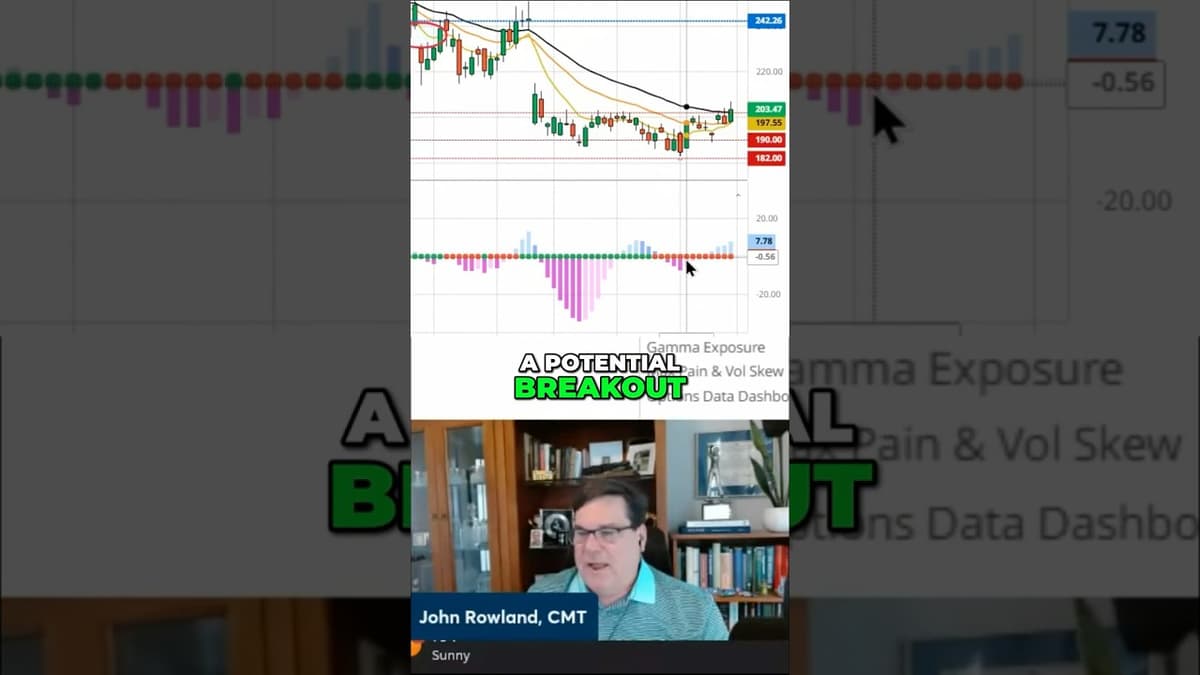
SPX Gap: Massive Breakout or $7,000 Bull Trap? 🚨 #Barchart #SPX #Trading
The video examines the recent S&P 500 gap that vaulted the index above its 200‑day, 100‑day and 50‑day moving averages, prompting debate over whether the move represents a genuine breakout or a deceptive bull trap. The presenter emphasizes that the...

Turn Losing Stocks Into Income ( The Wheel Strategy Explained )
The video breaks down the "wheel" options strategy, a repeatable income‑generation loop that starts by selling cash‑secured put contracts on stocks you’d eventually like to own. Premiums collected while waiting for a price drop provide cash flow before any shares...

How to Find High Probability Swing Trade Setups Step by Step
The webinar, hosted by Barchart senior market strategist John Roland, walks viewers through a step‑by‑step method for locating high‑probability swing‑trade setups. It positions swing trading between long‑term investing and day‑trading, emphasizing the blend of sector‑level macro analysis with day‑trader‑style risk...
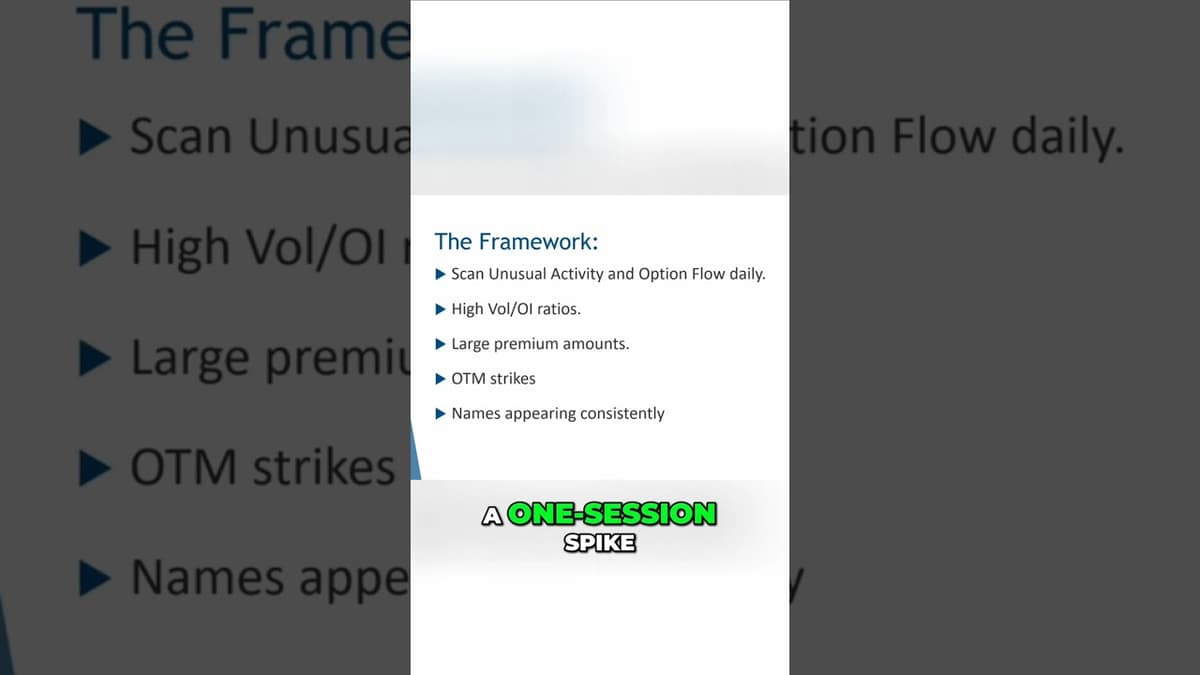
How You Can Use Unusual Options Activity to Stalk Big-Money Trades
The video explains how traders can leverage unusual options activity to infer where large institutions are positioning ahead of major market moves. It emphasizes that smart money often uses the options market first because it offers leverage and capital efficiency...

Protect Your Profits Before the Next Crash (Get Paid to Hedge Your Stocks)
The video walks viewers through the protective‑collar option strategy, a low‑cost hedge that lets investors lock in stock gains without selling the underlying shares. It explains when the trade makes sense—typically after a position has appreciated, during periods of expected...

Link Your Brokerage to Barchart | Turn Your Portfolio Into a Trading & Screening Tool
The video walks users through linking a brokerage account to Barchart’s Investor Portfolio, turning a simple holdings list into an interactive trading and screening hub. After selecting the Investor Portfolio under the Tools tab, users can choose to link a brokerage,...

Stop Trading Options Blind! Use This Data-Driven Workflow Instead. #options #barchart #trading
The video introduces a data‑driven workflow for options traders, centered on Barchart’s Most Active Options page. It positions the screen as a "blueprint" that reveals where institutional capital is concentrating bets, breaking down volume, and separating puts from calls. Viewers are...

Gold’s 200-Day Bounce: Reversal Signal or Market Trap? #barchart #gold #investing #markets #gld
The video examines gold’s recent bounce off its 200‑day moving average, asking whether the move signals a genuine reversal or a market trap. The presenter notes that the last time gold rebounded from this technical level in late 2023, it...

If Bond Prices Lead Stock Prices, What Does the HYG Death Cross Tell Us? #bonds #stocks #barchart
The video examines the recent death‑cross formation in high‑yield corporate bonds (HY) and its broader market implications. Host John explains that a death cross reflects falling bond prices and rising yields, signaling that bond investors—often dubbed “bond vigilantes”—are demanding higher...

Why Top Traders Follow Capital Flows, NOT Headlines #barchart #stocks #investing #trading
The video argues that elite traders prioritize capital‑flow metrics over daily headlines, leveraging Barchart’s sector‑performance tools to gauge where money is moving across the S&P’s eleven industries. By examining three‑month sector returns, the presenter notes the energy sector’s 34% gain—well before...

Are You Using Bollinger Bands Wrong? Catch Stocks Before They Break Out #stocks #barchart #trading
The video walks traders through a new Bollinger‑Band‑based screening tool on the Barchart platform, showing how to rank stocks by their price position relative to the bands and isolate potential breakout candidates. By selecting the ‘rank’ filter and targeting securities that...

Secret Screener That Finds the Best Buy the Dip Stocks
The webinar introduces Bar Charts’ “Top Stocks to Own” screener, a tool designed to isolate high‑probability buy‑the‑dip opportunities from thousands of market equities. Hosted by senior market strategist John Rolan, the session explains that the screener applies thirteen technical indicators...

Stock Market Warning: Is the Midterm Correction Cycle Back? #stocks #barchart #investing
The video examines whether the market is re‑entering the historic midterm correction cycle, noting that S&P 500 indices have historically fallen about 18% during midterm election years. The hosts reference past performance, technical chart levels, and the recent rally that pushed...

Gold Is NOT a Hedge: How War Transformed the 'Safe Haven' To a Risk Asset #barchart #investing #gld
The video challenges the long‑standing view of gold as a safe‑haven hedge, arguing that it now behaves like a risk‑on asset closely tied to equity markets. Using a monthly chart that overlays gold prices with the S&P 500, the host highlights...

Survival Tips for Retail Options Sellers to Manage Risk #barchart #stocks #options #optionstrading
The video tackles a common myth among retail traders: selling options is "safer" because it wins more often. It contrasts the fixed‑risk nature of buying calls or puts with the asymmetric, potentially unlimited downside of writing naked or even cash‑secured...

Stop Fighting Time Decay (Do This Instead) #options #trading #investing #barchart #stockmarket
The video contrasts two fundamental option‑trading approaches: speculative long options versus risk‑defined credit spreads. The host explains that while a long call or put offers unlimited upside, it also suffers from time decay and demands a sizable price move before...

How the Microsoft Stock Correction Created a $4K Options Opportunity #msft #barchart #options
The video walks viewers through a recent Microsoft stock correction that turned a modest options trade into a roughly $4,000 profit. It focuses on two bearish strategies—a long $460 put purchased for $8.95 per share and a “bare” call spread...

Stop Guessing Entries: The Multi Time Frame Strategy Pros Use
John Rowland, Barchart’s senior market strategist, hosted a 50‑minute webinar teaching a structured multi‑time‑frame analysis method. He demonstrates how to start with higher‑time‑frame charts to set the overall price range, then move to intermediate frames to pinpoint the prevailing trend,...
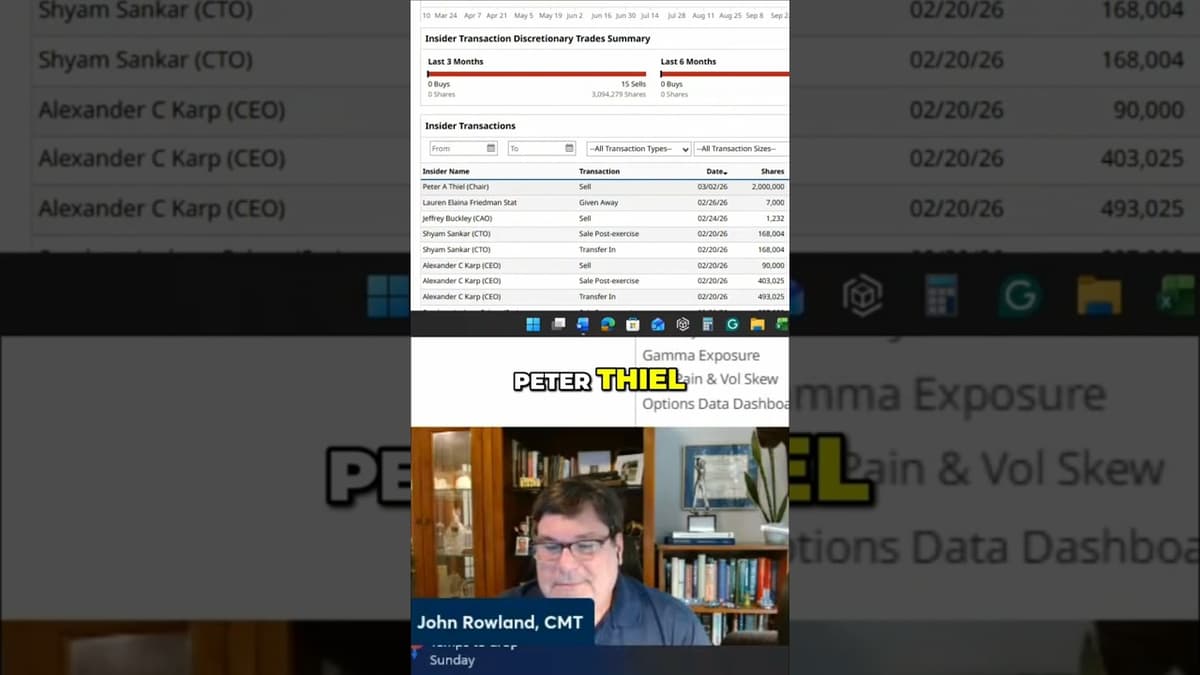
Palantir Stock Alert: Peter Thiel Dumps $289M! What Now? #barchart #stocks #trading #pltr
The video centers on Peter Thiel’s recent sale of roughly $289 million worth of Palantir (PLTR) stock, prompting a fresh “stock alert” for investors and traders. The hosts note that insider selling typically carries more weight than buying, especially when the stock...
Why Most Traders Get New High Stock Breakouts Wrong
The webinar focuses on why most traders misinterpret new‑high breakouts and outlines a systematic, rule‑based approach to validate genuine momentum. John Roland, Bar Chart’s senior market strategist, emphasizes that a true uptrend demands higher highs and higher lows, and that...

When Fear Hits the Stock Market, Where Can Investors Find Safety? #stocks #trading #barchart
The video discusses investor behavior when fear grips the market, noting that while some flee to cash, others seek sector-specific opportunities. The speaker highlights recent sector performance—energy up ~23%, materials ~24%, consumer staples ~12%—and focuses on healthcare, which is only...
How Traders Actually Use Barchart's Technical Opinion (Strength vs Direction)
The webinar introduces Barchart’s Technical Opinion tool, a consolidated dashboard that blends thirteen distinct technical indicators into a single buy‑or‑sell rating for stocks, ETFs, futures, and forex. John Roland likens the interface to a race‑car instrument panel, providing traders an...

Investors in Search of Alpha Are Fleeing Tech Stocks for These 3 High-Yield Sectors Instead
The video warns that investors chasing alpha are abandoning technology and AI‑heavy names in favor of three high‑yield sectors—basic materials, energy and consumer staples—signaling a pronounced sector rotation. Data presented shows every stock in the energy group and a majority in...
No, AI Isn’t Killing Software: OKTA & More Top Stocks to Pull From the Ashes of ‘SaaS-Pocalypse’
The video examines the dramatic underperformance of software equities relative to the broader Nasdaq, noting that the sector has posted its worst relative returns since 2000. The host argues that the recent sell‑off is less about AI annihilating software and...
Microsoft Stock Is Bouncing Back From Its Post-Earnings Price Crash, But Watch This Before You Buy
The video analyzes Microsoft’s post‑earnings plunge, questioning whether the sharp price drop creates a buying window. The host notes the stock is deeply oversold, trading below its 200‑day moving average and short‑term averages that are still descending. A wide Bollinger Band...

Build a Better Trade Plan by Using This Metric to Set High-Probability Profit Targets for Stocks
The video explains how traders can use the Average True Range (ATR) as a quantitative gauge for setting realistic profit targets on stocks, especially for swing and short‑term strategies. ATR measures daily volatility without indicating direction. By looking at the 9‑day...