
Machine Learning Is Changing iGaming Software Development
Machine learning and generative AI are rapidly reshaping iGaming software development, with more than half of game studios now integrating AI tools into their pipelines. Developers leverage ML to detect fraud, personalize game recommendations, and fine‑tune mechanics, while generative AI assists in prototyping, testing, and asset creation. The global video‑game market’s steady >6% annual growth fuels demand for AI‑driven scalability and compliance solutions. Leading iGaming vendors such as Avenga, Intellias, Playtech, SOFTSWISS and Sigma Software are packaging these capabilities into modular, cloud‑native platforms.

Signals In The Noise: Using Media Monitoring To Manage Negative Publicity
Media monitoring has become essential for companies facing rapid negative publicity across news, blogs, social media, and reviews. Modern platforms collect real‑time keyword mentions, sentiment scores, and engagement metrics to identify emerging reputation risks. By pinpointing the source and influence...

Connecting the Factory Floor: Efficient Integration for Smarter Manufacturing
Smart factories rely on seamless industrial connectivity that links production equipment, PLCs, and sensor networks to centralized monitoring platforms. By transmitting high‑speed data via fiber‑optic infrastructure, manufacturers gain real‑time visibility into machine performance, output, and maintenance needs. Consolidating this data...

Unique Capabilities of Edge Computing in IoT
The article outlines how edge computing transforms IoT by enabling federated learning, real‑time analytics, and stronger data sovereignty. By processing data locally, edge nodes cut latency, lower bandwidth demands, and keep sensitive information compliant with regulations such as GDPR and...

The Rise of Location Intelligence: Turning Geographic Data Into Competitive Advantage
Location intelligence is moving from a background reporting tool to a strategic asset as businesses combine geographic data with operational metrics. By layering spatial context onto demand, infrastructure and behavior datasets, firms uncover patterns that traditional analytics miss. AI and...

How Big Data Is Changes How We Buy and Sell Real Estate
Big data is reshaping real estate by giving developers, agents, and investors real‑time demographic, economic, and environmental insights. Over 80 % of agents now use AI‑driven tools, and predictive analytics enable precise scenario modeling for pricing, density, and amenities. The technology...

Human Verification Tools Help Make Smarter Data-Driven Decisions
Human verification tools are emerging as essential safeguards for data‑driven enterprises, confirming that online interactions stem from real individuals rather than bots or synthetic identities. Modern solutions combine biometrics, AI, and privacy‑focused designs to validate personhood at scale, reducing fraudulent...

Recurring Revenue Strategies for the AI Business Era
The article examines how AI’s high variable costs are reshaping recurring‑revenue models, moving firms away from flat‑rate SaaS subscriptions toward hybrid, usage‑based, and outcome‑based pricing. It cites McKinsey data showing 50% of firms plan AI adoption and highlights that 72%...

How Data Analytics Can Help You Construct A Financial Weather Map
The article introduces the concept of a financial weather map, using data analytics to turn static financial reports into dynamic, forward‑looking risk and opportunity visualizations. By blending historical records with real‑time inputs, organizations can spot early warning signals such as...

AI Shows How Payment Delays Disrupt Your Business
Artificial intelligence is now being used to map the ripple effects of late payments across enterprises. By correlating invoice delays with cash‑flow strain, borrowing costs, and operational bottlenecks, AI turns raw payment data into actionable insight. Predictive models flag high‑risk...

Financial Analytics Shows The Hidden Cost Of Not Switching Systems
Financial analytics is exposing the hidden expense of keeping legacy systems, revealing that seemingly functional tools mask productivity losses, delayed decision‑making, and compliance risks. The analysis shows minutes wasted on manual workarounds compound into millions of labor hours, while slower...

How Teams Using Multi-Model AI Reduced Risk Without Slowing Innovation
Enterprises are racing to adopt AI, yet 77% fear hallucinations and 70‑85% of projects fall short. Multi‑model AI, also called ensemble or consensus AI, tackles this by running several independent models and using majority agreement to validate outputs. Early adopters...
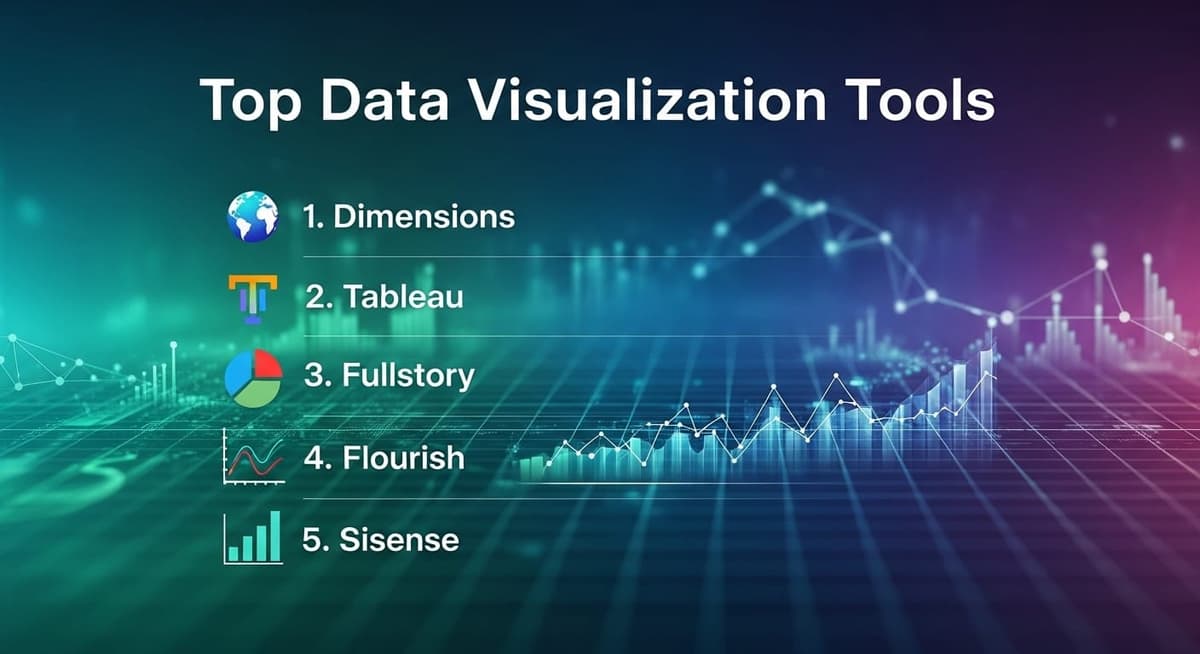
5 Top Data Visualization Tools for Research Projects
The article reviews five leading data‑visualization platforms—Dimensions, Tableau, Fullstory, Flourish and Sisense—highlighting each tool’s core capabilities for research projects. Dimensions pairs with VOSviewer for bibliometric network mapping, while Tableau excels at drag‑and‑drop dashboards across multiple data sources. Fullstory offers session‑replay...

Evaluating the Best Value Cybersecurity Platforms for Enterprises
The article evaluates enterprise‑grade cybersecurity platforms, outlining key criteria such as AI/ML capabilities, coverage breadth, autonomous response, total cost of ownership, and scalability. It reviews five leading solutions—Darktrace, CrowdStrike, SentinelOne, Palo Alto Networks, and Microsoft Defender—detailing each vendor’s strengths and...

How Machine Learning Improves Satellite Object Tracking
Machine learning is now central to satellite‑object tracking, where algorithms scan thousands of orbital coordinates to flag collision risks far earlier than traditional radar. With over 12,000 active satellites, manual monitoring is infeasible, prompting platforms like Orb to blend telescope,...
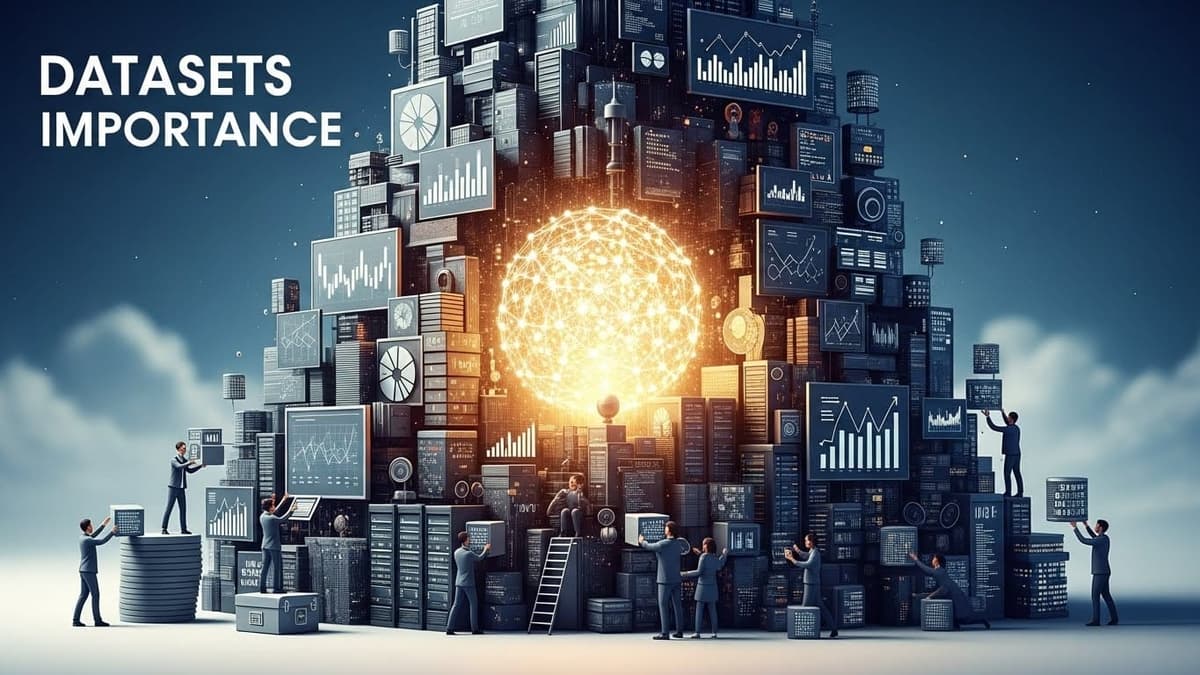
The 5 Best Platforms Offering the Most Diverse Research Datasets in 2026
The article reviews the five most diverse research‑dataset platforms for 2026—Dimensions, Scopus, Web of Science, Lens, and OpenAlex—highlighting each service’s unique data breadth and analytical tools. Dimensions links publications, grants, and patents with AI‑driven search; Scopus offers a curated 100 million‑record...