Key Takeaways
- •Northeast winter colder than long‑term warming trend.
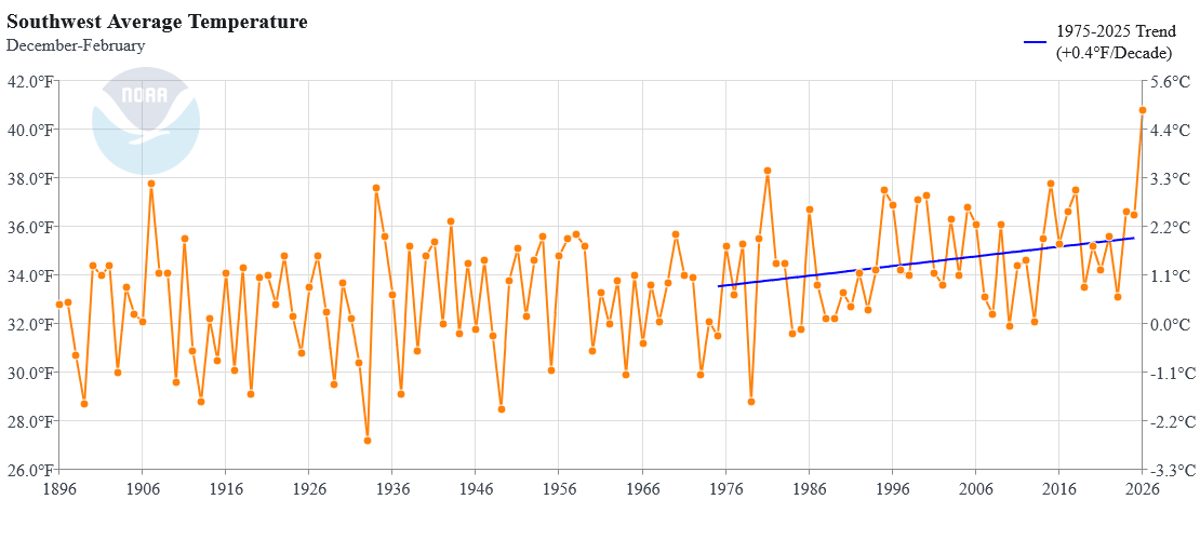
- •Southwest winter set new record, 2.5 °F above previous.
- •More states experienced above‑average temperatures than below.
- •Northeast trend rising 0.9 °F per decade since 1975.
- •Regional divergence highlights uneven climate change impacts.
Summary
The latest U.S. winter showed a stark east‑west temperature split, with the Northeast experiencing colder‑than‑average conditions while the Southwest recorded its hottest winter on record, surpassing the previous high by 2.5 °F. A map of state‑by‑state anomalies highlighted more hot‑than‑cold deviations nationwide. Long‑term data reveal a 0.9 °F per decade warming trend in the Northeast since 1975, yet this season fell below that trajectory. Conversely, the Southwest’s modest upward trend amplified the record‑breaking heat.
Pulse Analysis
Winter temperature anomalies across the United States are becoming a focal point for climate analysts. This season’s map, based on the Climate at a Glance dataset, shows the western and southeastern states well above historical averages, while the northeastern corridor dipped below. The contrast is not merely a statistical curiosity; it reflects how regional atmospheric patterns interact with long‑term warming trends, shaping daily life from heating bills to outdoor recreation.
In the Northeast, a 0.9 °F per decade warming trend since the mid‑1970s has outpaced the global average, yet the 2025‑26 winter fell short of that trajectory. This deviation illustrates the inherent variability of climate systems, where short‑term cold snaps can mask an underlying upward temperature curve. For policymakers and utility companies, such fluctuations demand flexible planning—balancing the risk of colder spells against the broader push toward decarbonization.
The Southwest tells a different story. A modest historical trend was eclipsed this winter, breaking the previous record by a full 2.5 °F. This surge in heat intensifies stress on water supplies, agricultural yields, and power grids already strained by rising demand for cooling. The episode serves as a warning that even modest regional trends can produce extreme outcomes, reinforcing the need for targeted resilience measures and adaptive infrastructure investments.
Comments
Want to join the conversation?