U.S. Treasury Rates Weekly Update for February 27, 2026
•March 3, 2026
0
Key Takeaways
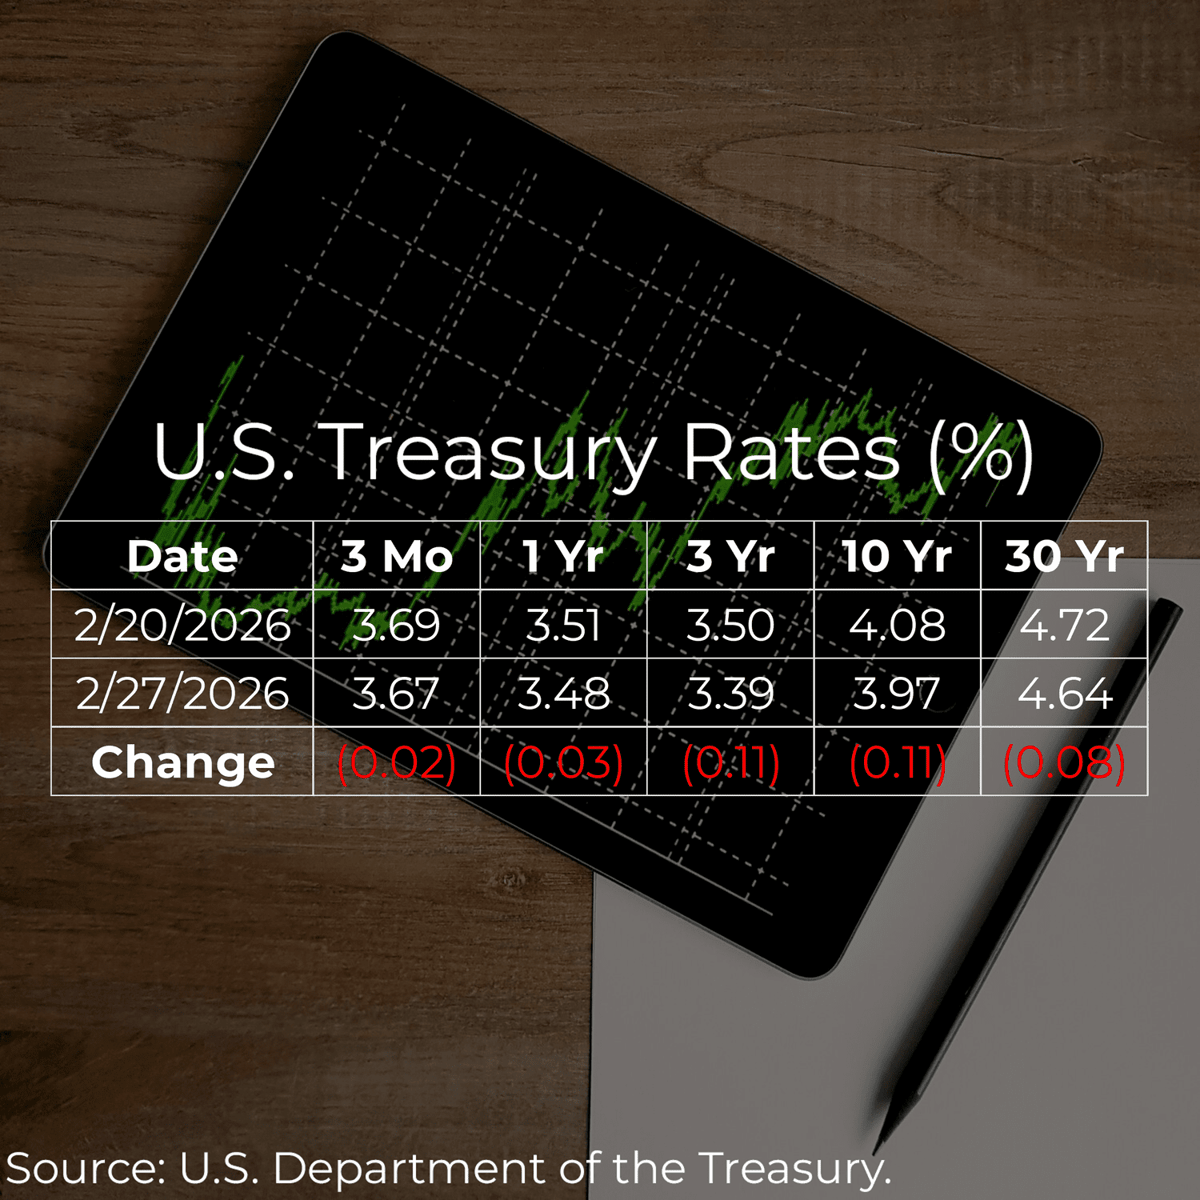
- •30‑year Treasury yield down 0.08 percentage points
- •10‑year yield fell 0.11 points to 3.97%
- •3‑year Treasury rate stands at 3.39%
- •Rate declines suggest easing inflation expectations
- •Lower yields could boost mortgage and corporate borrowing
Summary
U.S. Treasury yields slipped across the curve for the week ending February 27, 2026. The 30‑year note fell 0.08 percentage points, while the benchmark 10‑year yield dropped 0.11 points to 3.97%. The 3‑year Treasury rate held at 3.39%, indicating modest movement in short‑term rates. Overall, the market saw a modest easing in borrowing costs for both government and private sector debt.
Pulse Analysis
The latest Treasury rates snapshot shows a gentle retreat in long‑term yields, a pattern that has emerged as inflation data gradually cools and the Federal Reserve signals a more cautious stance on rate hikes. Investors are watching the 10‑year benchmark closely because it serves as a barometer for mortgage rates and corporate bond pricing. A 0.11‑point dip to 3.97% nudges the yield curve toward a flatter shape, which can compress spreads for high‑yield issuers and recalibrate risk premiums across the fixed‑income market.
For bond traders, the modest decline in the 30‑year note, now down 0.08 points, reinforces the appeal of longer‑duration assets amid a backdrop of subdued economic growth. The flattening curve may prompt portfolio managers to tilt toward shorter‑duration holdings to preserve capital while still capturing modest yield. Meanwhile, the steady 3‑year rate at 3.39% suggests that short‑term monetary policy expectations remain anchored, providing a stable reference point for Treasury‑linked instruments such as floating‑rate notes and short‑term corporate debt.
Looking ahead, market participants will gauge whether this easing trend persists or reverses as the Fed reviews upcoming employment and price data. Persistent rate declines could lower mortgage rates further, stimulating housing demand, while also pressuring banks’ net‑interest margins. Conversely, any resurgence in inflation could prompt a rapid policy pivot, pushing yields back up. Investors should therefore monitor Treasury movements as an early indicator of macro‑economic shifts and adjust credit exposure accordingly.
Comments
Want to join the conversation?