
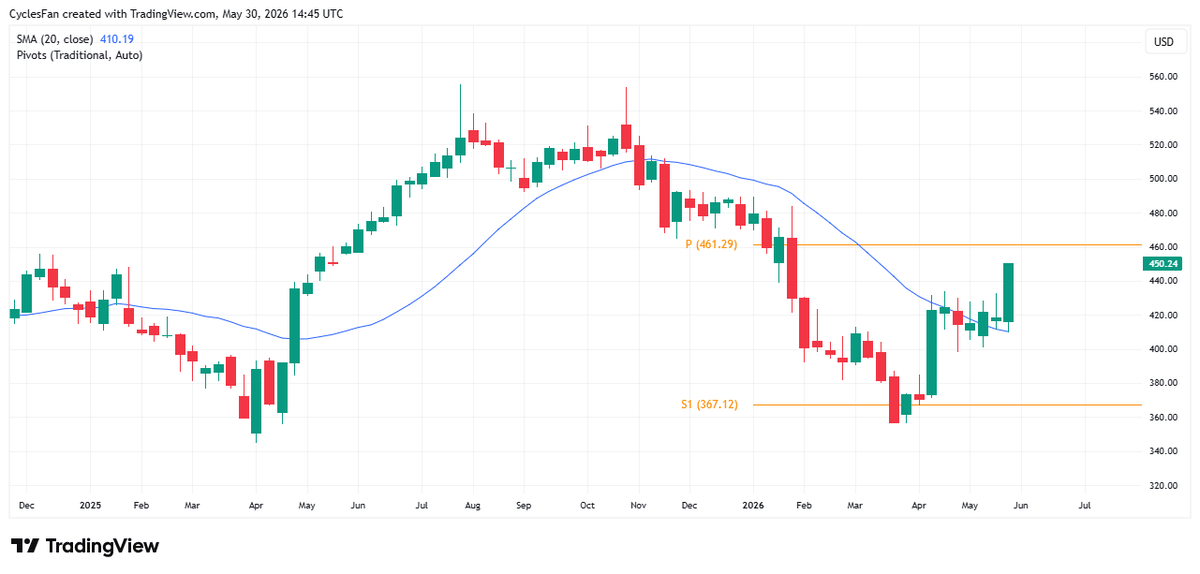
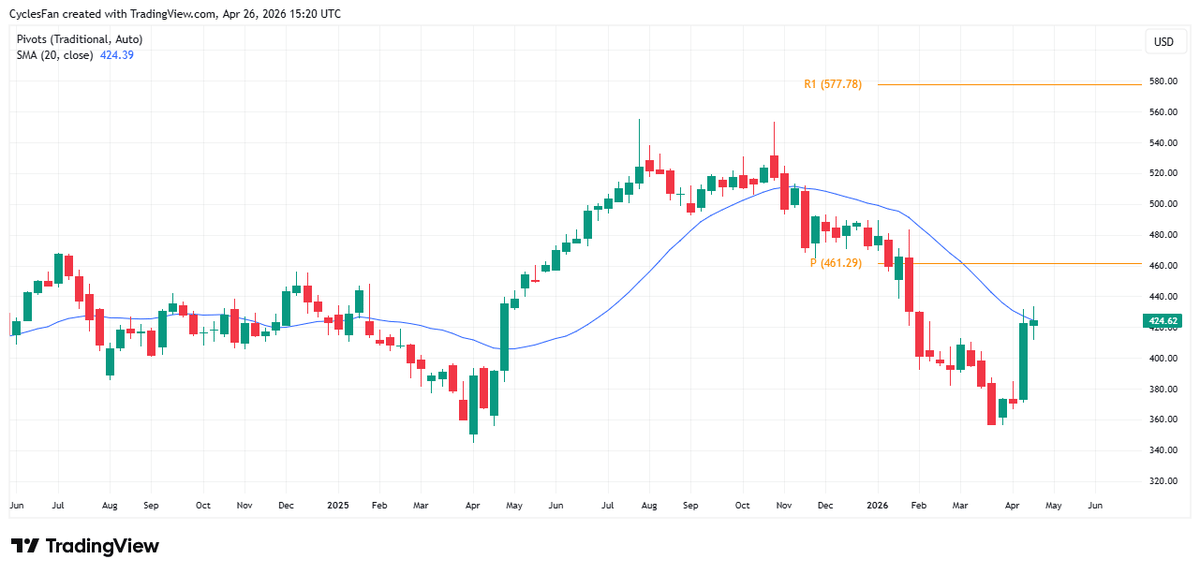
MSFT Needs 461 Close to Avoid Low Retest, Target 555
$MSFT - As anticipated in my last post, the rally off the March low gained traction this week and the stock is headed to the yearly pivot at 461. It needs a weekly close above 461 in order to rule out a retest of the March low in Q4, and head back to the All time high at 555. https://t.co/Osb43x7XMN
Oil Needs Weekly Close Below 20‑Week MA to Hit $65
$USOIL - The target of the triangle breakdown is $65 but the price of crude oil is still above the 20 week MA. We have to see a weekly close below the 20 week MA in order to confirm that...
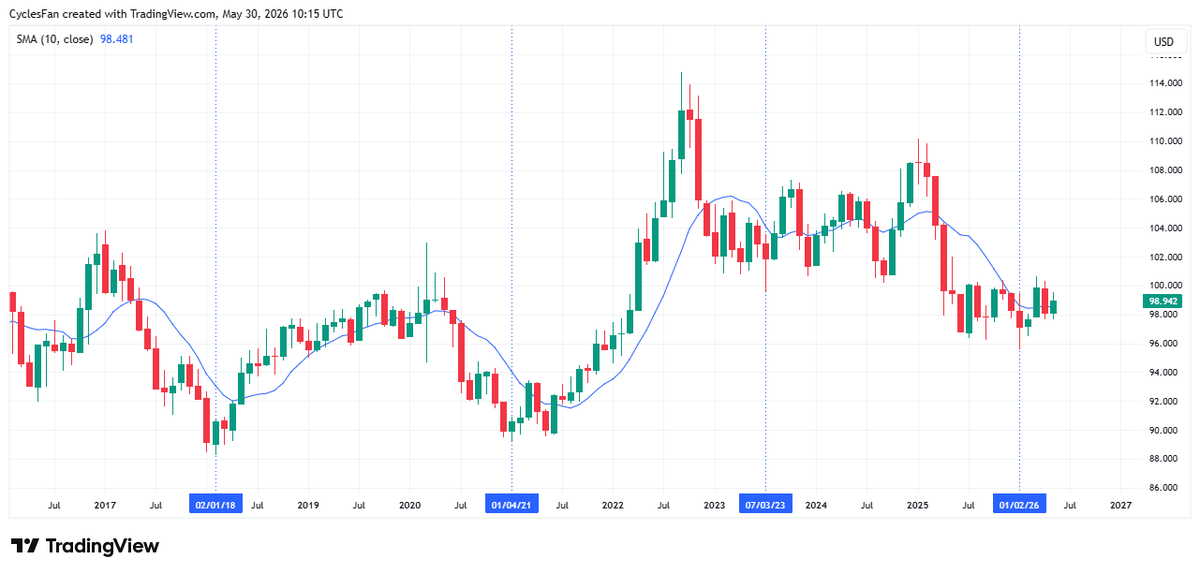
DXY Hits 3‑year Low; July Rally Expected
$DXY monthly - Closed the month a bit higher. Made a 3 year cycle low in January. So far it hasn't rallied much since the January low but traders are pricing in a 60%-70% chance of a rate hike by...
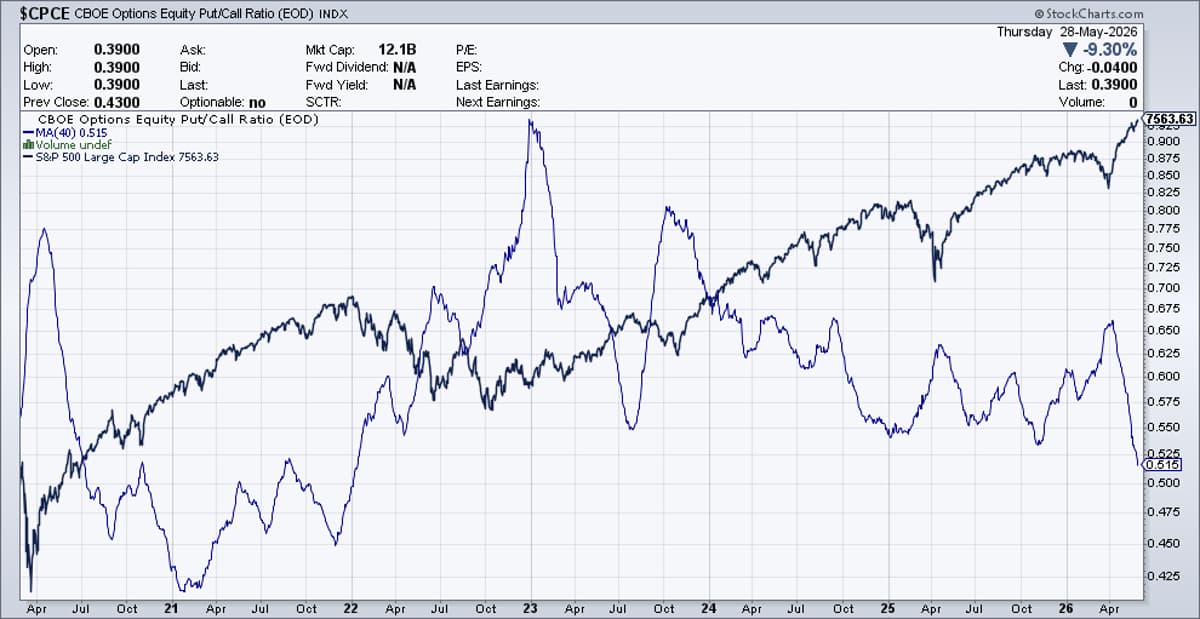
Equity Put/Call Ratio Hits 0.51, Lowest Since 2022
The 40 day MA of the Equity Put/Call ratio has dropped to 0.51, its lowest level since early 2022 when it was rising. The last time it was at 0.51 and declining like now was in 2020. It made an...
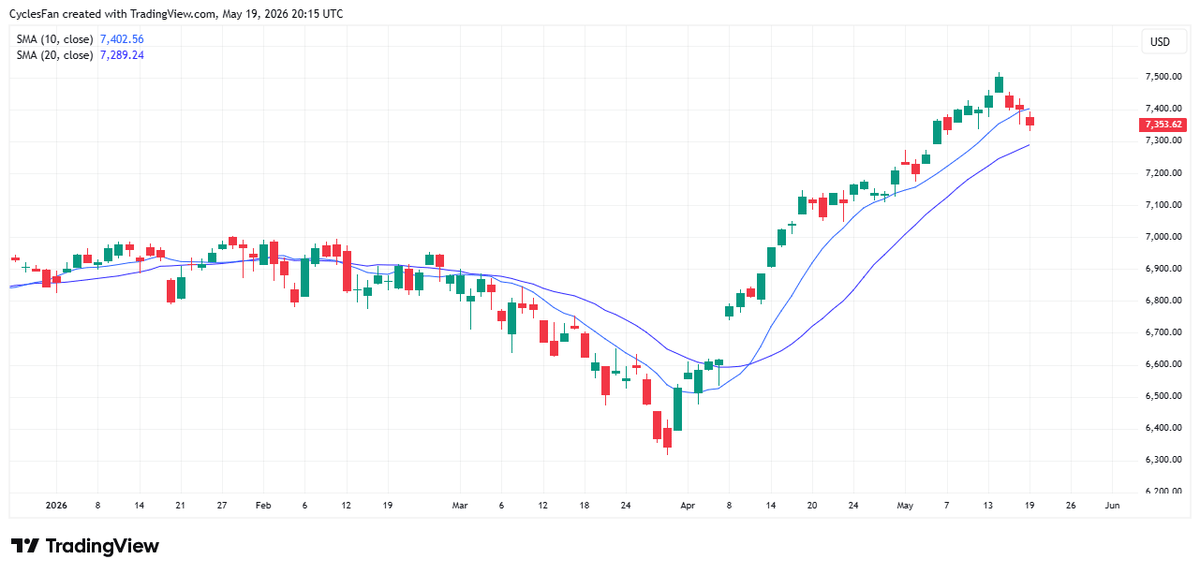
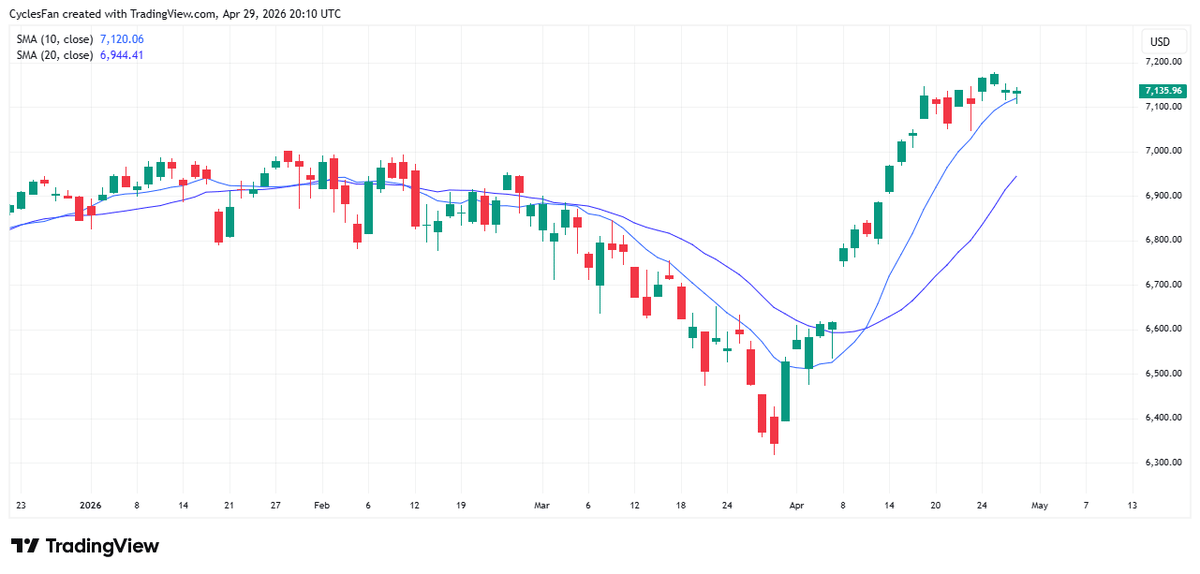
S&P Breaks 10‑Day Trend, Targets 7300
$SPX - Closed below the 10 day MA after 34 consecutive trading days above it. Therefore, the odds favor further downside to the 20 day MA that will be around 7300 tomorrow. https://t.co/WnNLq9oqnW
BTC Break Below 73,836 Signals End of Rally
$BTC has been selling off since last Monday. The monthly pivot is at 73836. A close below 73836 will probably mean that the bear market rally that started on February 6 is over and new lows for the year are...
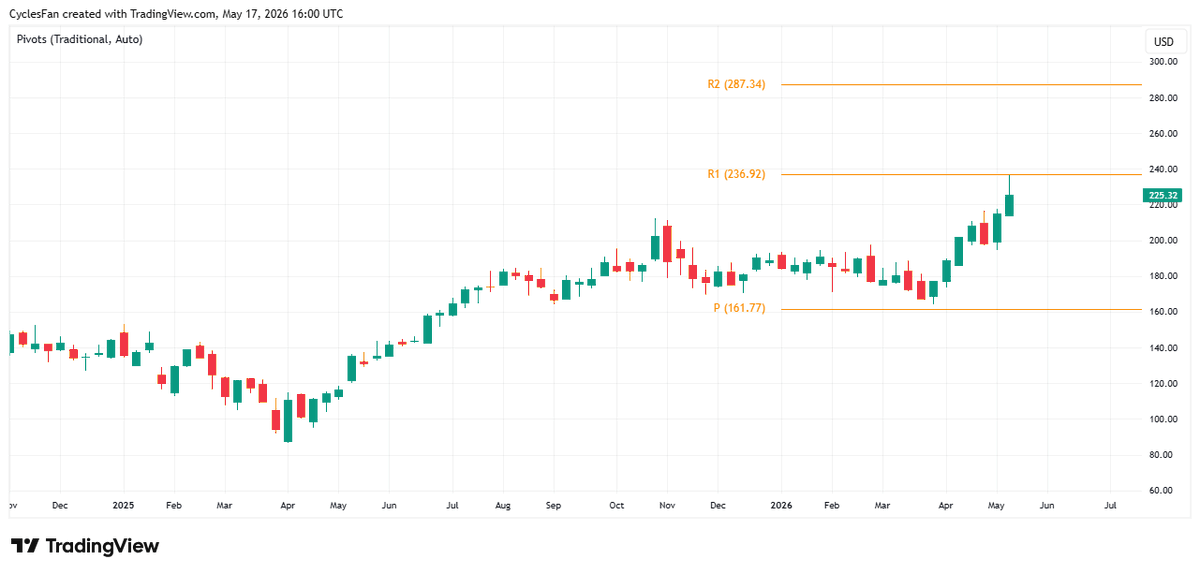
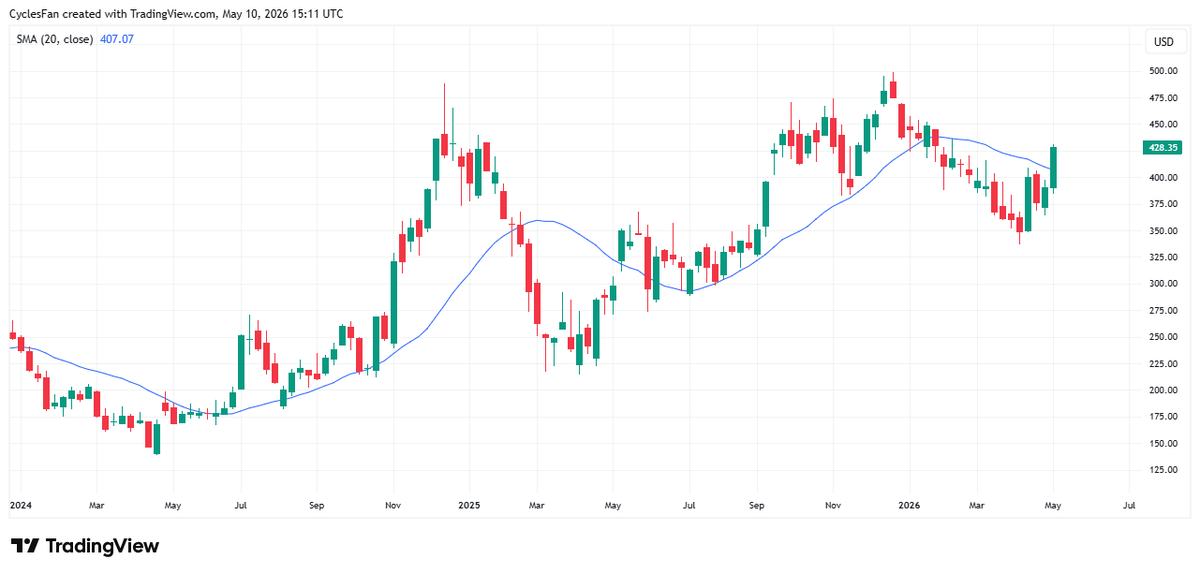
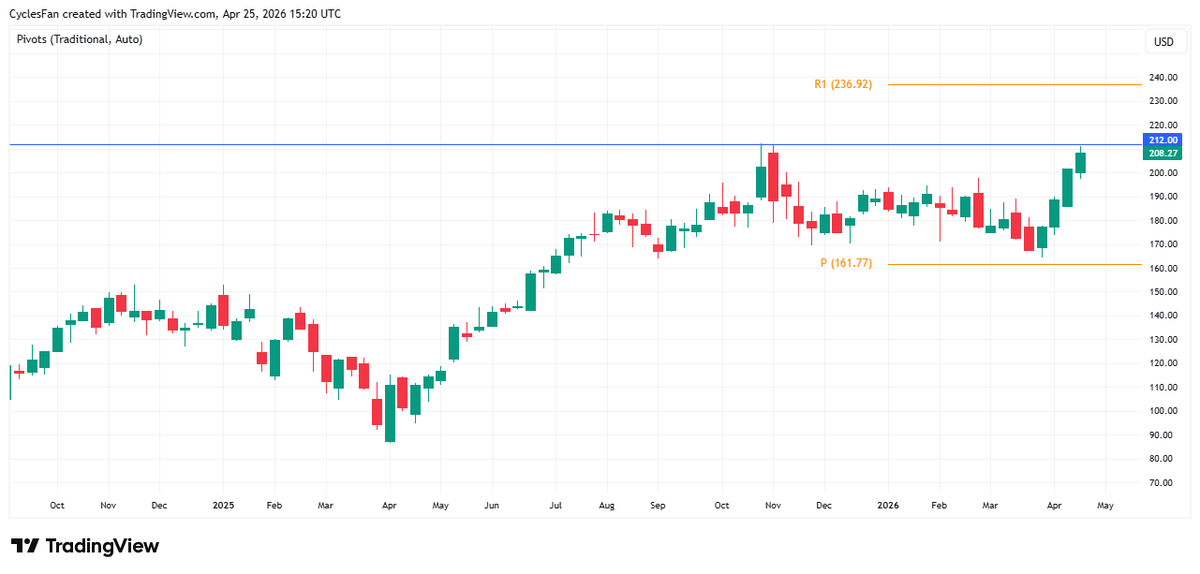
NVDA's 237 Resistance Test Signals Potential Top
$NVDA - At the intra week high it reached the 1st yearly resistance at 237 and then dropped 4.9%. If the market has a negative reaction to earnings it may have made an early intermediate term top. On the other...
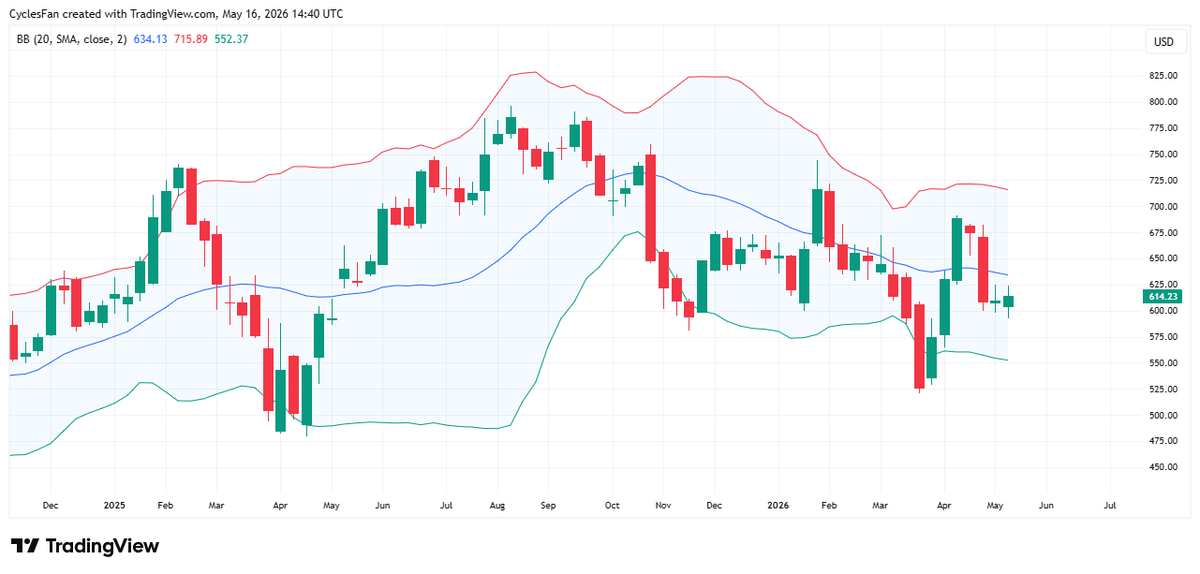
Meta Slides Below 20‑Week MA, Threatened by New Low
$META - The only MAG 7 stock that is trading below its 20 week MA which puts it in a weekly downtrend. Unless it closes above the 20 week MA in the next few weeks it's at risk of making...
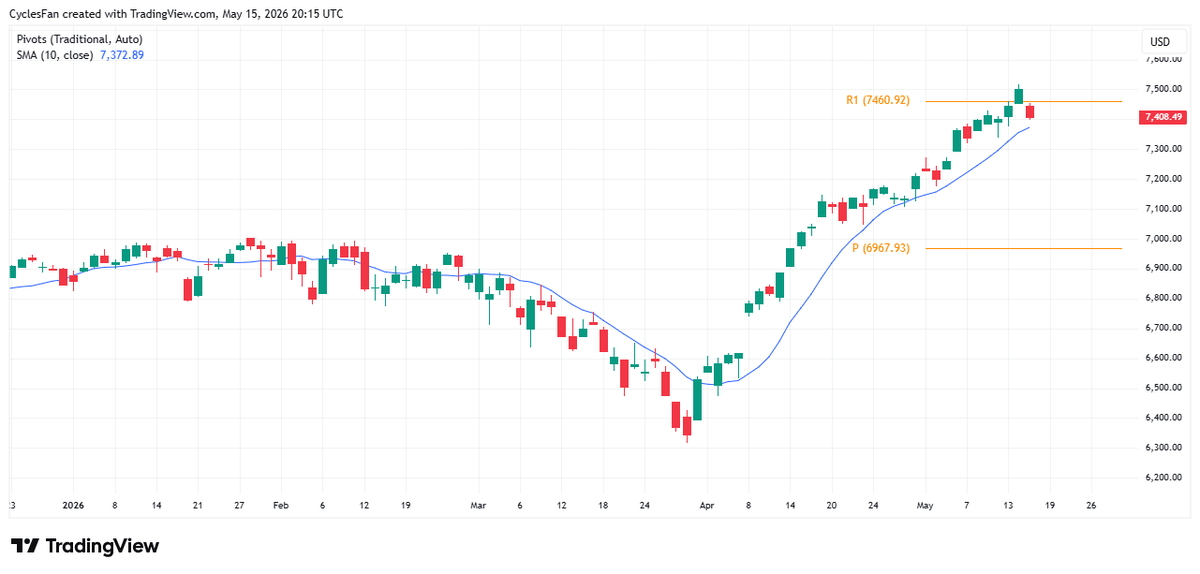
SPX Poised for Pullback Amid Iran Conflict Risk
$SPX - Yesterday it closed above the resistance at 7460 but today it close below it. That is a potential setup for a pullback. If the war in Iran resumes this weekend as some signs are pointing to, we may...
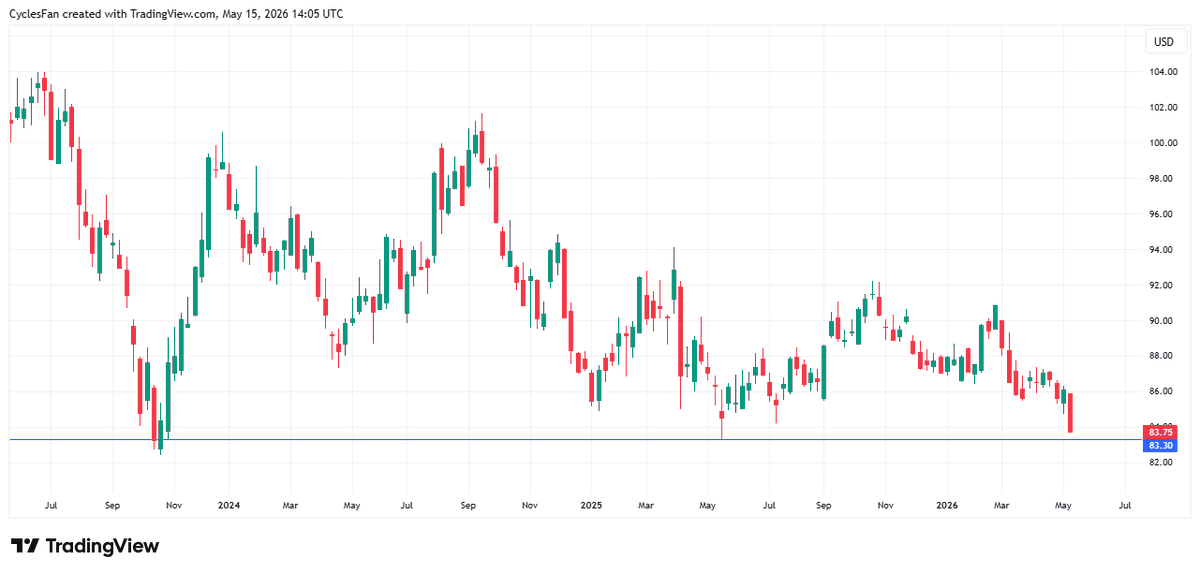
TLT Nears May 2025 Low; Next Support at 82.42
$TLT - Approaching the May 2025 low at 83.30. If 83.30 doesn't hold the next support would be the October 2023 major low at 82.42. https://t.co/NHoyTKC974
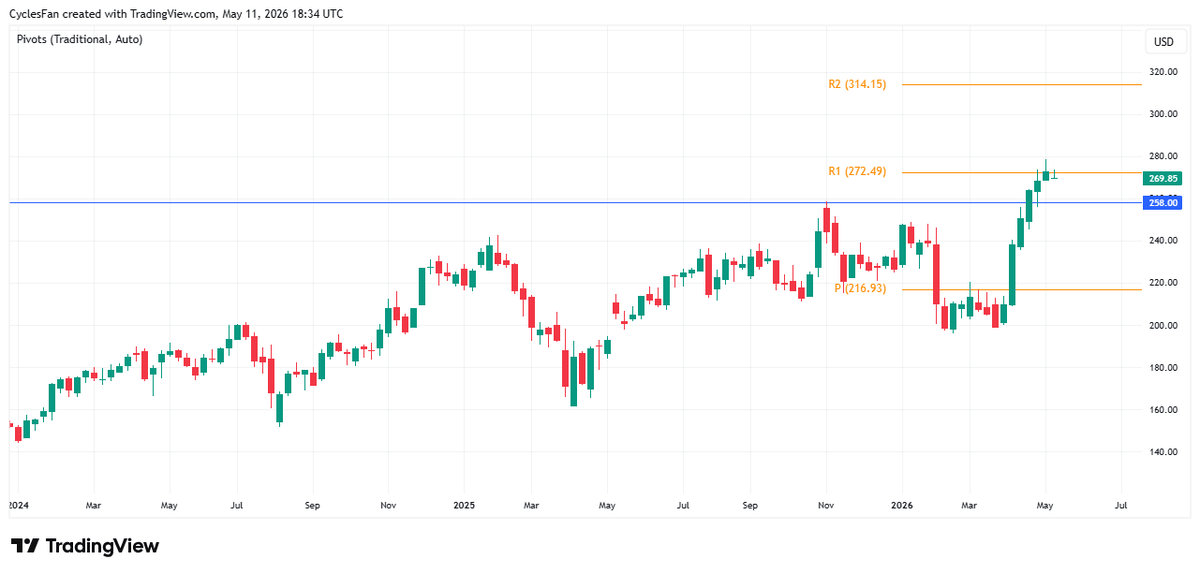
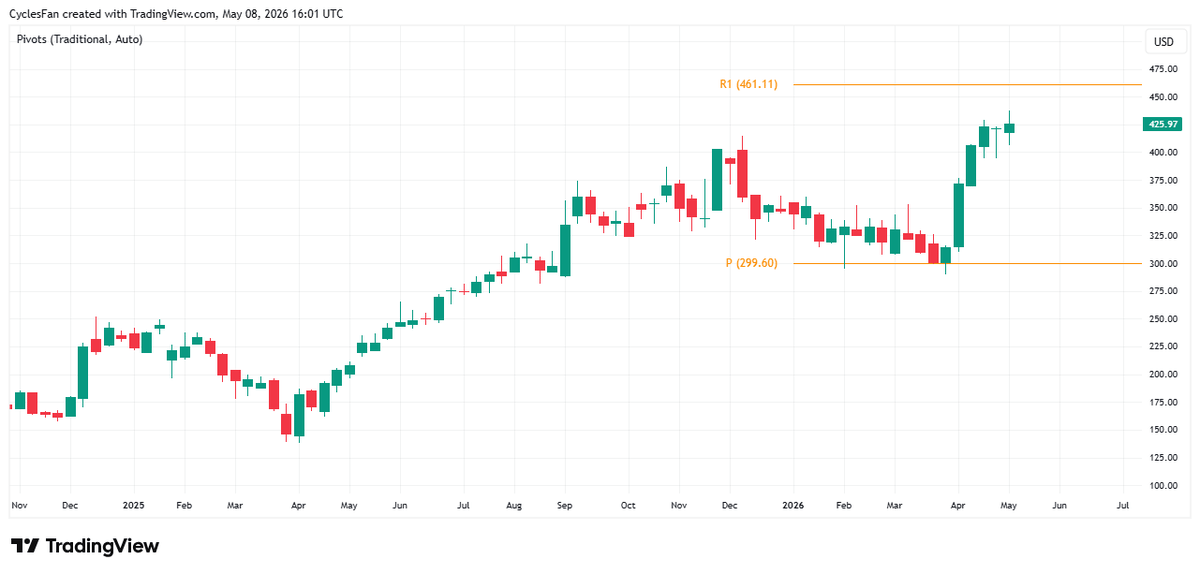
Amazon Likely to Retest ATH Before Breaking 272
$AMZN is having trouble achieving a weekly close above the 1st yearly resistance at 272. I think it will eventually do that but it may pull back and test the previous ATH before that. A weekly close above 272 will...
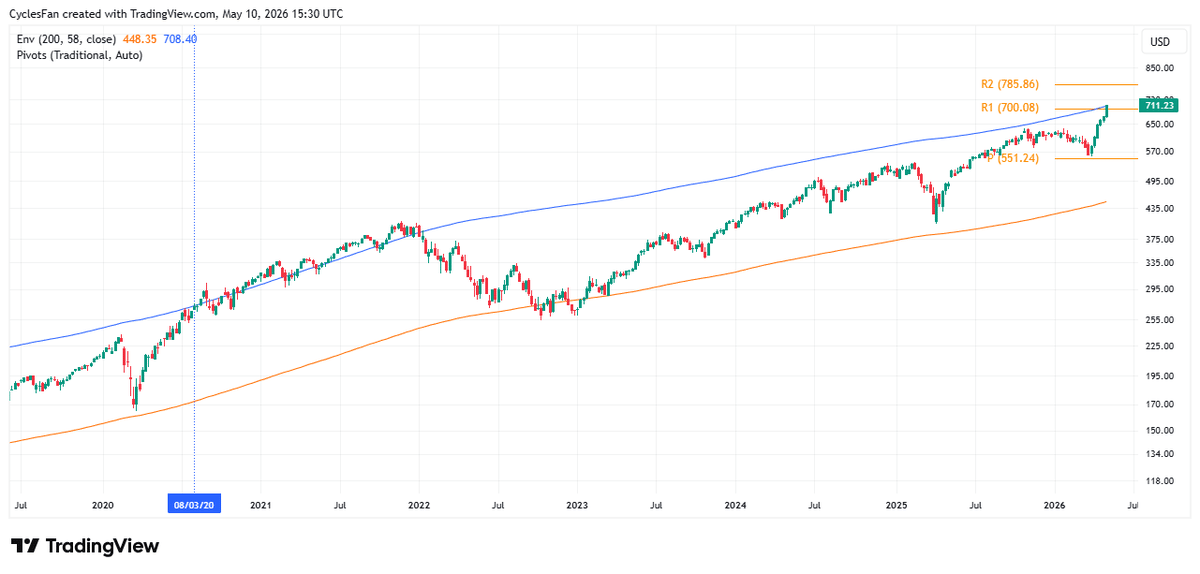
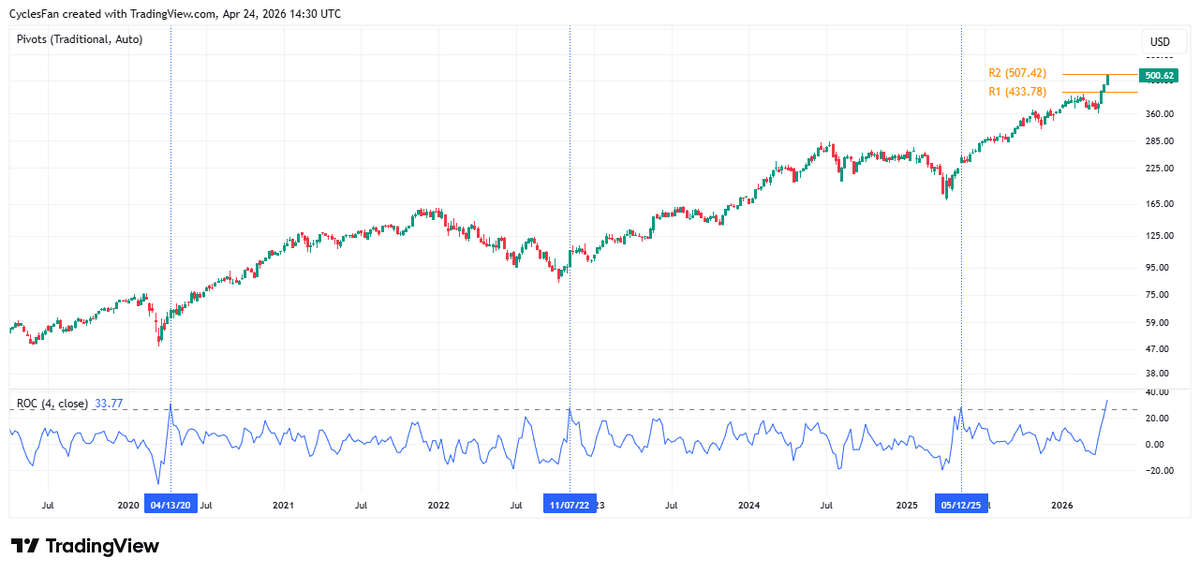
QQQ Surges Above 200‑Week MA, Targets 786
$QQQ - Closed the week above the yearly R1(700). The yearly R2 is 786. It's now more than 58% above its 200 week MA, for the 1st time since 2020-2021. I'm looking for it to do what it did at...
Tesla Near $499 ATH, Then Likely 30% Dip
$TSLA - Closed the week above the 20 week MA and confirmed that it made an intermediate term low in early April. The next upside target is the ATH at 499. It's likely to do what it does every year,...
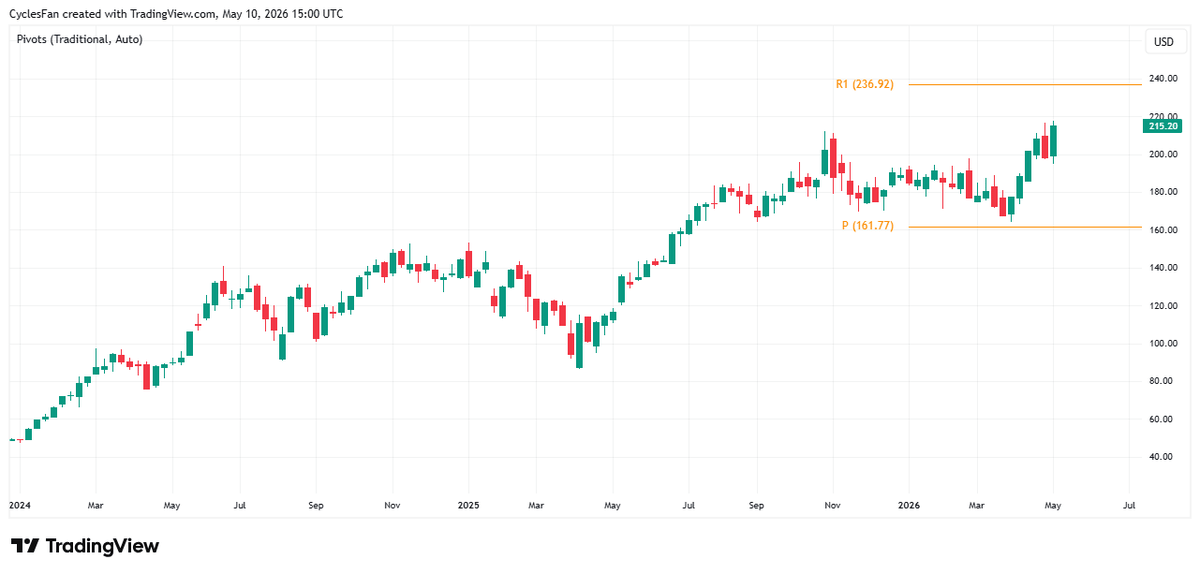
Nvidia Poised to Break Yearly Resistance at 237
$NVDA - After last week's bearish engulfing candle we had an outside bullish reversal candle and made a new ATH this week. That keeps Nvidia on track to reaching the 1st yearly resistance at 237 before it makes its next...
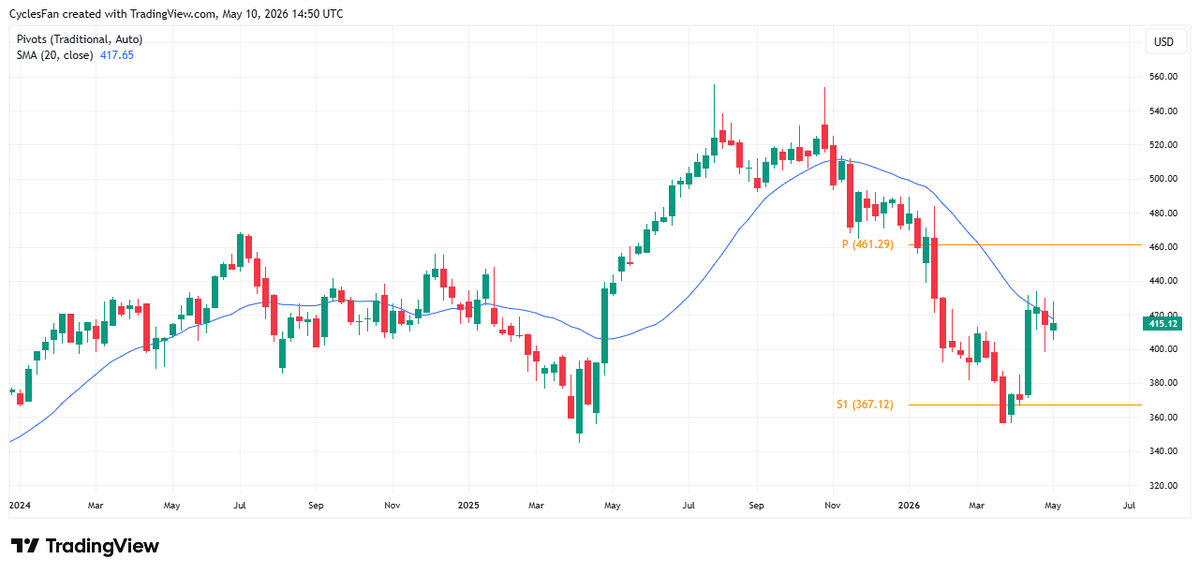
MSFT Needs Weekly Close Above 20‑Week MA for Upside
$MSFT - Still below the 20 week MA. Until it closes above the 20 week MA we can't say with certainty that it made an intermediate term low in March. A weekly close above the 20 week MA will confirm...
Oil Expected to Decline as Iran Conflict Likely Subsides
$USOIL - Given that it's highly unlikely that the war in Iran will resume crude oil should generally move lower over the coming weeks, with occasional bounces whenever there's news about an escalation of the situation like the ones we...
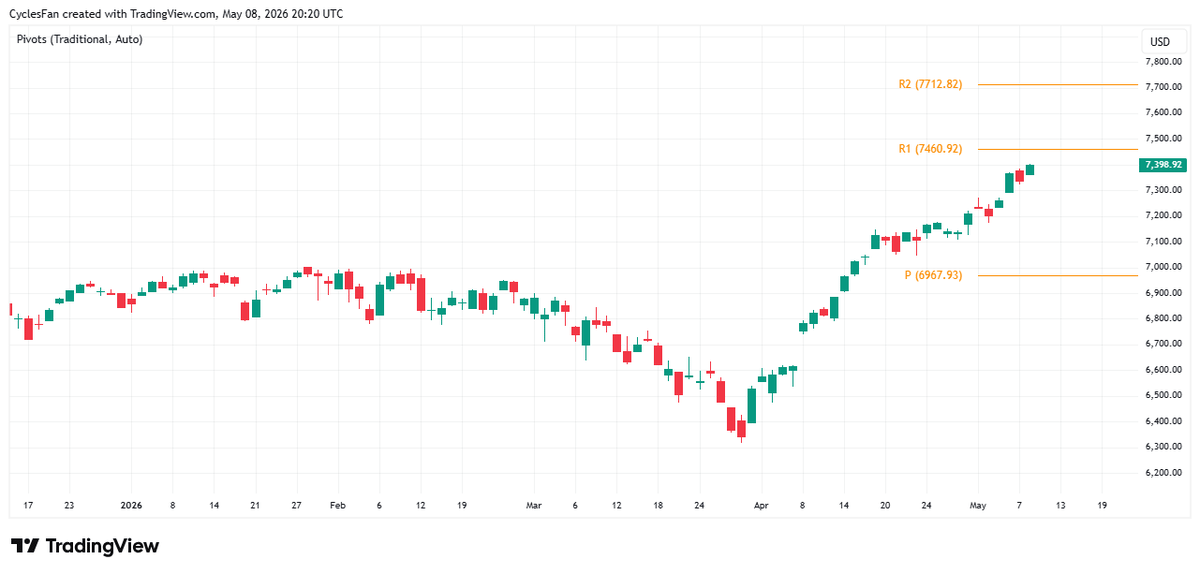
S&P 500 Eyes 7461 Resistance, Pullback Expected Soon
$SPX - The rally off the March low continued on the S&P 500 too. The 1st monthly resistance is 7461. We'll probably get a pullback once the S&P 500 hits it next week. https://t.co/9GGrpkAHE6
AVGO Stalls Near ATH; 461 Resistance Ahead
$AVGO - Made a new all time high 2 weeks ago but has barley made any progress since then. The next upside target is the 1st yearly resistance at 461. https://t.co/dgeAOMOmFc

Rare Andes Virus Surfaces on Dutch Cruise, Still Limited Cases
Now back to reality. The Andes Virus was discovered in Argentina in 1995. There have been only around 2000 documented cases in South America in 20 years. That virus wasn't a thing until 8 cases were discovered recently on that...
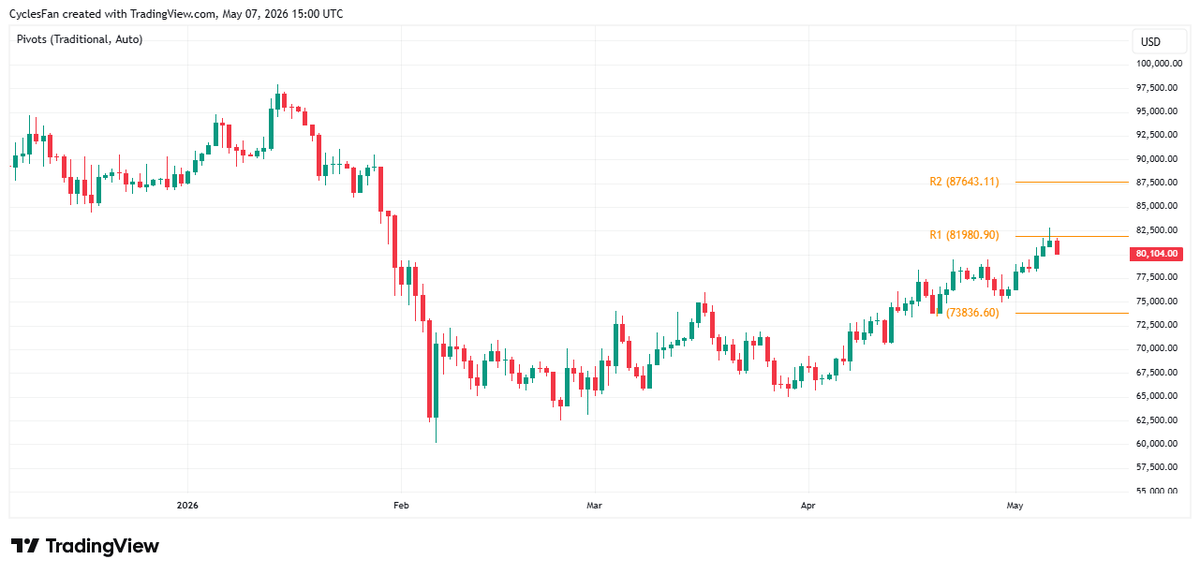
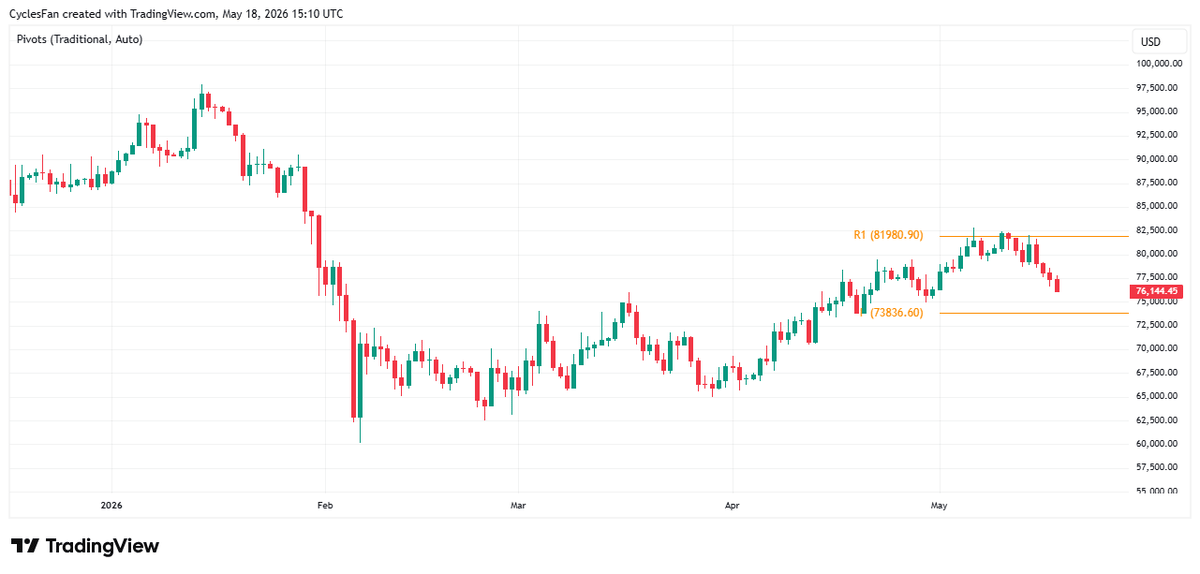
BTC Teeters at 82K; Break Decides Bullish or Bearish
$BTC has reached the 1st monthly resistance at 81980 and so far failed closing above it. If it succeeds closing above 82K the next target would be the 2nd monthly resistance at 87643. On the other hand, closing below the...
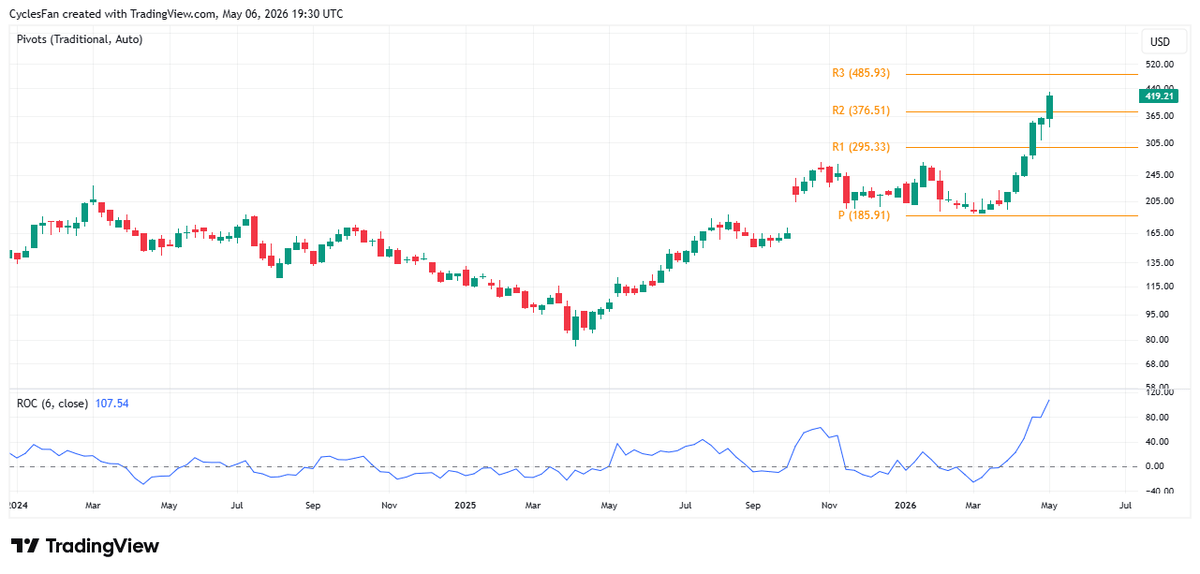
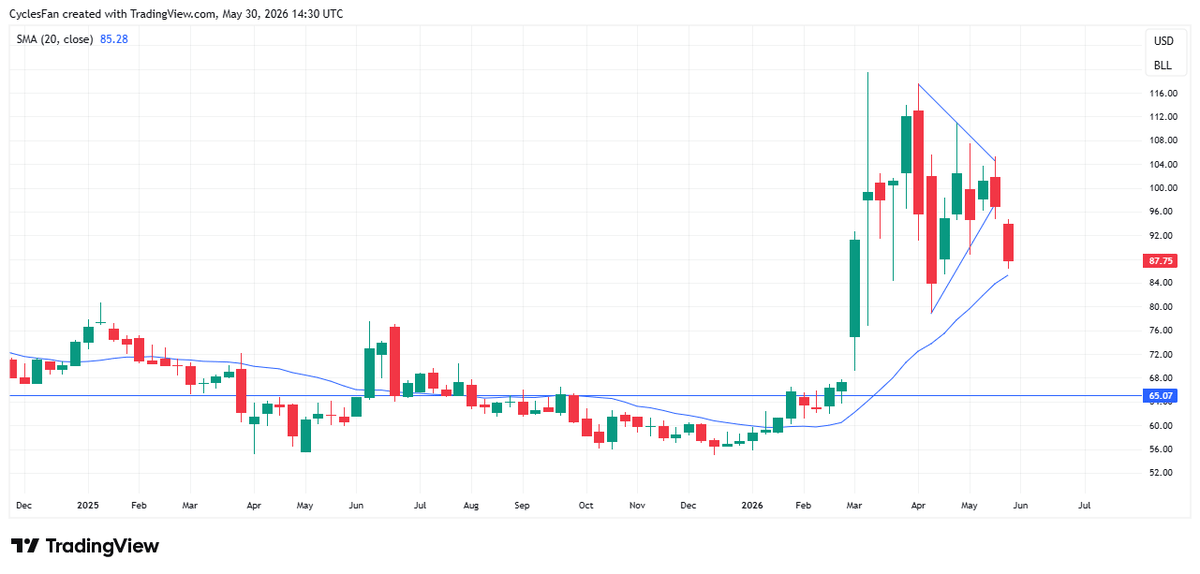
AMD's 100%+ Six‑Week Surge Mirrors 1975 Rally
$AMD - Up 18% after earnings. The next upside target is the 3rd yearly resistance at 486. AMD rallied 107% in the last 6 weeks. The only other time in history it rallied more than 100% in 6 weeks was...
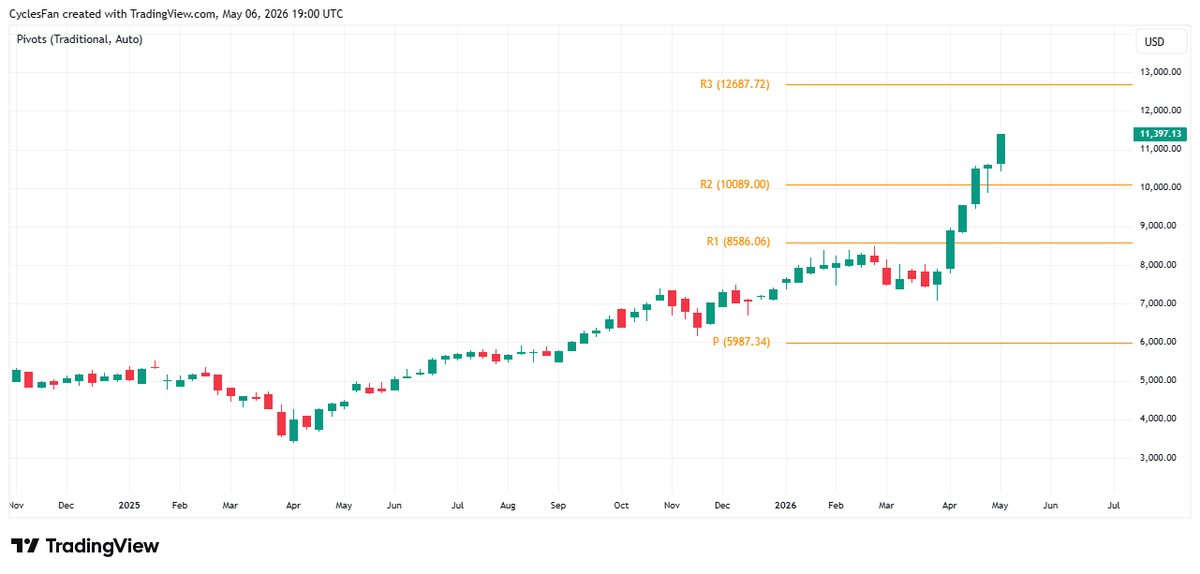
SOX Rallies 3.65% but Eyes 20% Crash Risk at 12,687
$SOX - The blow off move continues with a 3.65% up day. The level at which it starts being at risk of a 20%+ crash is the 3rd yearly resistance at 12687. https://t.co/Z0DSh4yR9h
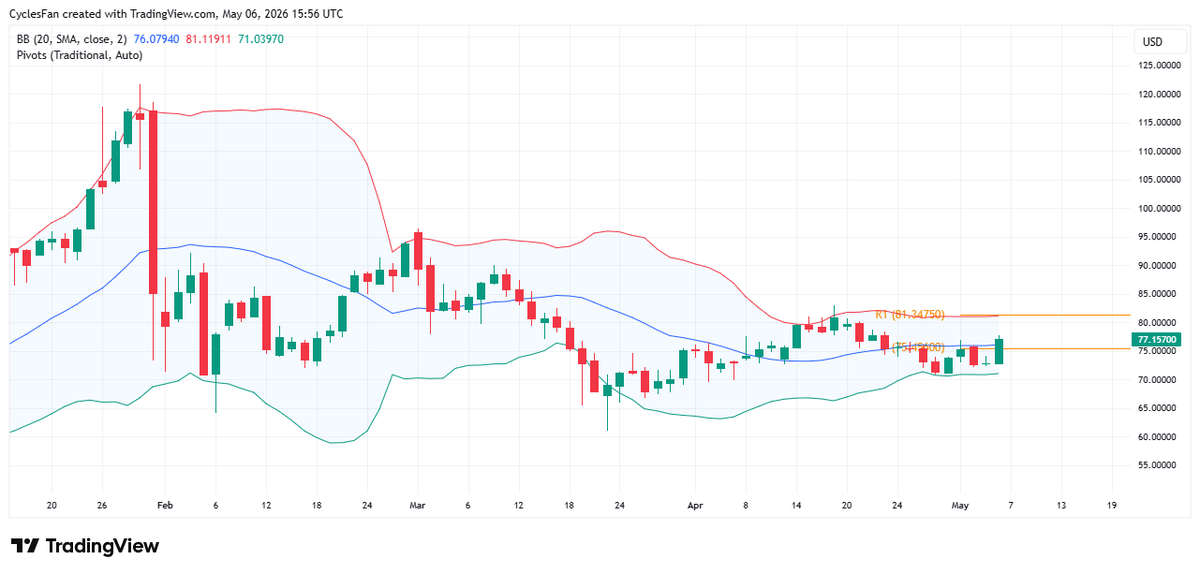
Silver Poised Above 20‑day MA, Eyeing $81.35
$Silver - If nothing dramatic happens by the close it will close above the 20 day MA and invalidate further downside(at least in the short term). The next upside target is the 1st monthly resistance at 81.35 which coincides with...

Expect 20%+ Market Crash July‑Oct 2026
IMO, this is not a bull market top like 2000 but the circumstances are different than November 1998. November 1998 happened after a 55% bear market in 1997-1998. Therefore, there's a high probability of a 20%+ crash in the July-October...
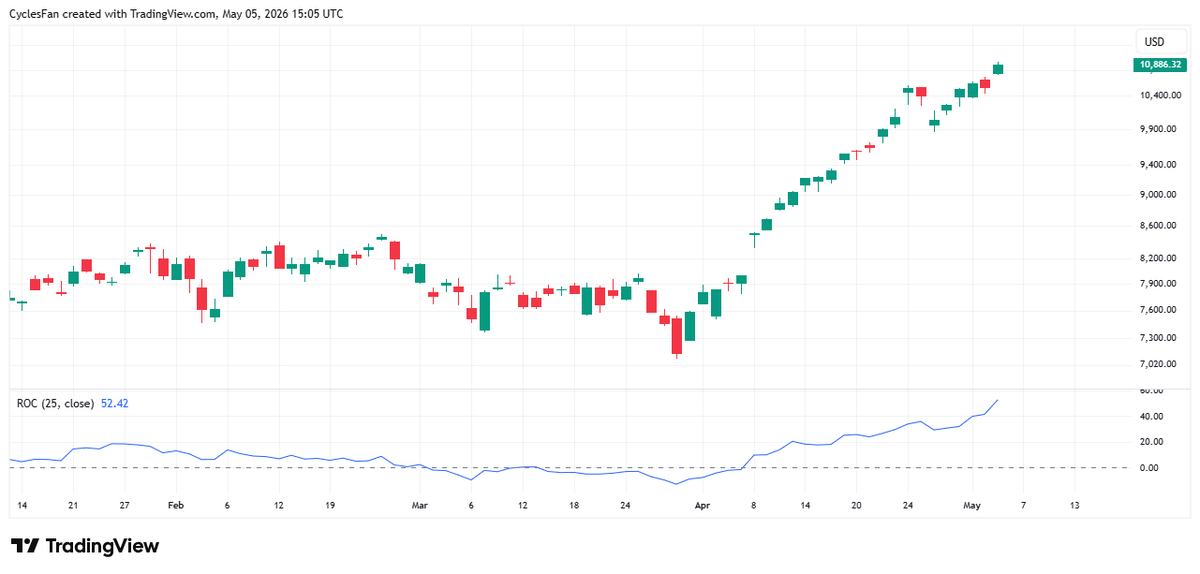
SOX Index Surges 52% in 25 Days, Rare Historical Feat
$SOX(semiconductor index) rallied more than 52% in the last 25 trading days. That happened only 2 other times in history. https://t.co/VAARPUBtPX
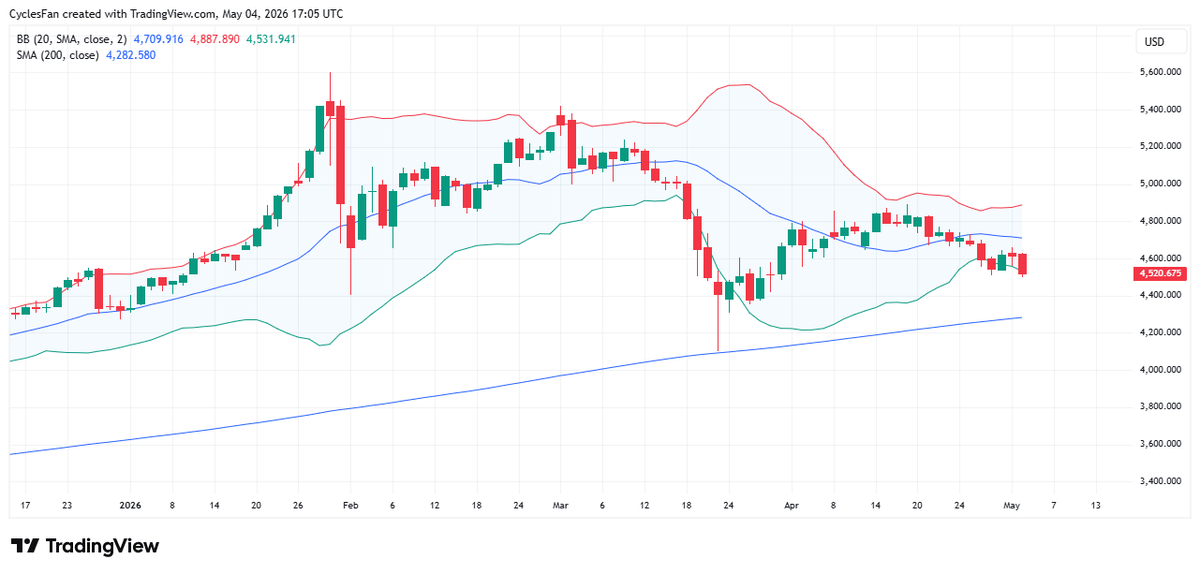
Gold Slides Below Weekly Low, Eyes 200‑Day MA
$Gold has broken last week's low. As I posted previously, the minimal target remains the 200 day MA that is currently at 4283. If it closes below the 200 DMA we'll see a retest of the March low at 4100....
Tesla Needs 20‑Week MA Breakout to Sustain Rally
$TSLA - Made a multi week low 3 weeks ago but it has not confirmed that it was an intermediate term low yet, because it's still below the 20 week MA. It needs a weekly close above the 20 week...
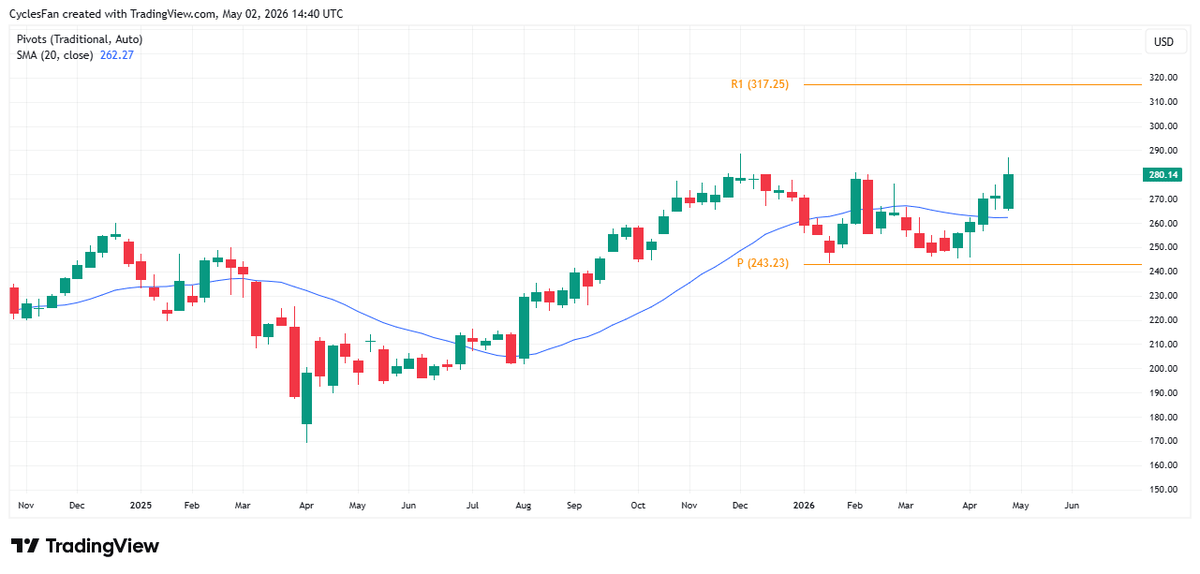
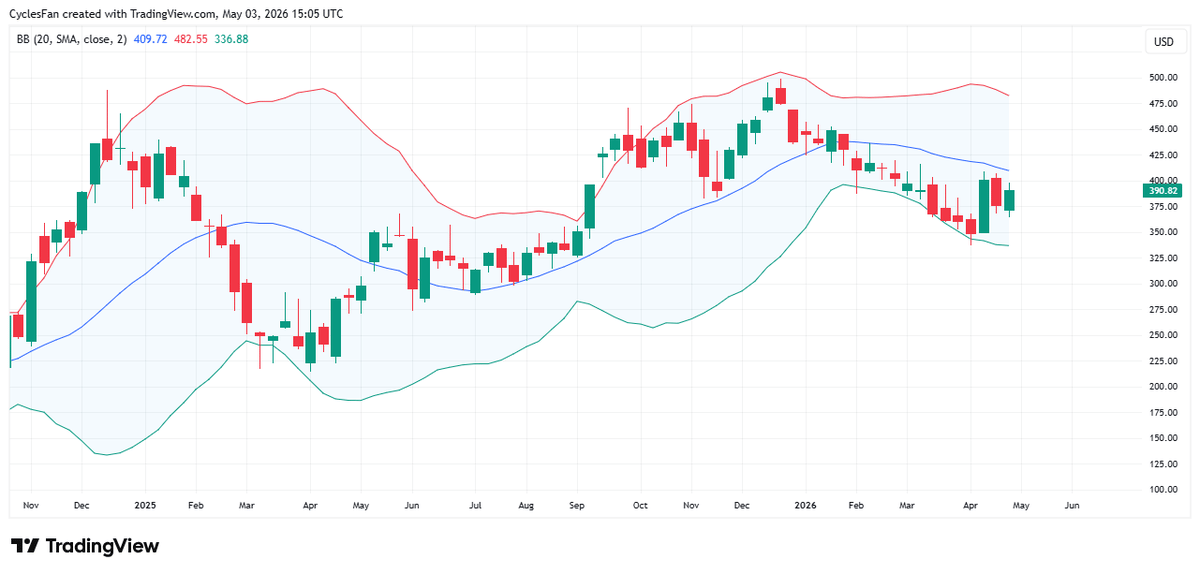
Apple's Q2 Path: New Highs, Pullback, or 243 Pivot
$AAPL - Up 3.2% on Friday but did not make a new ATH. The 3 potential scenarios for the rest of Q2: 1. New ATH and rally to the 1st yearly resistance at 317. 2. Pullback to the 20 week MA(262), then...
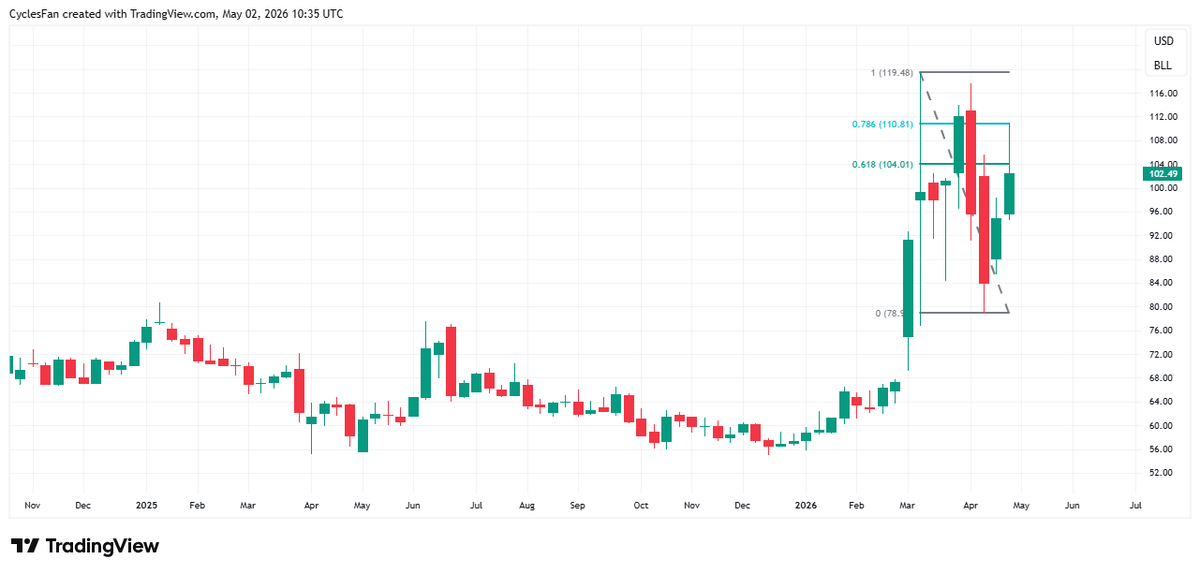
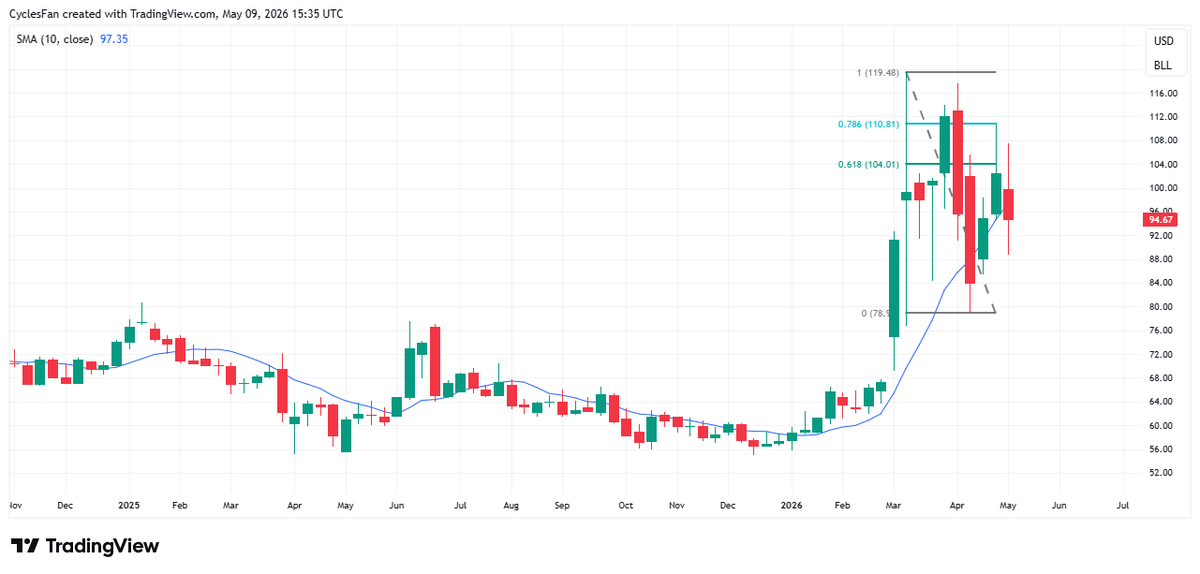
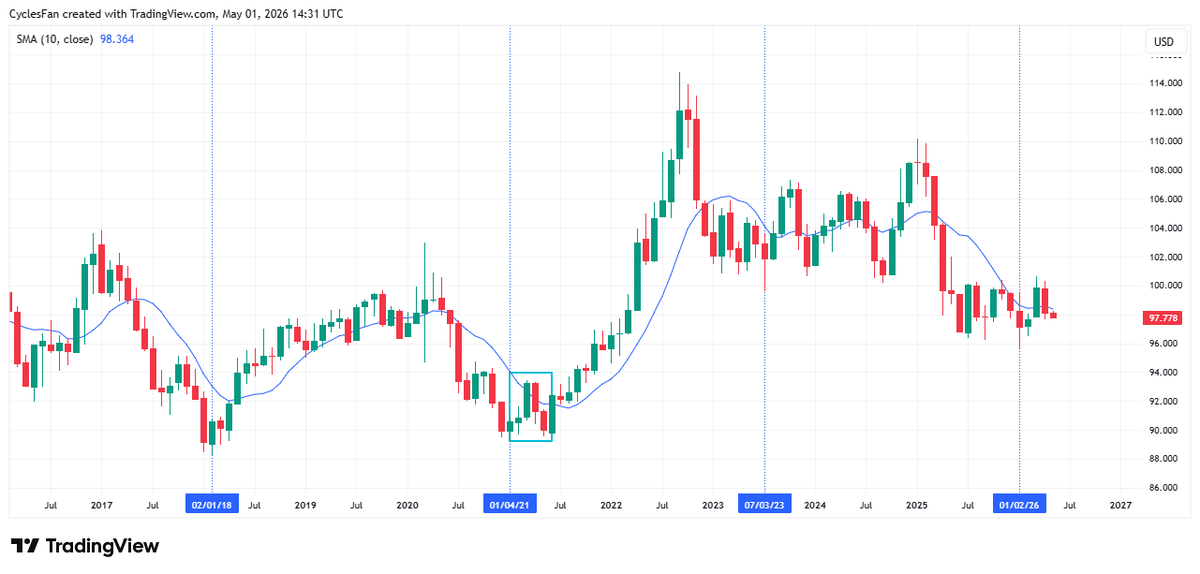
Oil Retraces 78% of Decline, Iran Drives May Outlook
$USOIL - At the intra week high crude oil retraced 78.6% of the decline from the March high to the April low but closed the week at 102.49. The price of oil in May will keep being determined solely by...
Silver's Next 7-Year Low Predicted for Late 2029
$Silver - The next 7 year cycle low is due in late 2029, let's say in November 2029. No one in the silversphere thinks that silver is in a bear market which probably means that it is. The January top...
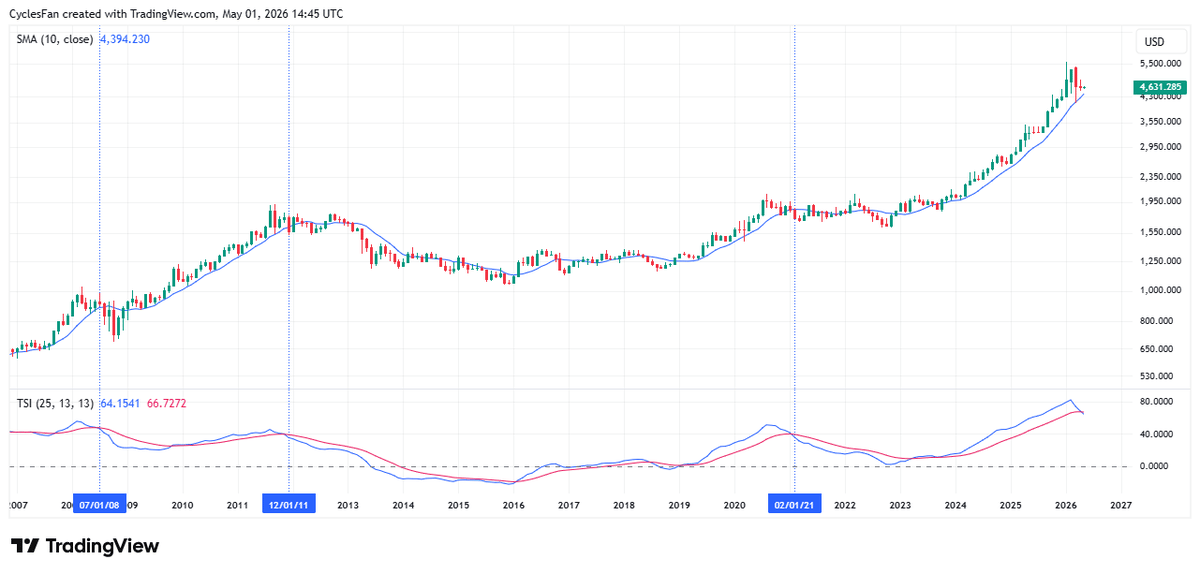
Gold's TSI Bearish Crossover Signals Potential Top
$Gold - Major warning sign: the TSI has a bearish crossover as it had in 2008, 2011 and 2021, but it's a monthly chart so the crossover has to remain intact at the end of May to be valid. The...
DXY Hits 3‑year Low, May Slip to 96
$DXY monthly - Made a 3 year cycle low in January. The action this year has been similar to 2021 when it rallied into March but retested the low in May. At the moment it looks like May will be...
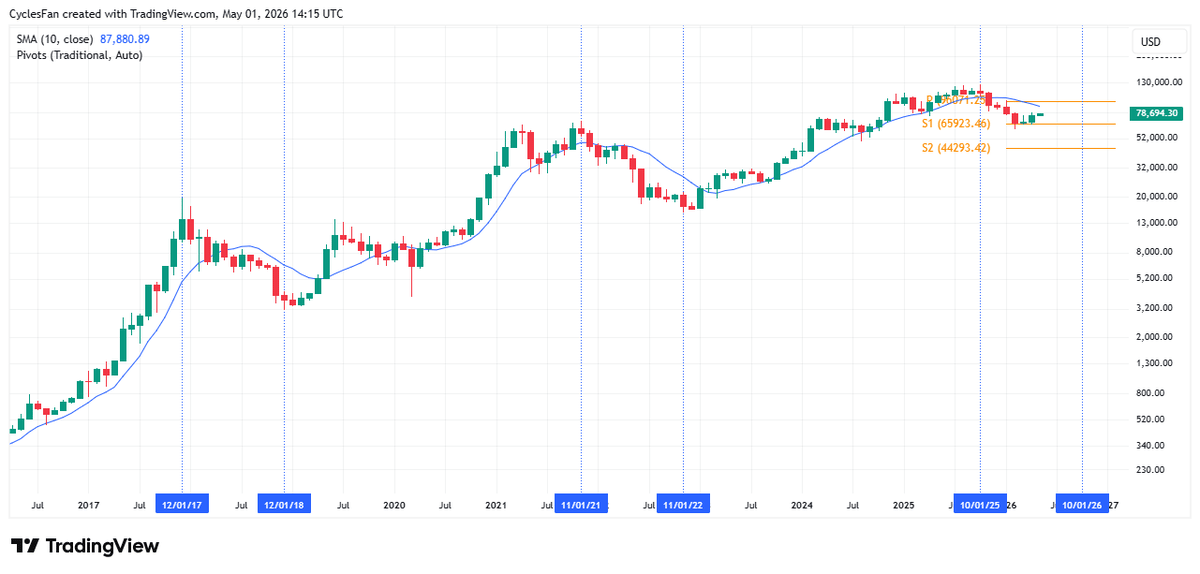
BTC Bear Market Likely Extends to October, 44K Bottom
$BTC monthly - April was an up month but I still expect the bear market to last 1 year as the previous ones lasted, and bottom in October. The current bounce may reach the 10 month MA(87.9K) in May/June before...
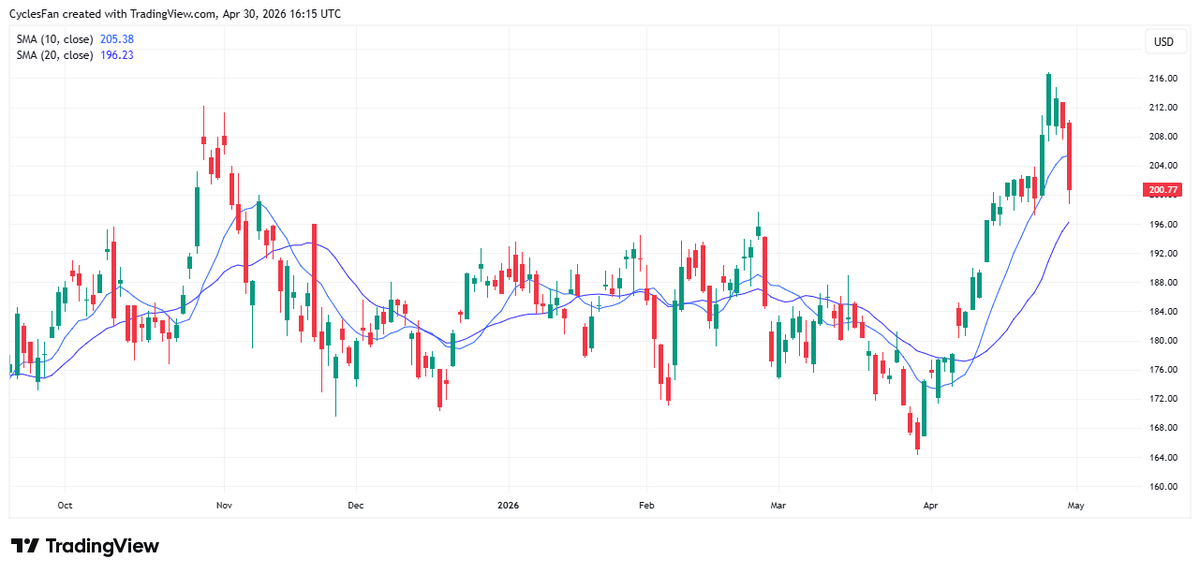
NVDA's False Breakout; Watch 20‑day Support at 196
$NVDA - While the focus is on the four MAG 7s that reported yesterday, it turns out NVDA's breakout on Monday was a false breakout and it will close below the 10 day MA. The next support is the 20...

Investors Foolishly Favor Overpriced Stocks over Cheaper Alternatives
There's no other way to describe the investors reaction to MAG 7 earnings other than idiotic. They're selling off the cheaper stocks in favor of buying the more expensive ones. Whoever buys $GOOGL at a 30X forward PE in favor...
SPX Near 10‑Day MA; Below Could Trigger Pullback
$SPX hit the 10 day MA today and hasn't confirmed a short term top yet, but that's likely to change tomorrow after the mixed reaction to MAG 7 earnings. A close below the 10 DMA would lead to a pullback...
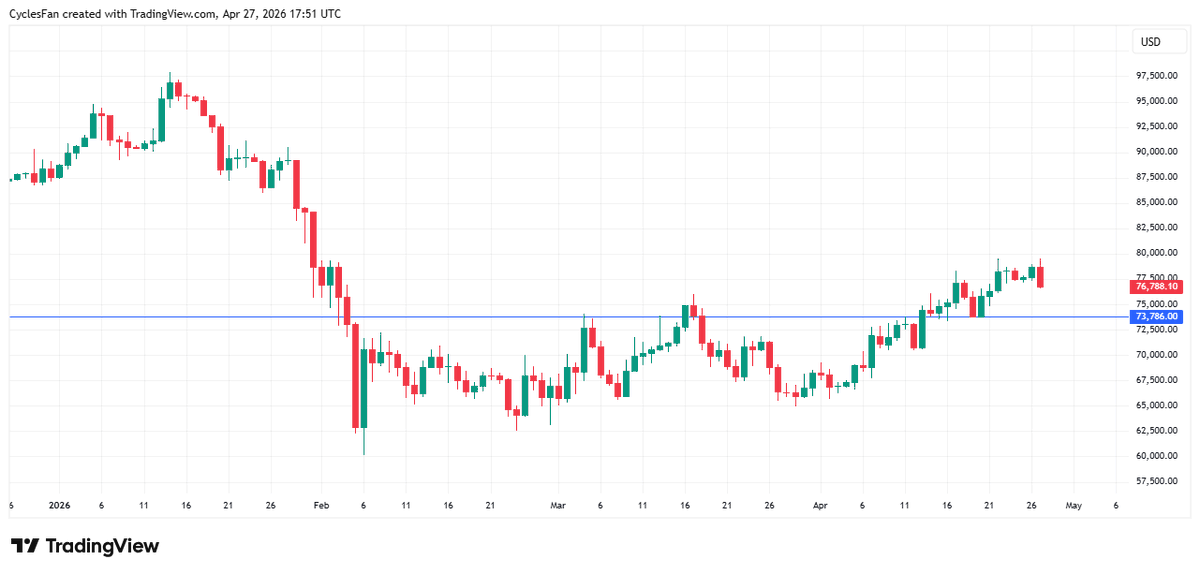
BTC Break Below 73,786 Signals New Bear Downtrend
$BTC - Since the March 29 low it has made higher highs and higher lows. If it falls below the recent short term low at 73786 we would have the 1st indication that the next down leg of the...
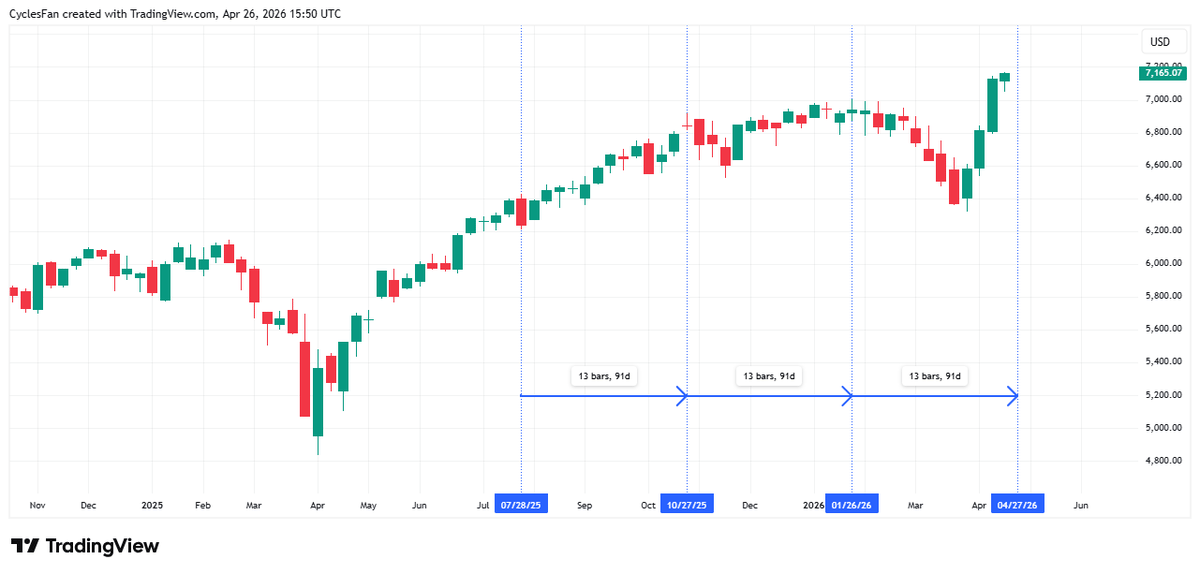
SPX Hits 13‑week Cycle, Expect Sector Rotation, Down Week
$SPX has made some sort of top every 13 weeks since July, whether it's a short term top like in July, or a multi week top like in January. We may see another one next week. I expect rotation, semi...
MSFT Expected to Break 20‑Week MA, Target 461
$MSFT - Despite the 4 week rally it has not confirmed an intermediate term low yet since it has to regain the 20 week MA to do that, but I expect it to be confirmed next week and the rally...
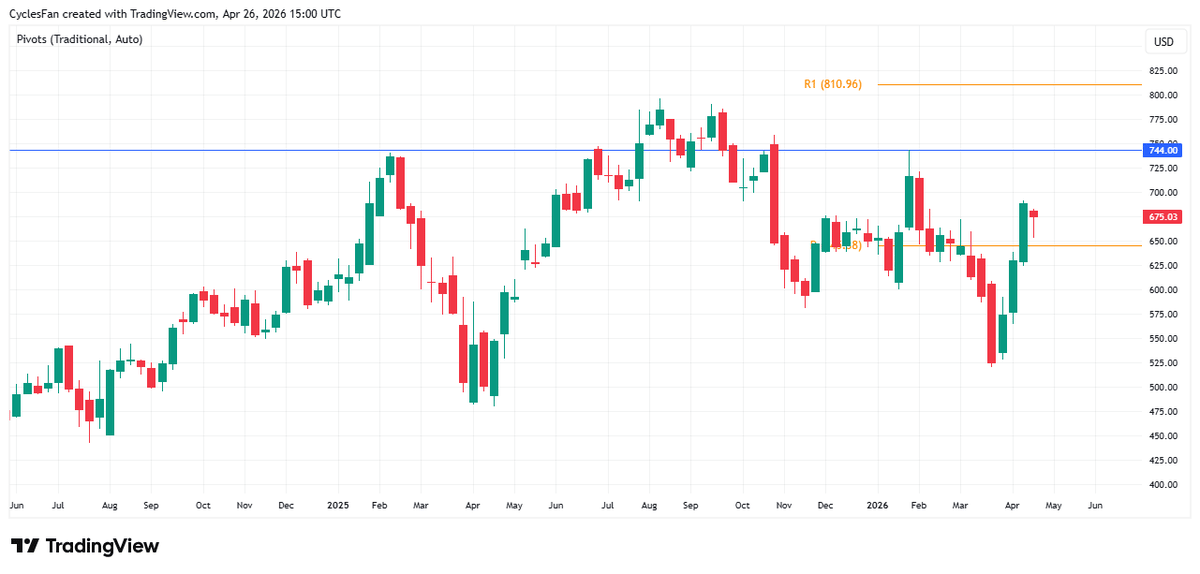
Meta's Earnings Decide Rally to 744 or Drop Below 645
$META - Unlike most tech stocks it closed the week down. Earnings on Wednesday will determine its next move: continue the rally to the next resistance at 744, or give back some of the gains it made in the last...
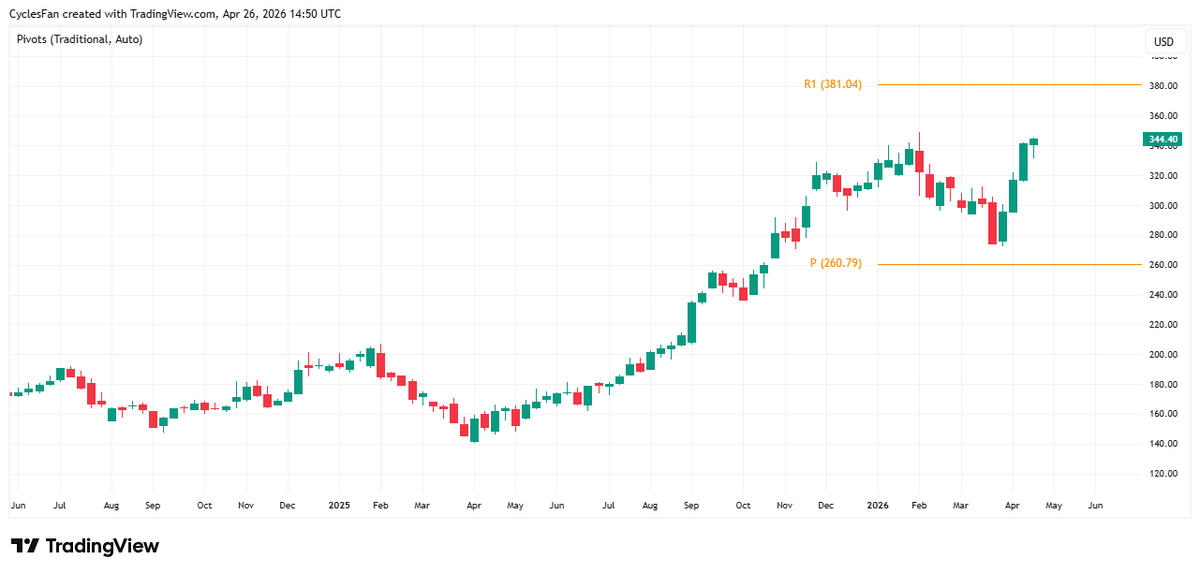
Google Near ATH; Earnings Decide Breakout or Pullback
$GOOGL - Up 4 weeks in a row and almost back to the ATH at 349. Earnings on Wednesday will determine if it breaks out and heads to the 1st yearly resistance at 381, or gives back some of the...
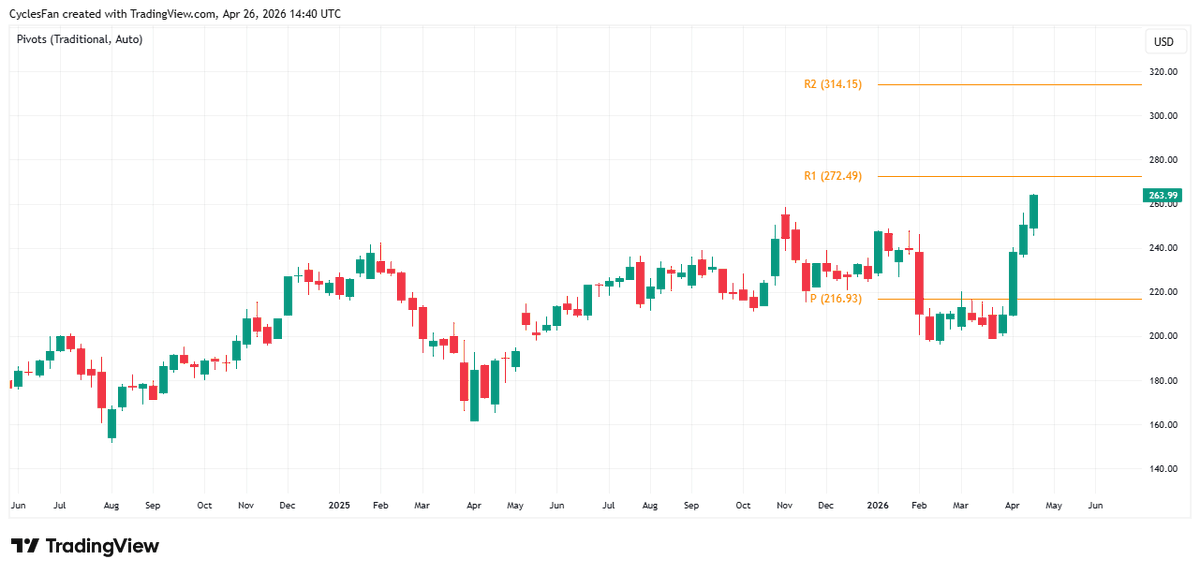
Amazon Hits New ATH; Watch 272 Pullback
$AMZN - The 1st MAG 7 stock to make a new ATH this week. The next upside target is the 1st yearly resistance at 272. A weekly close above 272 will lead to the 2nd yearly resistance at 314, but...
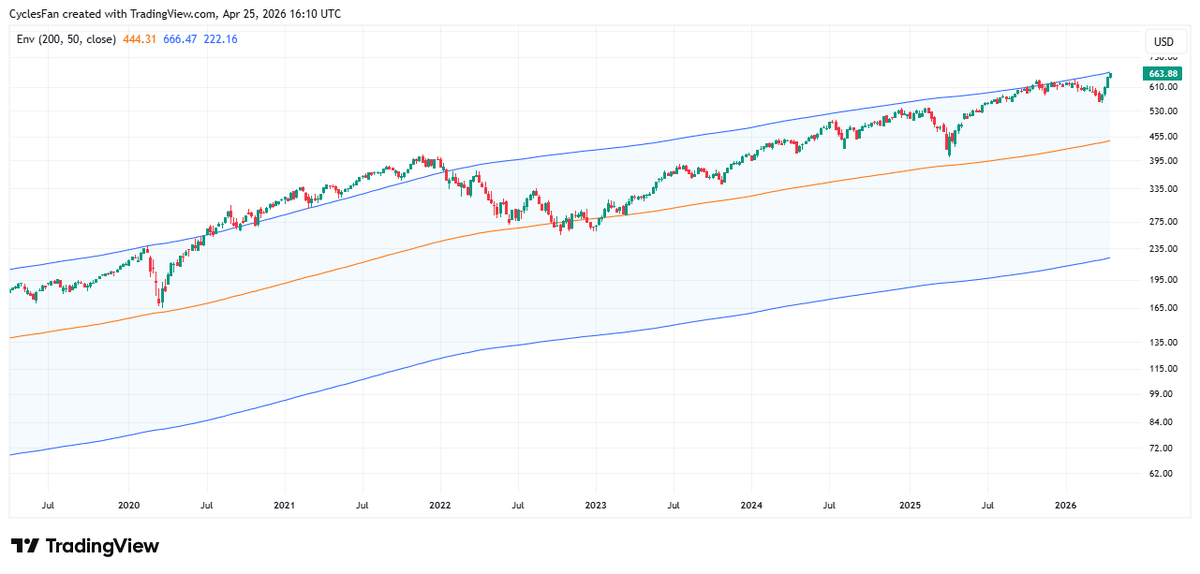
QQQ Near 50% Above 200‑Week MA—Rare Historical Signal
$QQQ is almost 50% above its 200 week MA. The last time that happened was in October and the weekly candle was above the threshold at the October top. Since 2009 the only prolonged period that it traded above the...
NVDA Climbs Fourth Week, yet New ATH Still Elusive
$NVDA - 4th up week in a row but it hasn't made a new ATH yet, while all other top 10 SMH components(except for ASML) have already made new highs. Its gigantic market cap continues to be a psychological deterrent....
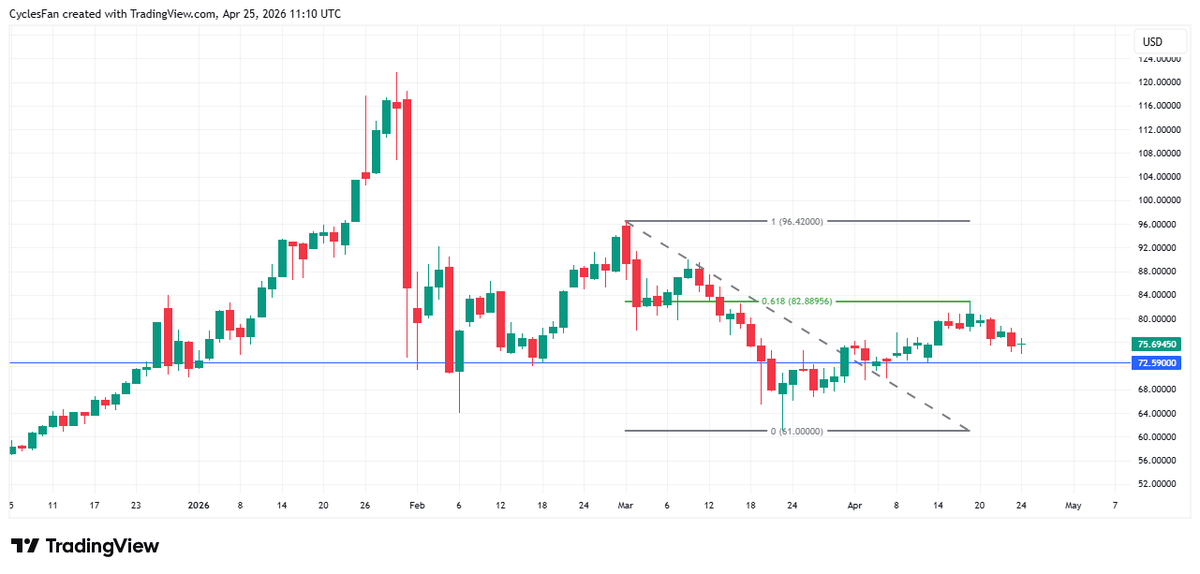
Silver Near Sell Signal; Break Below 72.59 Triggers Drop
$Silver - It looks like the bounce out of the March low ended at the 0.618 retracement of the March 3-23 downtrend and we're getting close to another sell signal. A close below 72.59 will likely lead to another decline...
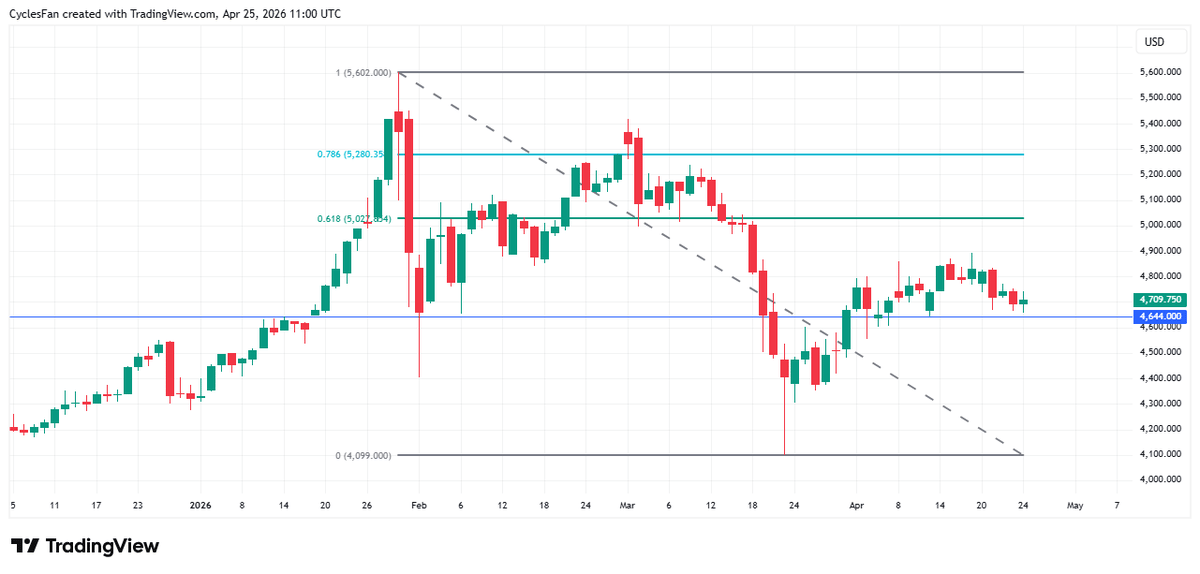
Gold Misses Bounce, Faces Potential Drop Below 4644
$Gold - I was expecting the bounce out of the March low to continue towards the 0.618 retracement at 5027. Instead, this week was a down week and price is getting close to another sell signal. A close below 4644...
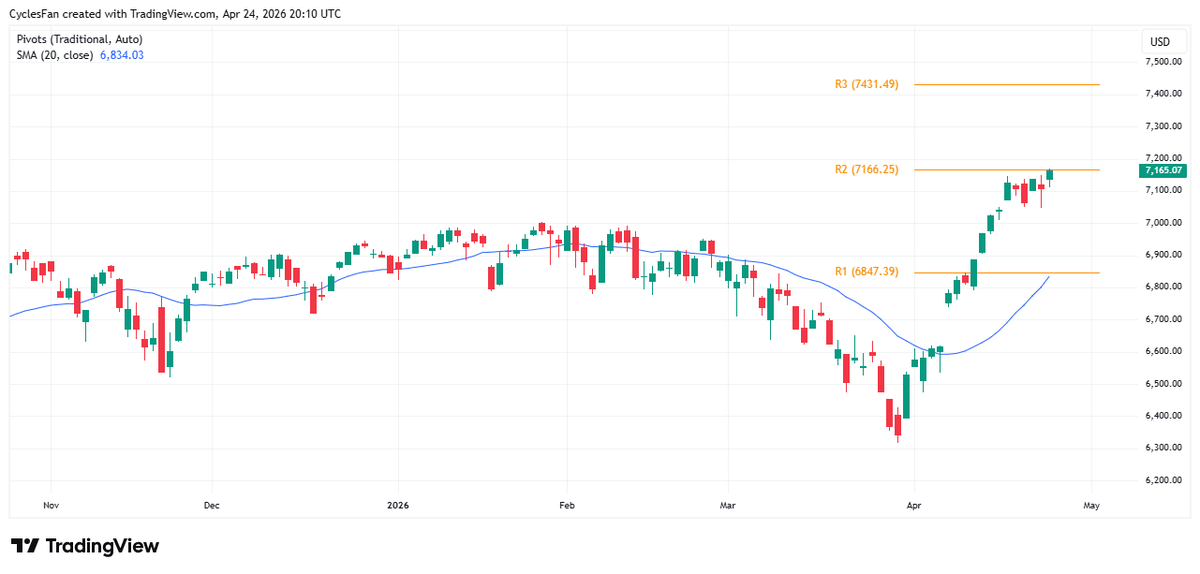
SPX Likely to Pull Back to 20‑day MA
$SPX - Made a new high today but it has reached the 2nd monthly resistance at 7166. The 3rd one is at 7431 and will not be reached in April. I expect a pullback to start next week and target...
SMH's 33% Four‑Week Surge Signals Potential Top
$SMH rallied 33% in the last 4 weeks. Since 2009, it rallied 27%+ in 4 weeks only 3 other times: after the 2020 Covid crash, after the 2022 bear market low, and after the 2025 tariff crash. Add to that...
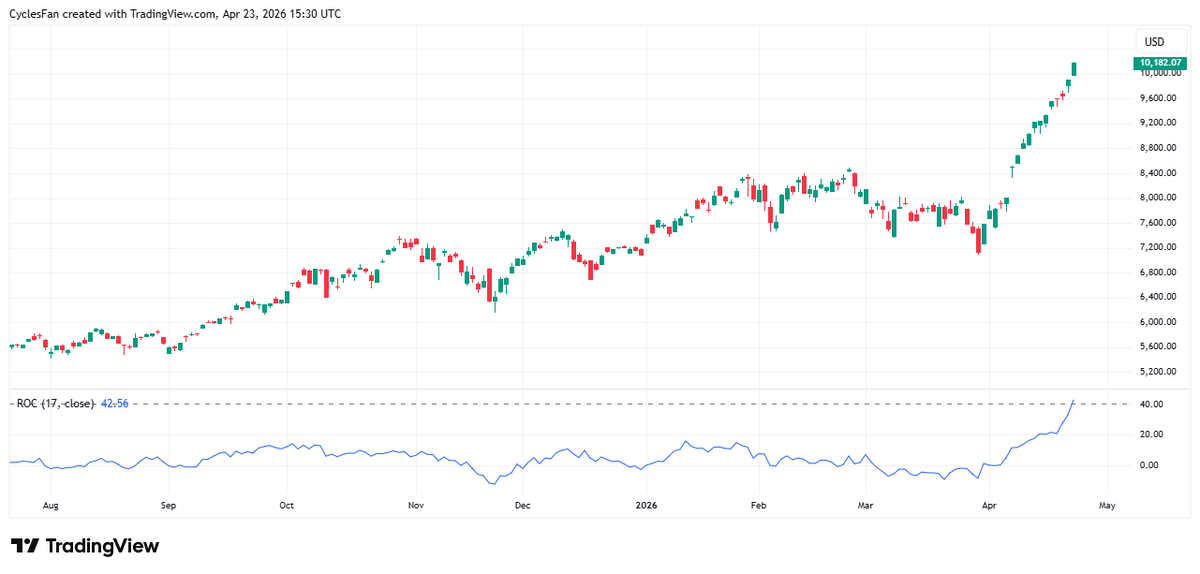
SOX's 42% Surge Mirrors Rare Post‑Bear Rallies
$SOX(semiconductors) rallied 42% in the last 17 trading days. This happened only twice in its history: On April 30, 2001, after 14 months of bear market. On November 1, 2002, at the beginning of a new bull market, and after 31 months...
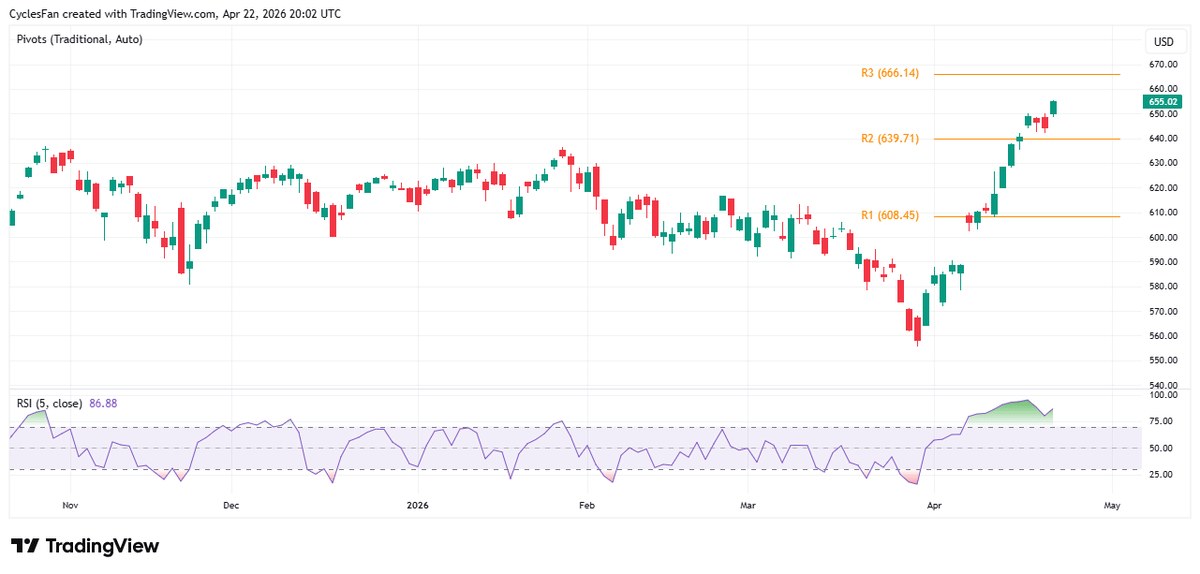
QQQ Hits New ATH; RSI Hints at Possible Pullback
$QQQ - Made another new ATH. Looking at RSI(5), there's a negative divergence that may lead to a pullback at any moment, but it's also possible that there won't be any significant pullback before it gets to the 3rd monthly...