
Nasdaq Breadth Thrust Signals Limited Crash Risk
According to SentimenTrader the Nasdaq had a breadth thrust on April 14. Based on that the market is unlikely to crash for the rest of the year, since the biggest drawdown at any point over the next 8 months in the prior 7 cases, was only 12%. https://t.co/vpTxh85KGl
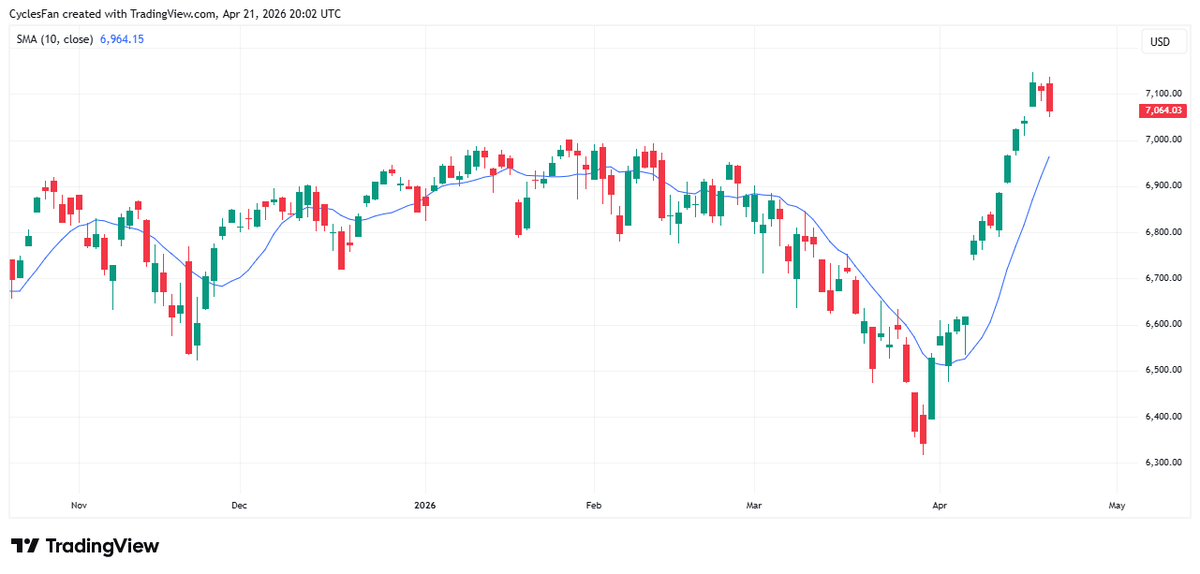
SPX Pullback Targets 10‑Day MA, Jan‑Feb Top Range
$SPX - 2nd down day in a row. It looks like we're having a pullback and the target for this pullback is likely to be the rising 10 day MA which coincides with the topping range from the January-February timeframe....
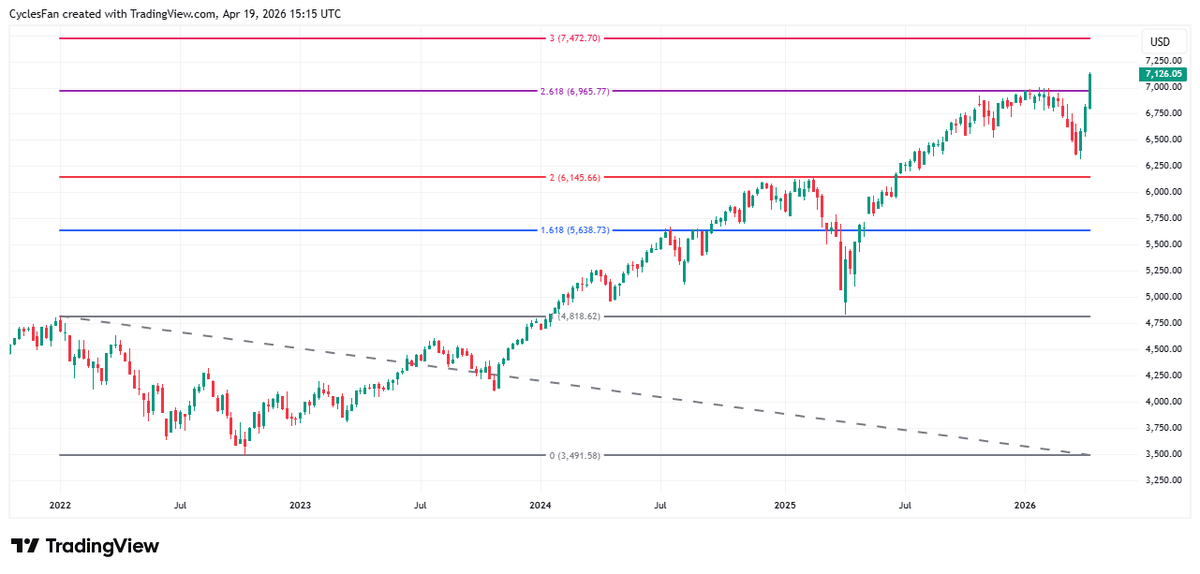
SPX Targets 7473 at Next 3.0 Fibonacci Extension
$SPX - Pay attention to the intermediate term tops it has made at extensions of the 2022 bear market. The July 2024 top at the 1.618 extension. The February 2025 top at the 2.0 extension. The January 2026 top at...
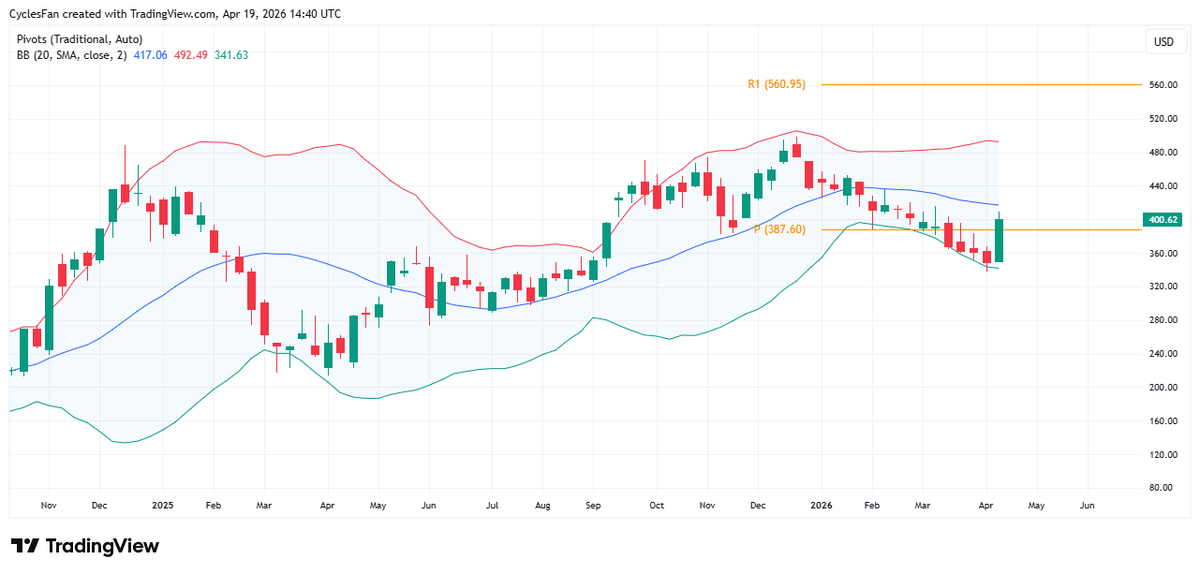
Tesla Needs Weekly Close Above 417 to Confirm Low
$TSLA - Probably made an intermediate term low last week, after closing the week above the yearly pivot at 387. It needs a weekly close above the 20 week MA(currently at 417) in order to confirm the low and head...
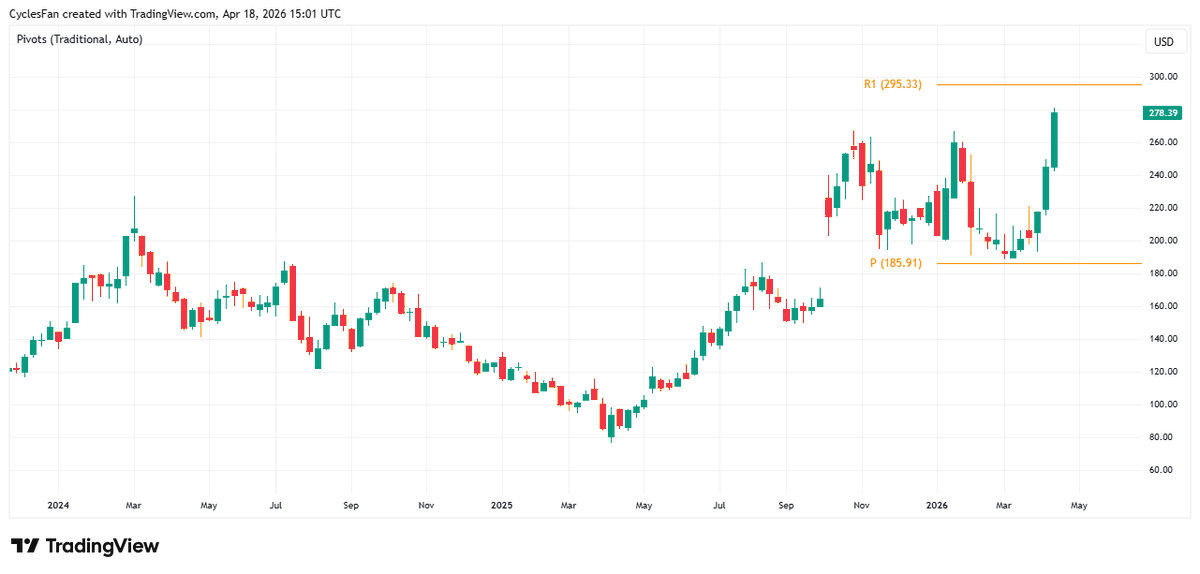
AMD Hits New ATH; Next Target $295 Resistance
$AMD - Made a new all time high this week. The next upside target is the 1st yearly resistance at $295. https://t.co/rbGWY99L42
Oil Prices Likely Stay Above $80 Amid Iran Conflict
$USOIL - Closed the week below the 10 week MA confirming that it made an intermediate term top in early March. Crude oil prices are likely to remain elevated(above $80) as long as the conflict with Iran isn't solved. https://t.co/BicUp8rpN4
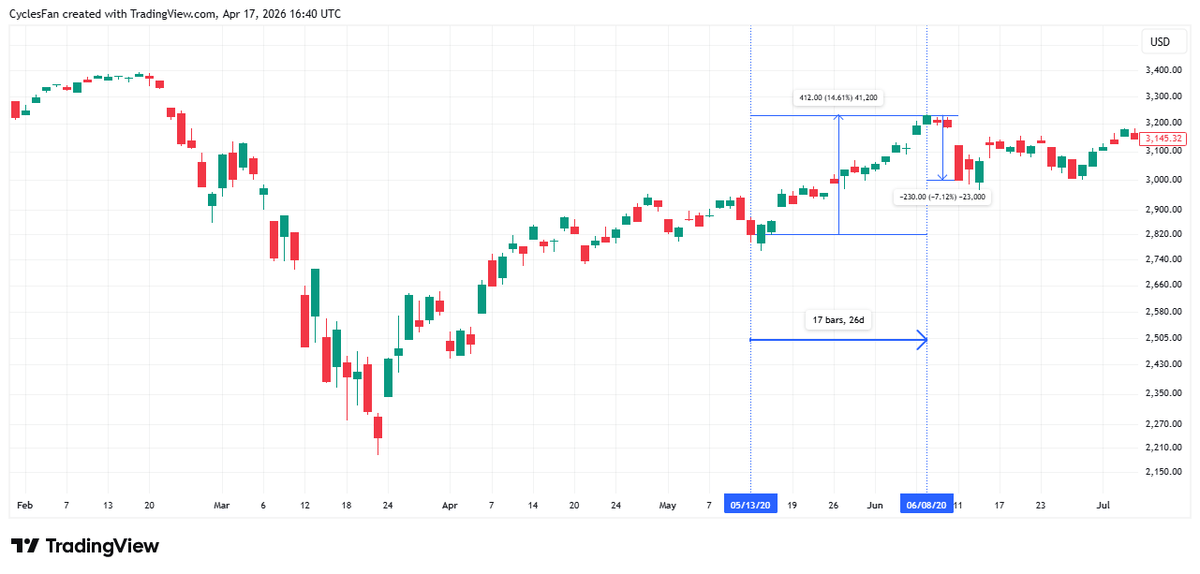
Current Rally Mirrors 2020 Surge, Gaps and Selloff
This is interesting because the May 14-June 8, 2020 rally has a few similarities to this rally. It rallied 14.6% in 17 trading days vs. 12.5% in 13 trading days so far. In 2020 there were 4 gaps vs. 3...
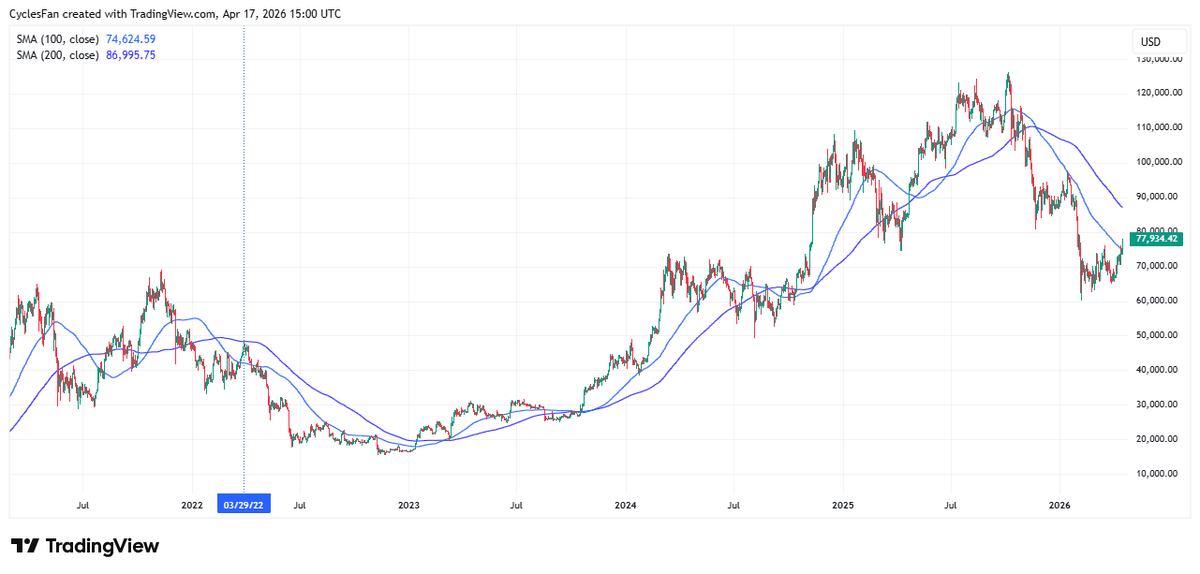
BTC Tops 100‑day MA, but 200‑day Target Remains
$BTC will close above its 100 day MA for the 1st time since October. Does it mean the bear market is over? Not in my view. In the 2022 bear market it had a 2 month bounce that topped just...

SMH Eyes $507 as Next Yearly Resistance Target
$SMH - Last week it closed above the 1st yearly resistance, so it was natural for the rally to continue this week. The target for the next intermediate term top is the 2nd yearly resistance at $507. https://t.co/zy5dZBLxZD

QQQ's 10-Day Rally Nearing Pullback Warning
$QQQ - 10th up day in a row. Closed above the 78.6% retracement of the recent downtrend. The next resistance is the ATH at 637. The 5 day RSI closed above 90. This happened only twice in the last 12...

Bitcoin's Third Failed Attempt to Reclaim 100‑day MA
$BTC - Today is the third attempt to regain the 100 day MA since late October and so far it is failing to do that again. https://t.co/738XHZDMWy

GOOGL Closes Above 20‑Week MA, Eyeing Q2 High
$GOOGL - Closed the week above the 20 week MA which confirmed that it made an intermediate term low 2 weeks ago at $272. The question is will it make a new all time high in Q2? We'll find out...

84% Chance S&P Hits New High, Yet 1966 Crash Warns
The odds of the S&P 500 making a new ATH in Q2 after retracing 75% of the downtrend are 84%, but beware the 1966 case which turned into a 23% crash into October. https://t.co/aV92MKXo9S

NVDA Above 20‑Week MA, Needs $197.63 Breakout
$NVDA - Closed the week above the 20 week MA which indicates that it may have made an intermediate term low last week, but that will be confirmed only if it breaks the pattern of lower highs and lower lows,...

MSFT Misses 200‑Week MA, Threatened by 345‑350 Support
$MSFT - Failed regaining the 200 week MA this week. Therefore, it's still at risk of dropping to the 345-350 major support range. https://t.co/9CSBJ5Taa5

META's 20% Two‑Week Surge Hits Intermediate Low
$META was up 19.81% over the last 2 weeks. This 2 week rally is on par with the 2 week 19.05% rally after the April 2025 low, which means that it probably made an intermediate term low 2 weeks ago....

AVGO Surges 18% to Break 20‑week MA
$AVGO was up 18.12% this week. It was the biggest up week since late November. It closed the week above the 20 week MA, confirming that it made an intermediate term low last week. We'll find out if it leads...

Amazon Spikes 13.6%, Tops 20‑week Moving Average
$AMZN was up 13.64% this week. It was the biggest up week since the bear market low in January 2023. It closed the week above the 20 week MA, confirming that it made an intermediate term low in February. We'll...

Bearish Engulfing Signals Potential Oil Top, Await Confirmation
$USOIL - The weekly bearish engulfing candle is further evidence to what I claimed since the March 9 top, that a major top was in. Technically, it hasn't been confirmed yet. That will happen only when the price of oil...

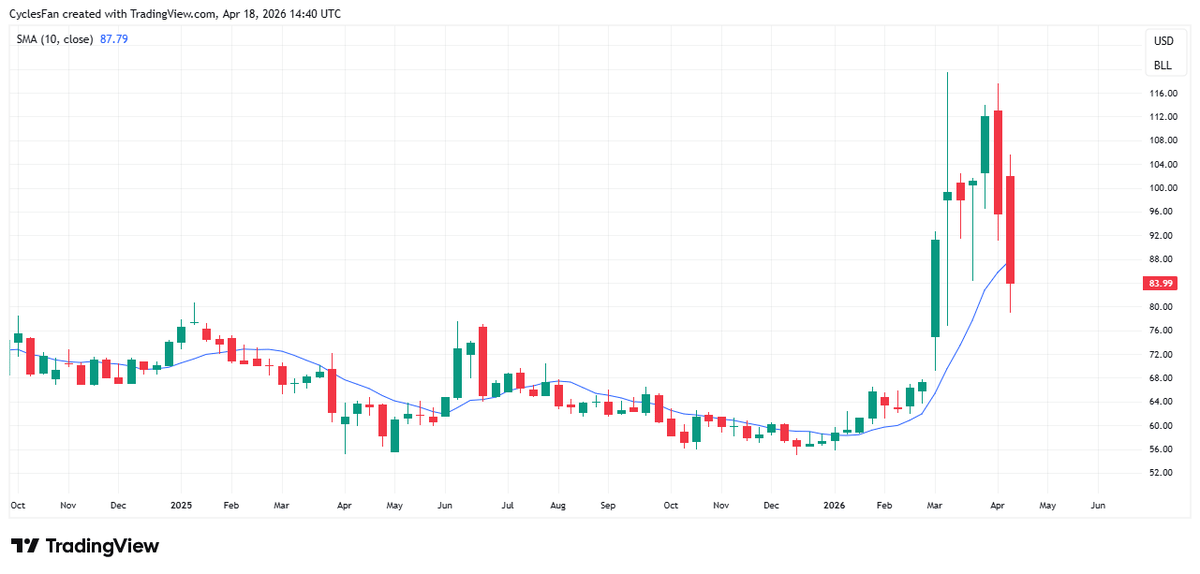
Silver Poised for Bounce to 88.84 Amid Bear Market
$Silver - The bounce out of the March low should continue into late April. The target could be as high as the 78.6% retracement of the March down leg at 88.84. Overall, it's just another bounce in a developing bear...

Gold Poised to Rise to 5028‑5280 by Late April
$Gold - The bounce out of the March low should continue into late April. The target is the 61.8%-78.6% retracement of the late January to late March downtrend at 5028-5280. https://t.co/YIo7oWw7FV

SPX Needs 6855 Breakout to Reach 7K
$SPX - Ended a 7 day up streak after almost reaching the 78.6% retracement of the late January to late March downtrned at 6855. The March 30 low was confirmed as an intermediate term low but it needs a close...

IGV Near Support; Below $74 Triggers Drop to $65
$IGV - Broke the major support at $76, but has reached the 62% retracement of the 2022-2025 bull market at $74, so it can't be ruled out that this is not a real breakdown. However, a close below $74 will...

PLTR Downtrend Minimal; Support Near $91
$PLTR - This is a log chart that shows how small the downtrend since November has been in comparison with the 3 year bull market that preceded it. There's no way the low for the year was made today. Minimal...

Bitcoin Must Break $75,970 to Avoid Q2 Low
$BTC - Still underperforming stocks. The stock indices have broken over their March 17 high, Bitcoin is still below it. In order to confirm an intermediate term low it has to close above the 100 day MA that is currently...
Rally Needs 90% Up-Volume or Advances—Absent Now
In order for today's stock market rally to be sustainable, in the absence of a Zweig Breadth thrust, we need a 90% up volume day or a 90% advances day on the NYSE. At the moment we have neither...
S&P 500's 200‑day MA Breach Fails to Spark New Highs
That's interesting. In all of these cases the S&P 500 was still in a longer term downtrend and did not make a new ATH following the close above the 200 day MA. https://t.co/THrRmHqWrG

Weekly Close Needed to Confirm SPX 200‑DMA Recovery
Saw a post from 10 hours ago: $SPX is back above the 200 day MA. It was a false breakdown. Even a close above the 200 DMA won't rule out a failed rally like March 2022 or a bear trap...
Zweig Bread
That is false. The last time the 10 day EMA of advancing issues was below 0.40 was on March 20, so the required 10 trading day window for getting a Zweig Breadth Thrust has already passed. There can be no...

S&P Near 200‑Day MA, Downward Move Expected
$SPX - 4th up day in a row and approaching the 200 day MA. The most likely scenario is hitting the 200 DMA and then turning down again for another down leg. Obviously, a ceasefire agreement with Iran will probably...

QQQ May Dip to 540 Before Confirming Bottom
$QQQ - The weekly low was 555 which is close to the yearly pivot but I doubt it has bottomed. If it keeps following the 2006 analogy which I posted about, the target would be 540, a retest of the...

Tesla's Seven‑week Slide Persists; 329 Support Target
$TSLA - Closed down for 7 weeks in a row but the downtrend isn't over yet. The target remains the 100 week MA that is currently at 329. Further downside will be invalidated only in case of a weekly close...

Twitter Fuels False Trump Health Rumors; Policy Overhaul Needed
Twitter has become the biggest online tool for spreading fake news. This is a video from Butler, Pennsylvania in July 2024 after Trump's assassination attempt. Twitter needs to change its policy ASAP and ban this lying retards. https://t.co/C9cBXe4EiN

RSI Near 2020 Lows, 2022 Scenario Likely, Target 6100‑6208
Reminder: Last week the 5 week RSI was nearly as oversold as in 2020 and 2025. While a V shaped bottom is not impossible, option 2 which is a May-June 2022 type of scenario is more likely here given the...

Apple Poised to Hold, Target 100‑week MA
$AAPL - The most bullish big tech stock this year. Hasn't made a new low for the year since January when it hit the yearly pivot at 243. I expect it to hit the 100 week MA that is currently...

MSFT Nears Support; Above 200‑Week MA Signals Low
$MSFT - Closed the week higher after nearing the major support zone at 345-350. A weekly close above the 200 week MA(379) will be a good initial signal of an intermediate term low being in. There's still risk of a...

Gold's January Candle Mirrors Past Peaks, Signaling Strength
$Gold - If you want more evidence that it made a major top in January take a look at the quarterly candle. Same candle as Q1 2008, Q3 2011 and Q3 2020. As you can see it doesn't mean gold...

SPX Below 10‑Month MA Signals Potential Further Decline
$SPX - Closed below the 10 month MA. Going back to 2009 3 cases didn't have any further downside or only marginal further downside: 2011, 2015 and 2023, but in 2011 and 2015 the drawdown had already been at least...

QQQ Mirrors 2006 Pattern, Bottom Likely in May
$QQQ - I've scanned past price patterns to compare it with the price action since the late October top and the year that has the highest correlation is 2006. If current action continues to follow the 2006 script QQQ will...

Bitcoin's Next Cycle Low May Set Yearly Low
$BTC - The next 11 week cycle low is due on the week of April 20-26. The only question is if the coming low will be higher or lower than the February low? Given that Bitcoin started to underperform stocks...

Record January Volume Signals Silver Top, 2029 Low
$SLV - The monthly volume in January was the highest volume ever. Such volume expansions happen only at major tops. After every major top silver declines into the next 7 year cycle low. The next 7YCL is due in late...

Silver Blow‑off Targets $28.31 Low by 2030
$Silver - Blow off moves in the past ended with a return to the origin of the blow off. In 1980 it was to the April 1978 low at 4.90. In 2011 it was to the February 2010 low at...

Gold's Bearish Engulfing Hints End of Bull Market
$Gold - The March candle was a bearish engulfing candle similar to September 2011. At the monthly low it hit the 10 month MA as it did in September 2011. The bull market may be over and gold could suffer...

Dollar Set to Rise Through 2027, Target 110?
$DXY monthly - Closed above the 10 month MA. The 3 year cycle low in January is confirmed. The rising phase of the previous 3 year cycles lasted at least 18 months, so the Dollar is likely to move higher...

SPX Bounces Above 10‑DMA, Still Needs 200‑DMA
$SPX - All previous bounces in March failed closing above the 10 DMA. Today's bounce succeeded so it may go higher but the key MA that has to be regained is the 200 DMA. Until that happens we're still in...

QQQ's 3.4% Surge Unlikely to End Downtrend
$QQQ - Up 3.4% today, the biggest up day since last May. Does it mean the downtrend is over? Not so fast. In order for it to be more than a one day bounce it has to get back above...

IGV May Confirm Double Bottom if Weekly Close Tops 82.90
$IGV - Potentially made a double bottom last week. In order to confirm that it made an intermediate term low on the last week of February it needs a weekly close above the 10 week MA that is currently at...

AVGO Holds Above 299 Pivot; Below Triggers 245 Target
$AVGO - So far in this downtrend it has held above the support of the yearly pivot at 299.60. If it closes the week below 299 the next downside target would be the 100 week MA that is currently at...

NVDA Faces Yearly Pivot at $161, Potential Drop to $147
$NVDA - As I posted last week it's headed to the yearly pivot at $161. If it closes below 161 at the end of next week the next downside target would be the 100 week MA that is currently at...

Tech Valuations Lag Growth, Set to Outperform Soon
The $NDX forward PE ratio has dropped to 21.09. In September 2022 it was at 18.96. The $SPX forward PE is at 20.53. We're approaching the point where tech will start outperforming again. It doesn't make sense for tech to...