
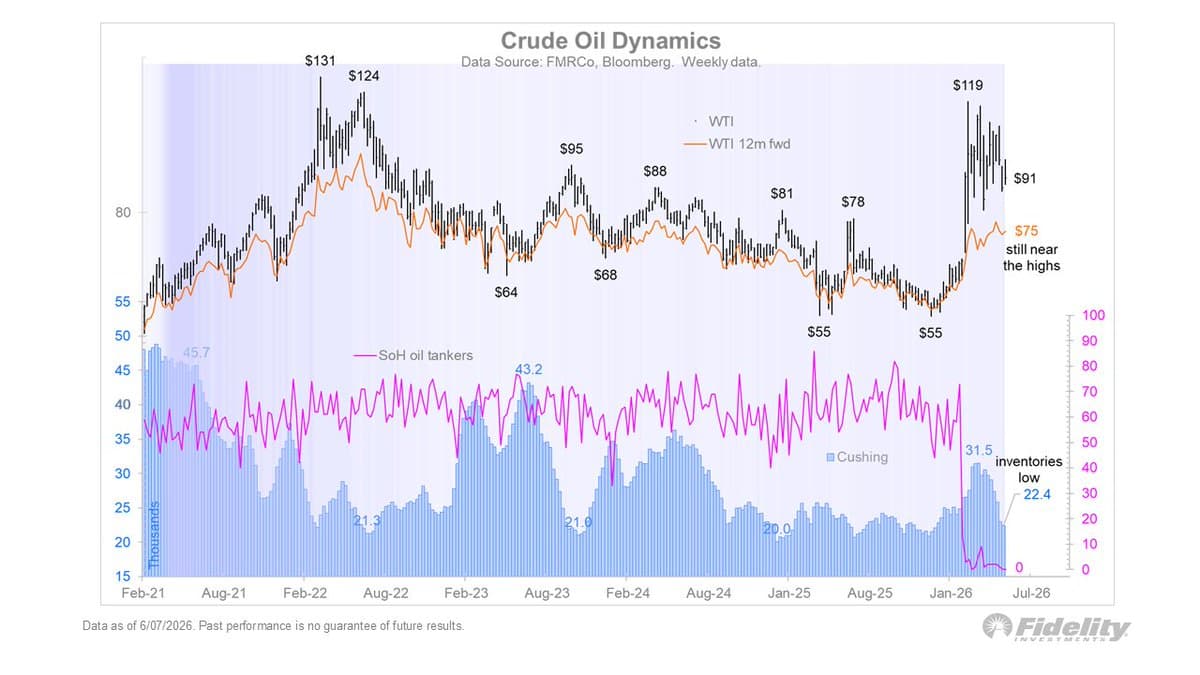
Iran Conflict Extends, Forward Prices Stay High, Inventories Drop
When the conflict in Iran began in late February, it was widely expected to last only a few weeks. Four months later, we can see that the 12-month forward contract remains near the highs, while inventories are falling. With no clear offramp, it’s a little surprising that the market has focused almost exclusively on the right tail.
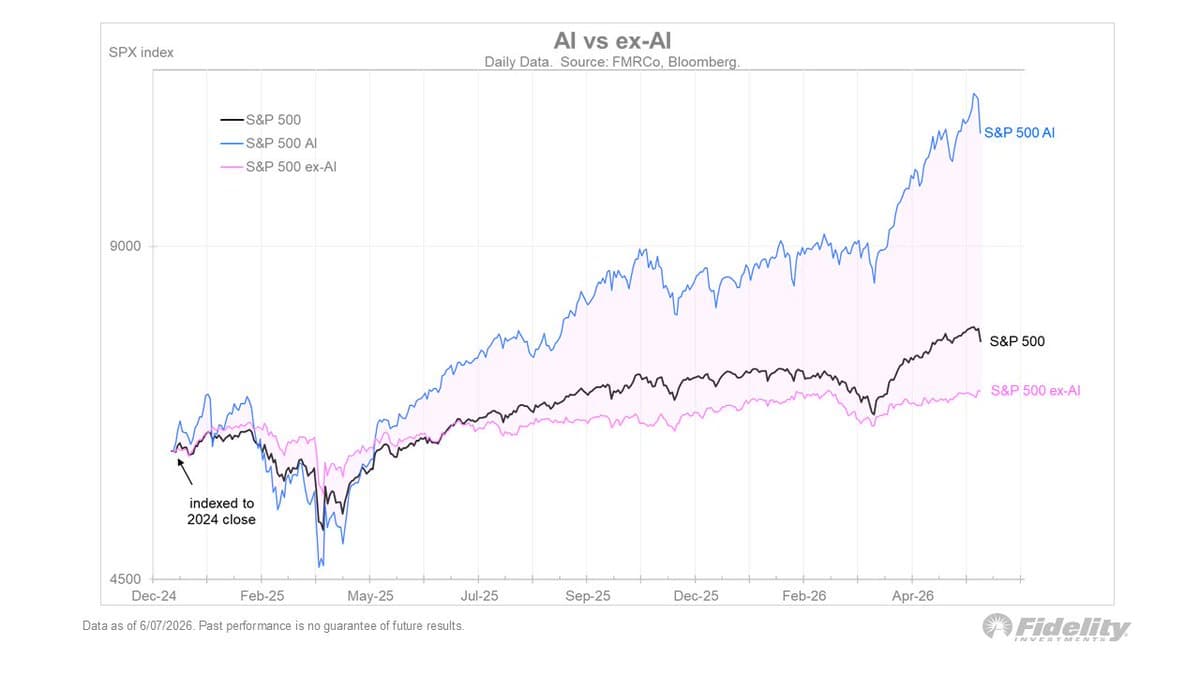
AI Drives Market Moves; Non‑AI Stays Resilient
We can see that the narrowing or broadening is really just an AI vs ex-AI dynamic. Excluding AI, the market has not even taken out the pre-Iran highs, although in recent days it has come close. On Friday when the SPX was...
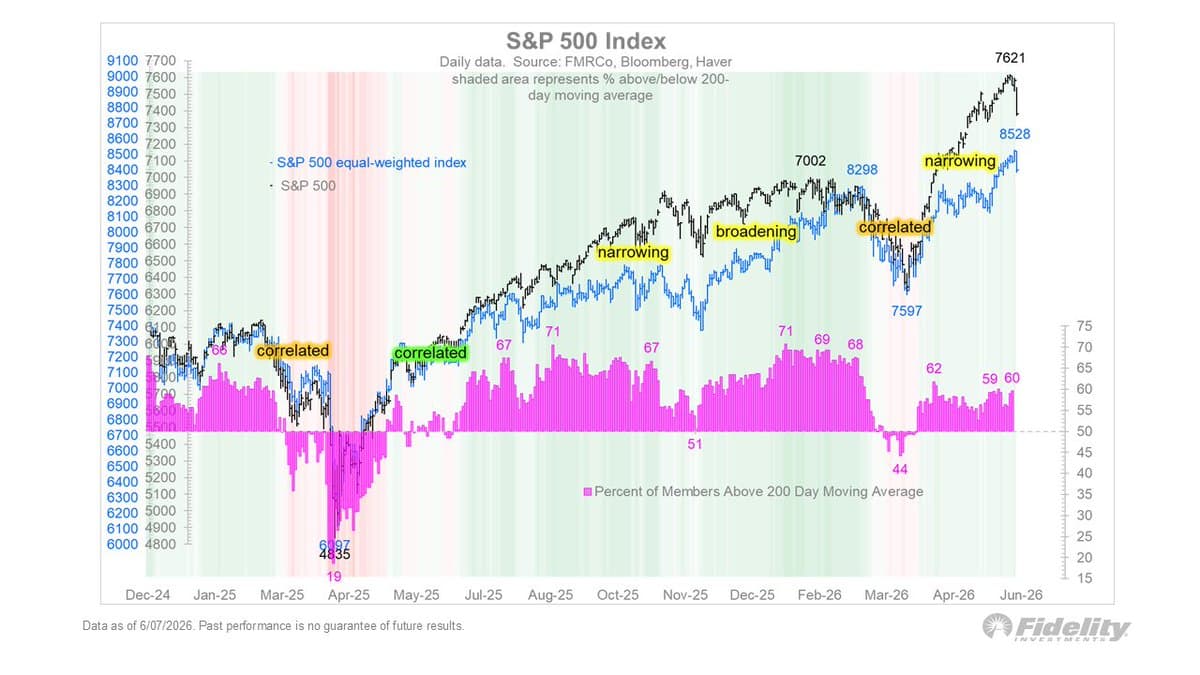
Market Narrows on Gains, Broadens on Losses
With the S&P 500 cap-weighted index down 2.6% on Friday and the equal-weighted index down 1.4%, it is clear that the market narrows on the way up and broadens on the way down as shown in the S&P 500 Index...
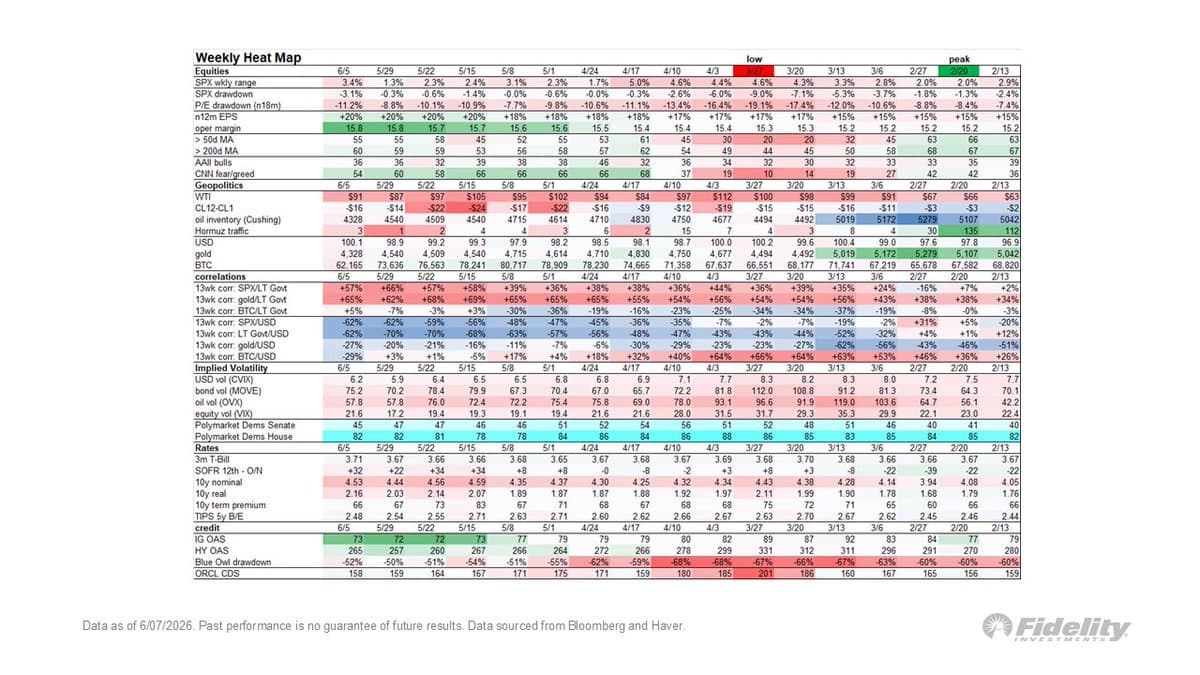
Yield Rise Meets Oil Surge, Market Bets on Quick Resolution
Looking at the heat map below 👇, we see that the right tail drivers of earnings (+20%), margins (15.8%) and credit spreads (73 bps) continue to propel the cyclical and secular bull market. But the left tail is perking up...

Hot Economy, Geopolitics Fuel Inflation, Threaten IPO Momentum
Last week’s momentum-filled gains were abruptly reversed on Friday after the jobs report showed that the US economy is running quite hot while there is still no easy offramp from the conflict in Iran. Add them up and we get...
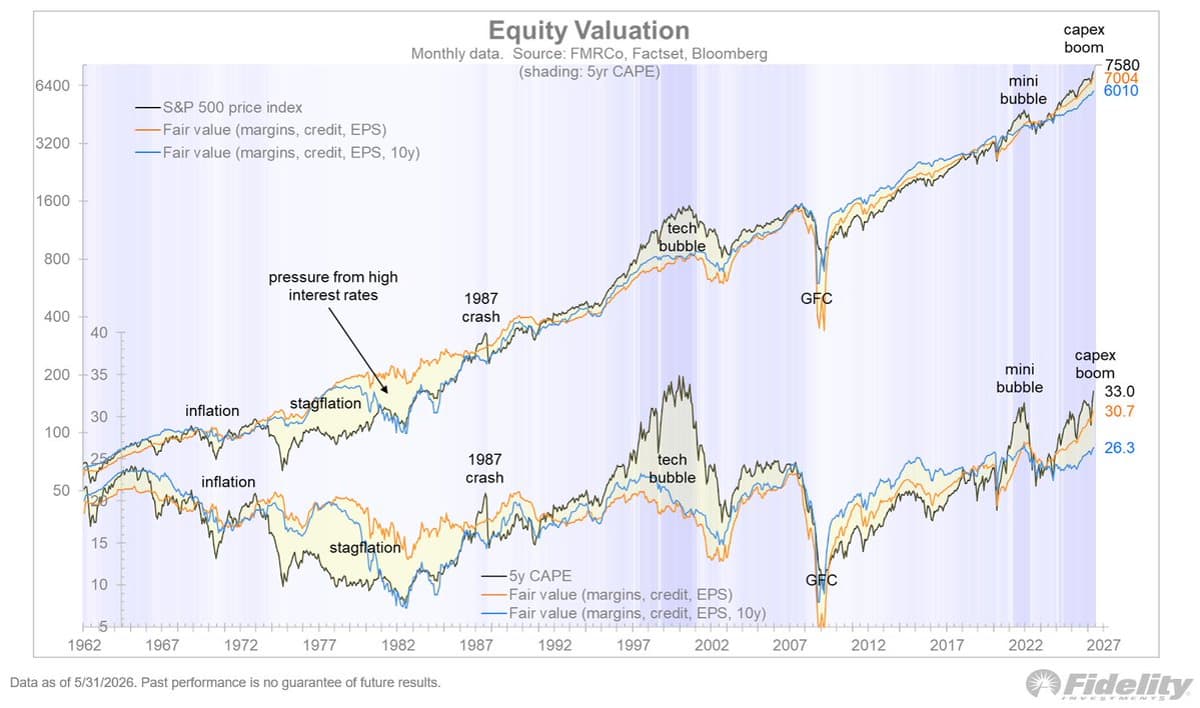
Bull Markets End on Bubbles or Inflation, Not Yet
Secular bull markets always end with a valuation reversal, either because they reach bubble levels unsupported by fundamentals (1929 and 2000) or because they get derated by inflation (1968). Whenever the current trend comes to an end (hopefully not...
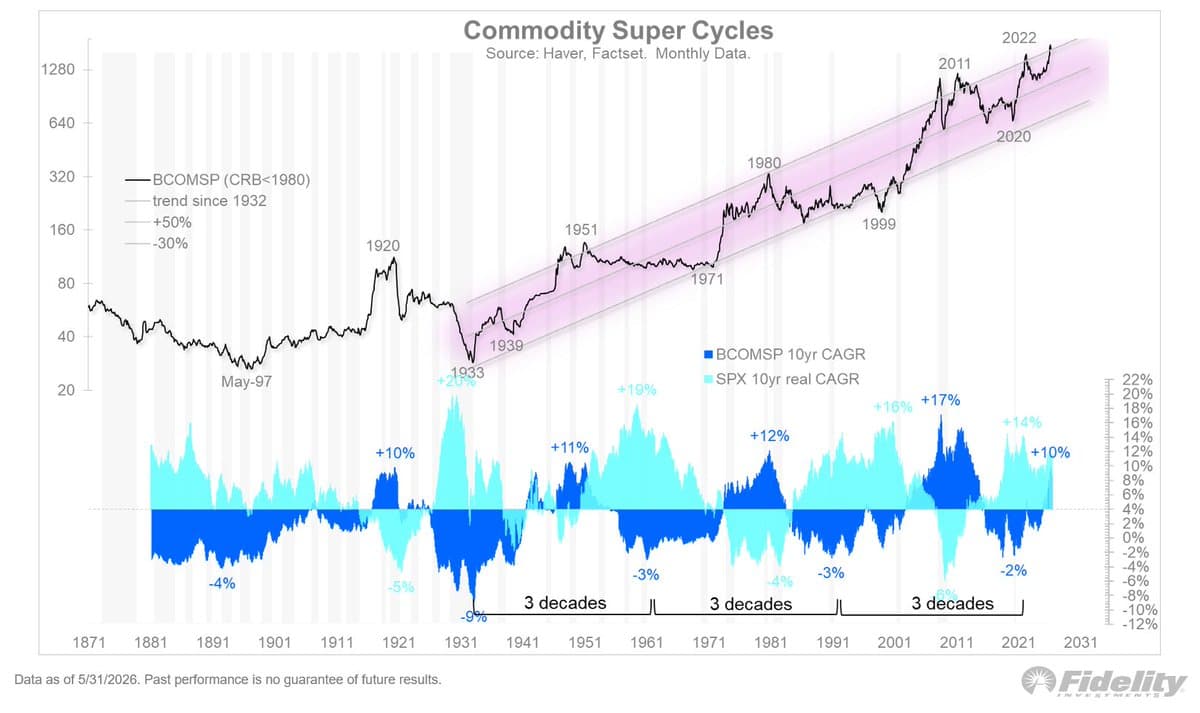
Commodity Surge Signals Early Warning for Equity Secular Trend
A boom-turned-bubble is one scenario for an end to the secular trend, but an inflation bust is another. Below in the Commodity Super Cycles chart we see that commodities appear to have entered another secular bull market of their own. What’s interesting...
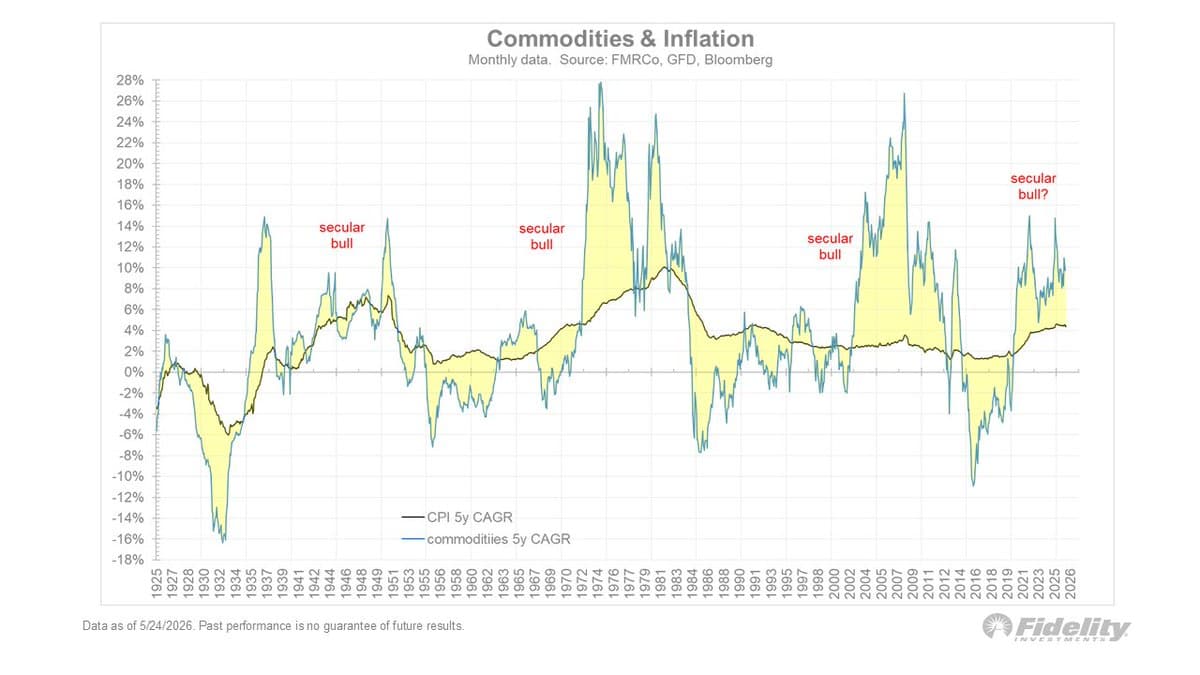
Commodity Trends Still Drive Inflation, Threaten Valuations
We know that inflation is less driven by commodity prices than in the past, but the chart below shows that goods inflation still matters. When the 5-year CAGR of the Bloomberg Commodity Spot Index is consistently above the 5-year inflation...
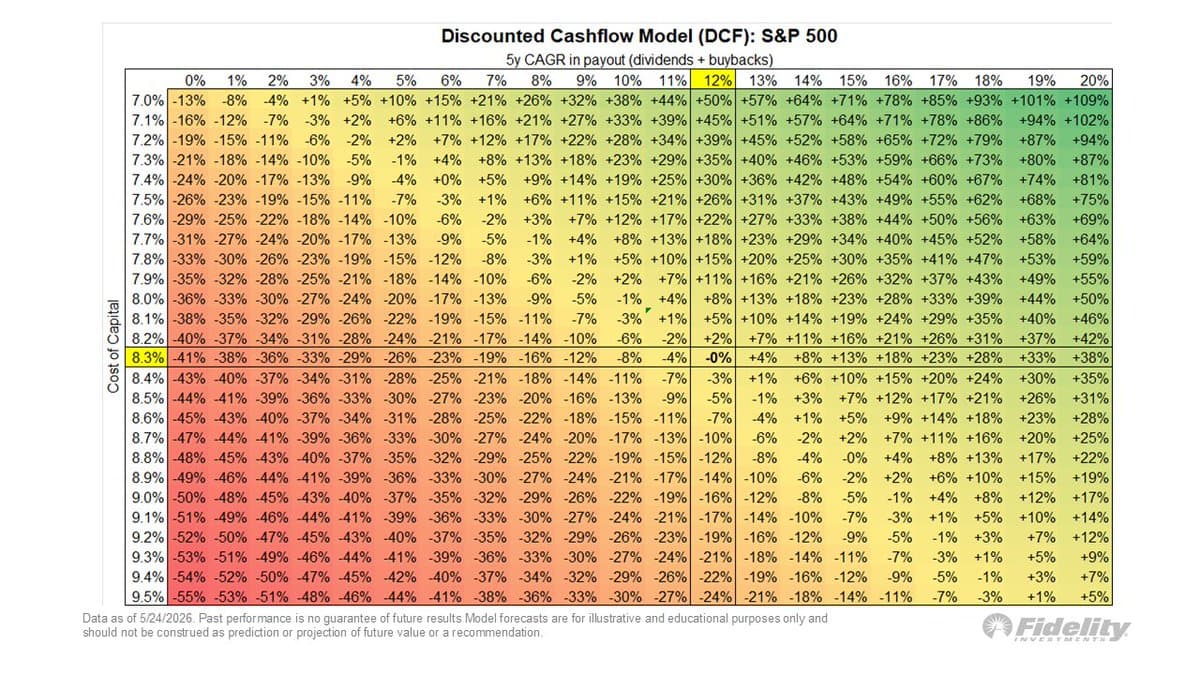
Rate Hikes Dwarf Earnings Growth in S&P Valuation
Another way of illustrating the offsetting forces between earnings growth and interest rates is via the Discounted Cash Flow Model (DCF): S&P 500 below. Currently, with 5-year payout CAGR of 12% the S&P 500 index is fairly valued at an...
Earnings Growth + Expanding P/E = Best Returns
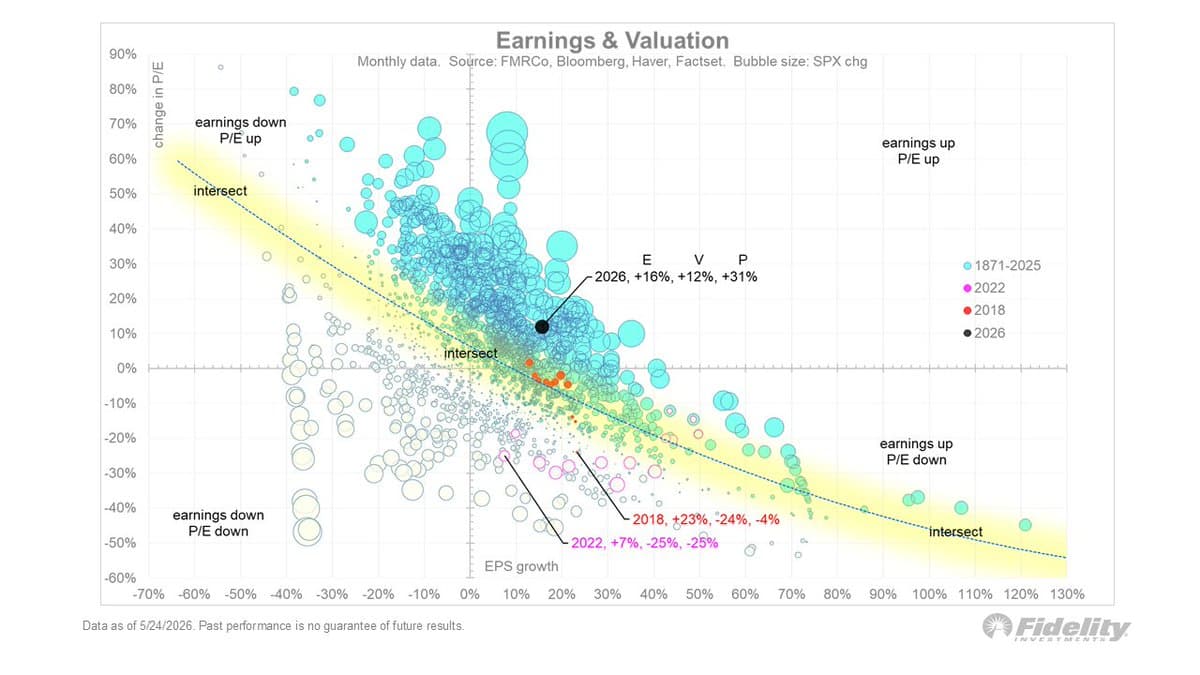
The somewhat cosmic looking Earnings & Valuation scatter plot below shows 150 years of stock market history. Along the horizontal axis is earnings growth and along the vertical axis is the annual change in the P/E-ratio. Together with dividends these...

Oil Supply Stress Keeps Yields High Amid Equity Recovery
P is the intercept between E and V It has now been 13 weeks since the Strait of Hormuz has been effectively closed, which is many weeks more than markets were pricing in at the time. While equities have recovered, bond...
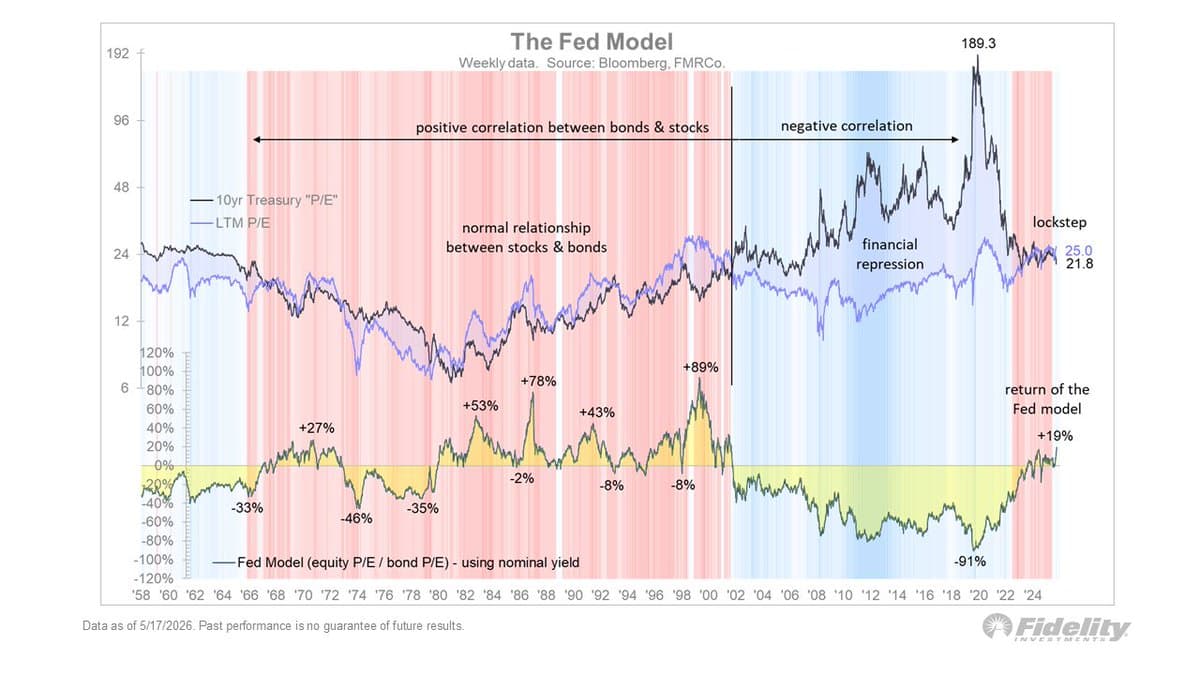
5% Yield Spike Could Trim S&P Valuation 15%
Per the Fed Model, when stocks and bonds are correlated and offer similar yields, when bonds reprice, so will equities. That’s the transmission link between rates and equities. If yields rise to 5%, how much would equities need to derate? Per...
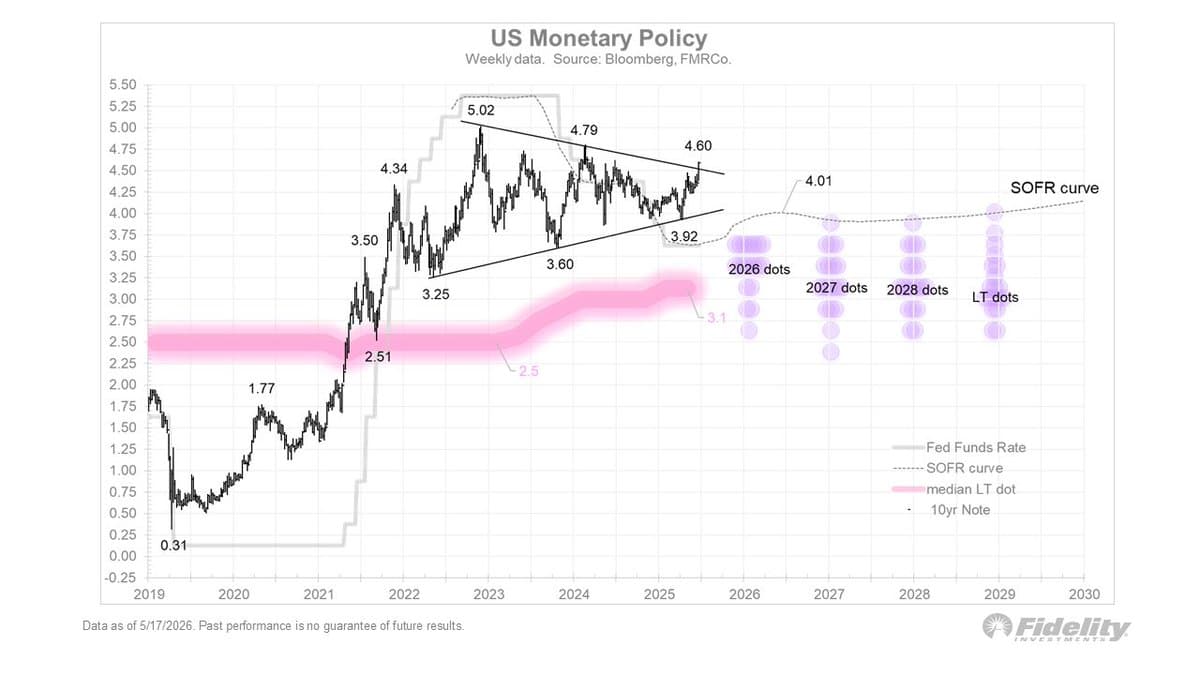
SOFR Curve Signals Rate Hike, New Fed Chair Tested
With the SOFR curve now pricing in a rate hike instead of the three rate cuts expected earlier this year, it seems like incoming Fed Chair Warsh will be tested by the market, as often happens with leadership changes. Will...
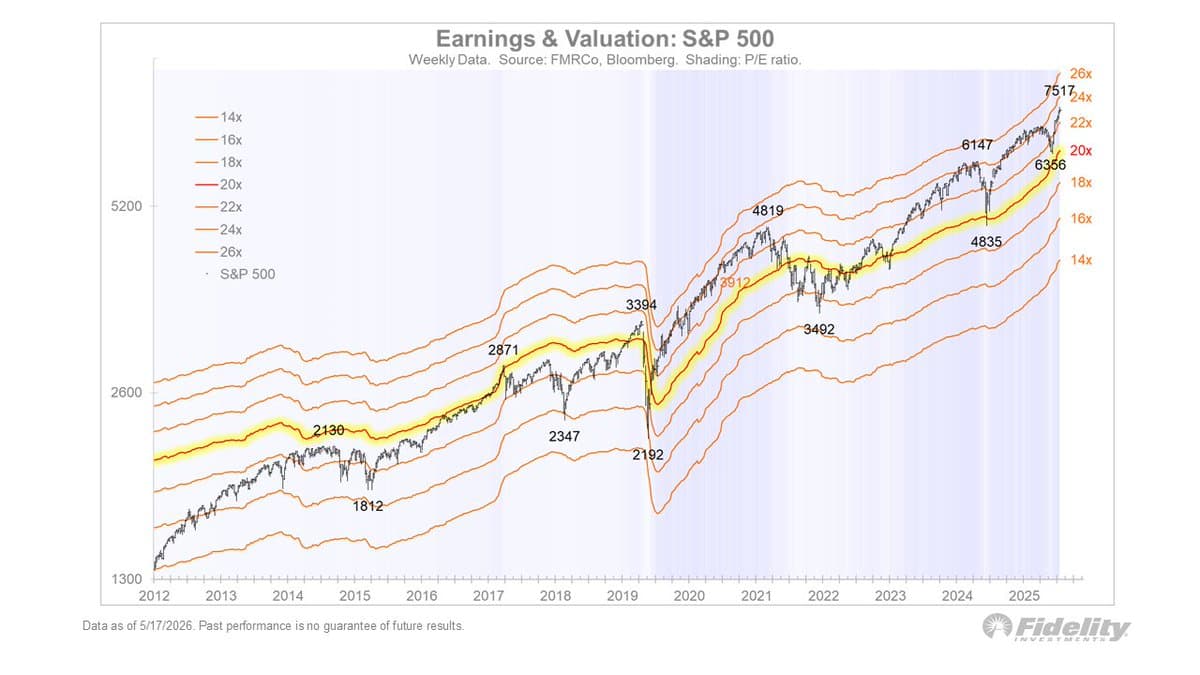
Forward P/E 20x Could Pull S&P to 6500
Below I show P/E bands based on the 12-month forward earnings estimates. If the forward P/E-multiple were to drop to 20x, that could push the S&P 500 index down to around 6500. Again, we have strong earnings tailwinds pushing those...
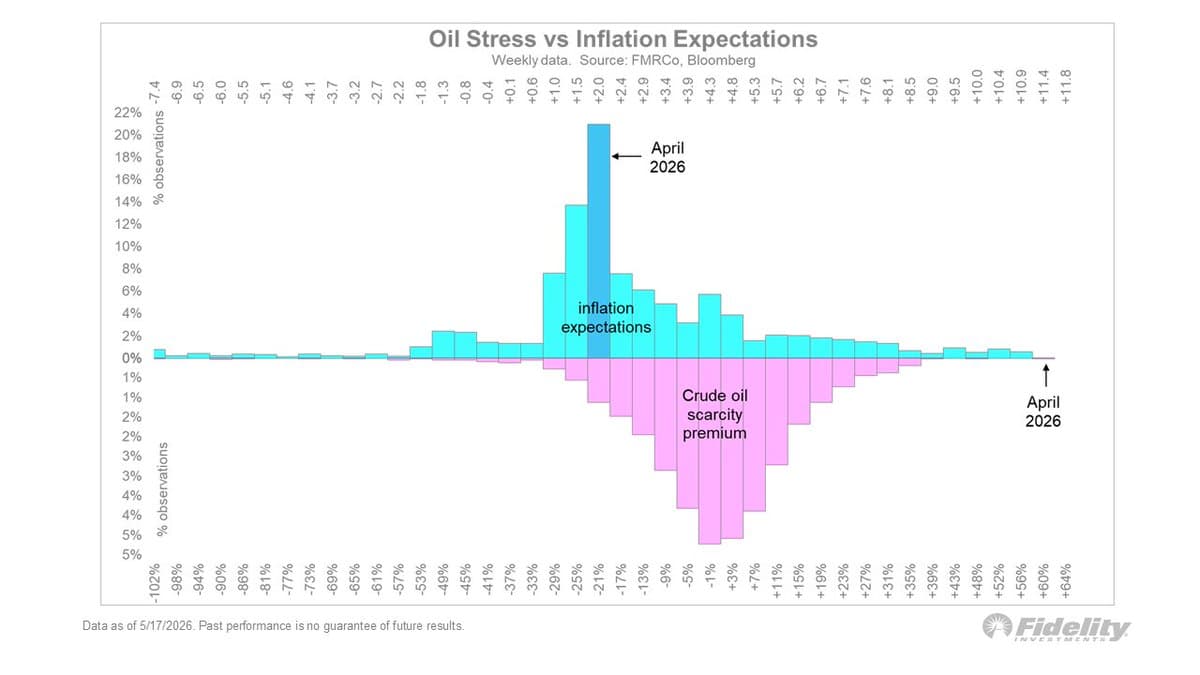
Bond Market Sticks to Mid‑2% Inflation Amid Peak Oil Stress
The Oil Stress vs Inflation Expectations chart below shows the distribution of inflation expectations (10-year TIPS break-even) at the top and the distribution of oil “stress” (the scarcity premium) at the bottom. The bond market apparently believes that inflation will...