
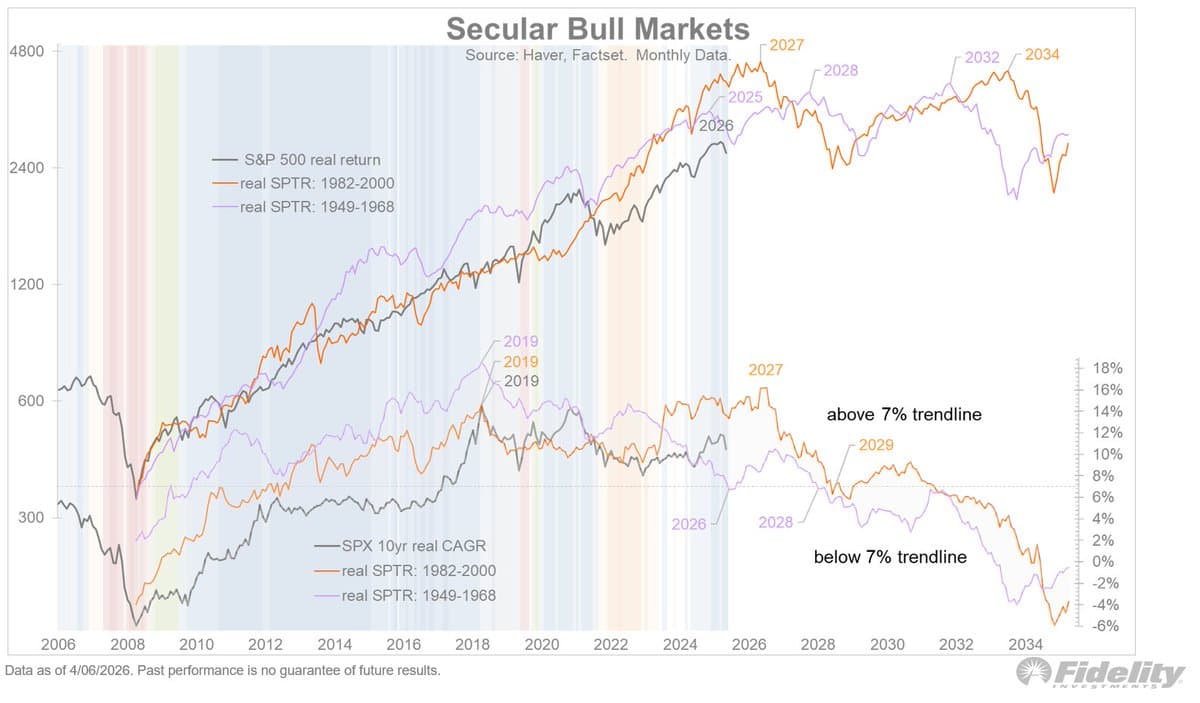
CAPE Model Predicts Weaker Future Returns Than Recent Bull Market
Confirming what the CAPE model suggests, the previous two secular bull markets (1949-1968 and 1982-2000) also suggest that future returns will not be as robust as the last decade-plus. https://t.co/aYe3ayil49
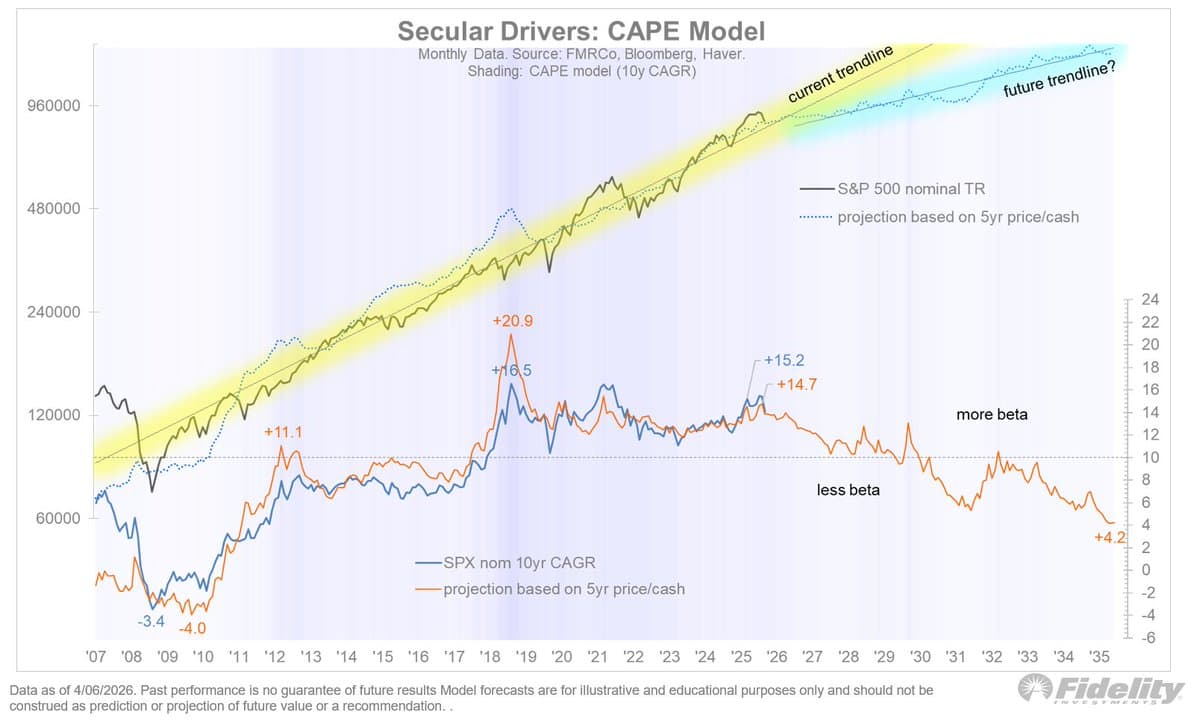
CAPE Predicts 10‑year Returns Slipping to Single Digits
However, the CAPE model (which holds that today’s 10-year P/E ratio determines the 10-year forward return) suggests that a secular peak may not be that far away. As scary as it sounds, all the CAPE model is predicting is that...
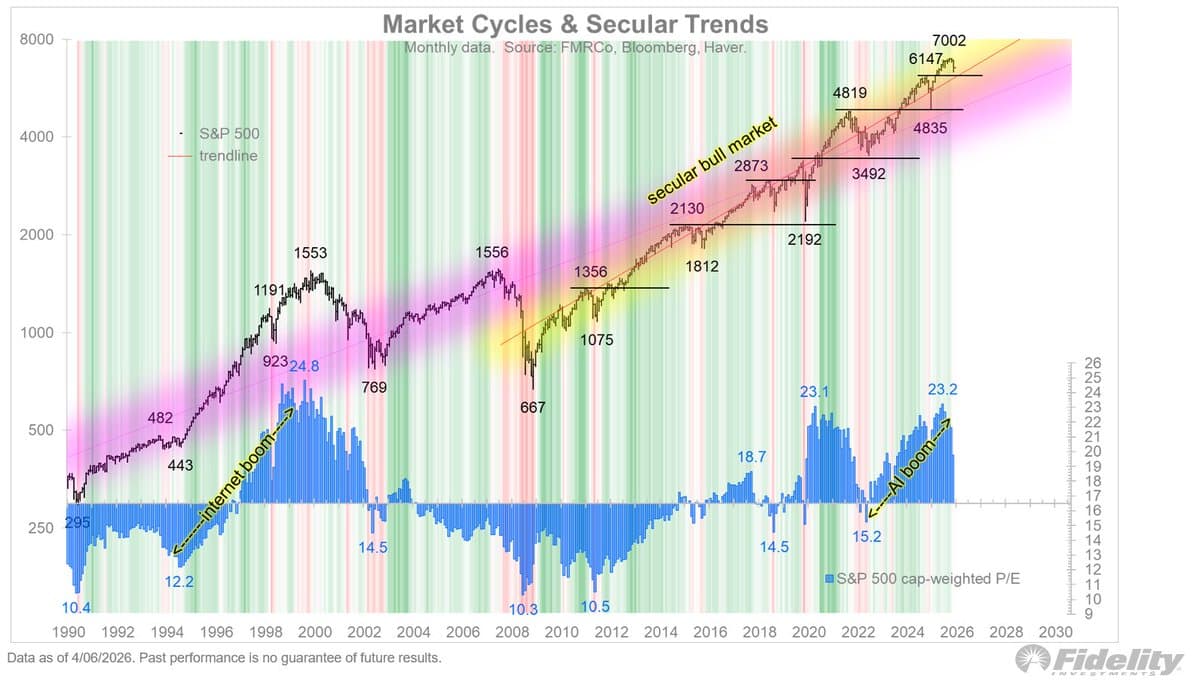
Secular Bull Market Persists, Setting Fresh Highs and Lows
The chart below shows that the secular bull market remains firmly in place, with a clear series of new highs and new lows. https://t.co/QhqNCfk4Bw

Bond P/E Triangle Signals Potential 4.5% Yield Spike
If we invert the 10-year bond yield we get a “P/E” ratio for bonds. The chart below shows that since the 2022 rate reset, the bond P/E has been stuck in a tight triangle. That triangle could be a base,...

Mag 7 Valuations Slip to 25x Forward P/E
Even the Mag 7 have come way down in terms of valuation, following their 17% drawdown since last October’s high. The cohort is now trading at a modest 25x forward P/E. https://t.co/EotkZU3iSu

S&P Equal‑Weighted Index Holds Trend, Forward P/E 18.2
Taking a longer look, we can see below that the S&P 500 equal-weighted index is right on its rising trendline, while the forward P/E ratio is at 18.2x. It’s hard to accuse the market of being over-extended, at least in...

Earnings Growth Drives Market Gains, Balancing Valuations
The forward earnings estimate has been growing at a robust 17% annual rate and the momentum has thus far not been affected by the headlines. This strength has beenenabling the cycle to become more balanced between valuation and earnings. As of...

S&P 500 Swings 4‑5% Weekly, P/E At
The S&P 500 index has continued to fluctuate in an elevated range (4-5% per week), as markets try to find their footing amid the conflicting headlines. The trailing P/E ratio is now 23.3x and the implied equity risk premium is...

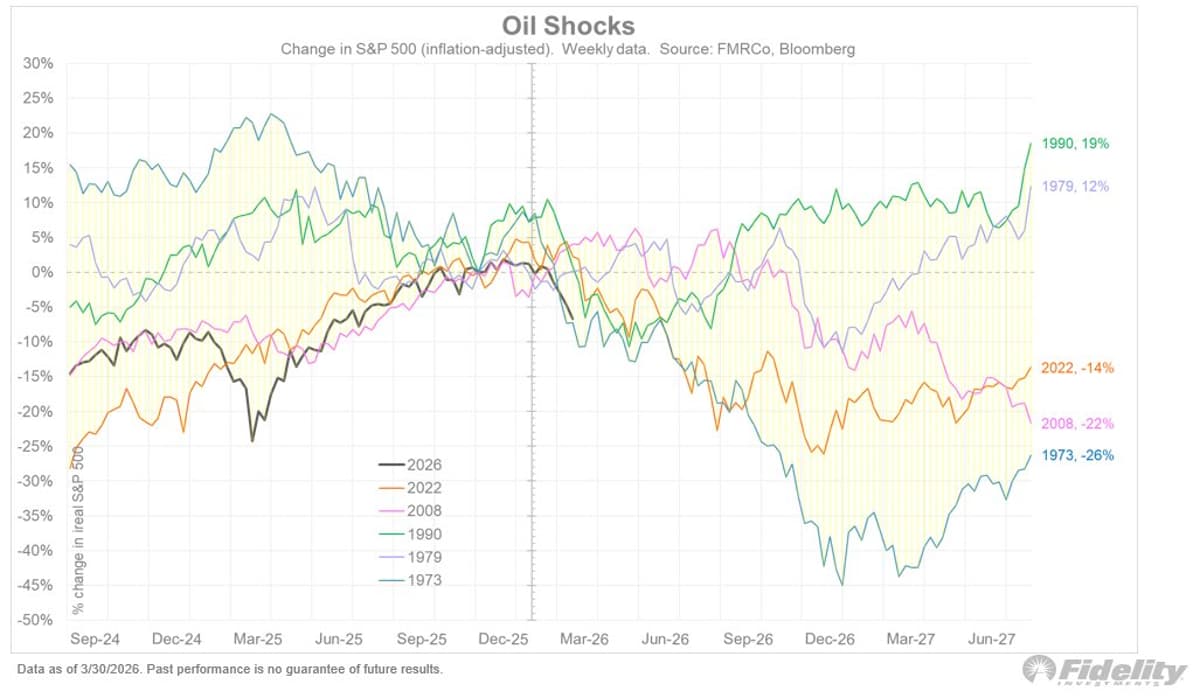
Earnings Shield Markets Amid Major Oil Shock History
The analog chart below shows the major oil events since the 1970’s. The green line (1990 Gulf War) remains the best-case scenario, namely a short war that produces a full roundtrip in crude oil. Even by 1990 standards, the stock market...

Oil Prices Near Double, WTI Hits $112, Brent $109
Crude oil finished the week at $112 (WTI) and $109 (Brent), making the current oil shock almost a double. https://t.co/7EKQWyQ7zM

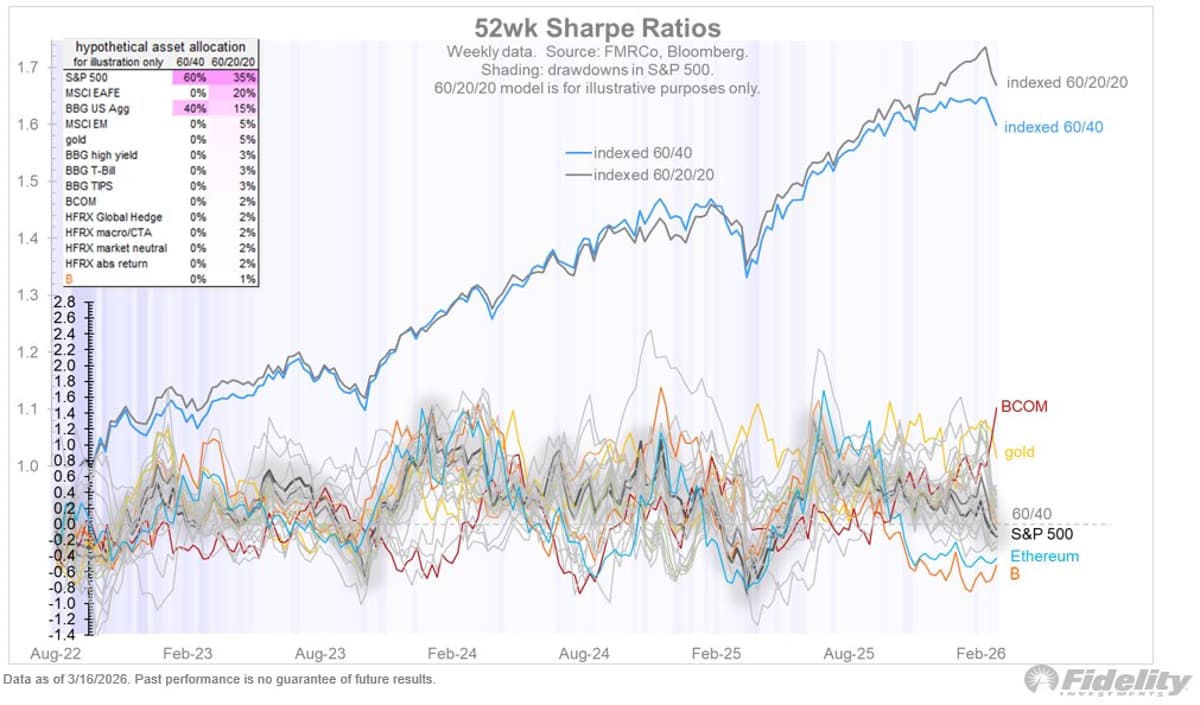
S&P 500 Trails Most Assets, only Bitcoin Worse
With month-end and quarter-end behind us, the S&P 500 was down 4.3% YTD (as of March 31). Only Bitcoin and large cap growth have done worse, at least for the cohort of asset classes that I follow. On top were...

Oil at $115, Backwardation Rises Amid Strait Uncertainty
Crude oil is now trading at $115 (as of Sunday night) while the forward curve has gotten even more backwardated. It’s unclear to me whether the backwardation is a manifestation of optimism over the Strait re-opening or the mechanics of...

Markets Calm as Middle East Tensions Ease, Bull Persists
Stress levels in the financial markets have subsided a bit as the conflict in the Middle East enters its 5th week. Bonds and equities (and their vols) have moderated as the number of ships passing through the Strait of Hormuz is ticking up...

Bitcoin Stabilizes $65‑70k, Forming Base After Winter
Bitcoin continues to hold on to the $65-$70k range as it is trying to form a base following its mild winter from $126k to $60k. The current level is supported by the technicals (previous highs) as well as the Bitcoin/gold...

Bitcoin and Gold Swap Roles as Flows Reverse
Below we can see that when Bitcoin peaked last October, the ETP flows left Bitcoin and jumped on the gold bandwagon. Now that gold has lost its mojo while Bitcoin is finding its footing, the flows have reversed. To me...

Gold’s Weakness Signals Buying Opportunity Amid Secular Uptrend
Gold has been surprisingly weak lately and has not acted in line with what one might expect during a geopolitical shock. My sense is that this is combination of a sentiment reversal among the fast money crowd (which had jumped...

Gold‑Bitcoin Momentum Converges, Undermining 60/20
My 60/20/20 model has not been spared by the current risk-off episode, as weakness in gold and international equities have offset any benefit from my underweight to bonds. Looking at the momentum curves below, it looks like the “jaws” between...

Dollar's Rise Tied to US Rates, Near 100 Resistance
With rate cuts being priced out of the market, the dollar index has strengthened from 95.6 to 100.5. I think the dollar’s recent strength has more to do with US rates than with geopolitics, and my guess is that the...

Fed Model Returns: Rates Matching Equities Threaten Stocks
One of my main themes since the rate reset in 2022 is that the Fed model is “back.” The Fed model, popularized by Alan Greenspan during the 1980’s, holds that when the risk-free rate (Treasuries) is competitive with risky assets...

10‑Year Yield
Another big development last week was that the 10-year Treasury yield rose sharply to 4.48%. The chart below shows that the yield has continued to coil in a large triangle, and could be on the verge of a break-out. Meanwhile,...

Earnings Estimates Surge 19% Amid 9% Market Drop
For me the most interesting thing last week was that earnings estimates not only held up despite the turmoil, but accelerated higher. The 52-week rate of change for the 12-month forward EPS estimate is now up to 19% despite the...

Stocks Above 50‑Day Avg Rise, Hinting Near Low
Technicians know to look not only for oversold extremes but also divergences, such as credit spreads making a lower high while equity indices make lower lows. So far, we are not seeing those. One glimmer of hope, at least over the...

Market Nears Support, Yet No Oversold Signals
How far do we go down? No one knows of course, but the weekly chart shows that we are approaching the previous peak of 6127. That should act as support, as well as the rising trendline. However, the percentage of...

Mag 7 Slump Drags S&P; Breadth Still Not
The Mag 7 are now leading the way down, which means that the cap-weighted S&P 500 is following suit. The M7 peaked last October and is down 17% from that high. That’s almost twice as much as the S&P 500....

Market Stress Unites Cap and Equal‑Weighted S&P 500
During times of market stress, correlations tend to converge to 1, and that is the case now within the equity markets. The chart below shows that the S&P 500 cap-weighted index is suffering the same fate as the equal-weighted index....

Market Oversold Yet Fundamentals Strengthen with 4.5% ERP
The matrix below shows that the market is oversold, but not to the extremes that has led to low risk contrarian plays in the past. With the P/E ratio down twice as much as price, the fundamentals are looking better...
Equities Drop 10% Amid Oil Shock Uncertainty
Equities have been following the “oil shock” script for now, with the major global averages down around 10%. From here, things will depend on whether this turns out to be a quick 1990 Gulf War spike or a longer shock...

Oil Futures Slip Into Backwardation as Hormuz Bottleneck Persists
With the Hormuz Strait all but closed, the crude oil futures curve is back to the backwardation levels of the first few days of the conflict. The front contract is about $23 higher than the 9th contract, indicating that the...

Gold and Treasuries Funding Liquidity Amid Oil Backwardation
With only one ship passing through the Strait last week, the oil curve has remained heavily backwardated. Looking at the correlations below, we see that gold and bonds have been positively correlated (with both under pressure), and Bitcoin and the...

Volatility Indexes Stay Elevated, Market Stressed Despite Credit Relief
Volatility indices across the spectrum have continued to remain elevated, from oil (OVX) to stocks (VIX) to bonds (MOVE). The market has remained in a state of stress, even as the drawdowns in the private credit leaders have moderated. https://t.co/iWYDR6GvD2

Rising Rates and Concentration Risk Drive Market Pullback
With the headlines lurching from one end to another, it’s not getting any easier to find clarity on how or when the conflict in the Middle East will end or what damage the ongoing Hormuz bottleneck will inflict on the...

Turn Corrections Into Liquidity: Gold, Bitcoin, Equities Rise
With stocks and bonds positively correlated again (but in the wrong direction), there’s a bit of 2022 déjà vu right now. Back in 2022 as the cost of capital reset after years of ultra-low rates, the 60/40 model broke down...

AI Boom Persists Despite Market Stress, Not a Bubble
The Mag 7 notwithstanding, the AI playbook (led by memory stocks and data centers, with software lagging behind) has not been materially impacted by the stress in the broader market. To me this strongly suggests that the AI boom continues...

Mag 7 Correction Boosts Near‑term Earnings Appeal
The Mag 7 has continued to be supported by strong earnings growth, and in the chart below one could make a compelling case that the M7 have corrected enough, as the price index has gone from hugging the earnings forecast...

Mega‑Cap Weakness Pulls Index Below Long‑Term Range
Last week the Mag 7 broke below its well-defined trading range, which had been in place since last October. As I have often written, in a concentrated market, as go the mega caps, so goes the index. That is now...

Both Indices Still Bullish, EW Hits 2025 Support
Technically, both the cap-weighted and equal-weighted indices remain in their cyclical bull markets, which started some 41 months ago in October 2022. We still have higher highs and higher lows, which are the very definition of an uptrend. Both indices...

Earnings Growth Offsets Falling P/E, Signals Healthy Market
If that reset continues, we could get a 2022 “echo,” in which equities correct entirely on the basis of falling P/E’s, while earnings continue to grow. Remember that stock prices are driven not only by earnings and payouts but also...

Yield Spikes Signal Worldwide Reset, Not US‑only Trend
It may be tempting to think that the rise in yields is the product of a US-centric dynamic (relating to OPEC recycling no/fewer petrodollars into Treasuries), but the next chart shows that yields are rising everywhere. This is global reset,...

10-Year Yield Near Critical Triangle Breakout Threatening Markets
While the 10-year yield broke out of a short term range, the weekly chart below still shows bonds holding within a long triangle (in place since 2022). If it breaks, it will be a problem not only for bonds but...

Yield Spike Near 4.5% Signals Market Trouble
Long yields broke out last week and finished the week at 4.39%. As I have written many times, nothing good happens above 4.5% when the risk-free rate is competitive with risky assets, as is now the case. https://t.co/mq0q2S2nBU

Brent Stays >$100, WTI Under $100 Amid Strait Closure
While WTI has remained just under $100barrel, Brent has remained well above $100 as it is more dependent on the Strait. Per the bottom panel below, the backwardation of the forward curve has continued to sit around $20/barrel as the...

S&P Nears Selling Climax Amid Deep Valuation Drop
In the table below, we see that the drawdown in the S&P 500 has now reached 7.6%, with breadth reaching moderately oversold levels. That drawdown masks a far bigger decline in valuations, with the trailing P/E down 20%. The MSCI EAFE and...

Yields, Bitcoin Up; Risk Assets Down—Macro Puzzle
What does it all mean? Why are yields and Bitcoin higher while risk assets are down and the dollar is bid? I take you back to the correlation matrix (below). Is it all just technical or is there a larger...
Bitcoin, Ethereum Z‑Scores Rebound as Other Assets Falter
Bitcoin has been very resilient in recent weeks, and we can see below how the 52-week Z-score has been recovering (along with ETH) while the rest of the asset class spectrum has been weakening. The outlier there of course...

UK 10‑Year Gilt Near 2022 High as Yields Rise
At the back of the yield curve, yields are moving higher across the board, and the UK 10-year GILT yield is testing the cycle highs from 2022. UK and US yields generally move in similar fashion, so this is something...

High‑Yield Spreads Break Out of Historic Range
The chart below shows that high yield spreads appear to have broken out of its longstanding range. https://t.co/XDtyd2lmpz

Rate‑cut Hopes Fade as Credit Spreads Widen Dramatically
The heatmap below shows that expectations of further rate cuts have all but vanished. Meanwhile, stress in the credit markets continues to mount with both investment grade and high yield spreads making new wides, and the private credit sensitive equities...

Cap‑Weighted Index Overvalued; Equal‑Weighted Remains Fairly Priced
For the cap-weighted index, price has remained quite elevated and well above the rising uptrend line. While the trailing P/E ratio has contracted from 26.1x to 23.9x, it remains elevated. The equal-weighted index is far less extended against its rising trendline,...

Mag 7 Holds; Break Lows Threaten Broader Market
My focus continues to be on the Mag 7, which has remained in its narrow range since last October. Should we break the lows, the broader indices will be at risk of a deeper correction. https://t.co/DCwPOyMXCH

Modest S&P Drawdown Leaves Market Vulnerable to War Mis‑read
The heatmap below shows that the drawdown for the S&P 500 remains modest at -5.4%. The market is only modestly oversold with 32% of stocks above their 50-day moving average. Sentiment is mixed and both earnings expectations and margins remain...