
Energy Crisis Threatens Inflation, Rate Cuts, Yields Near 5%
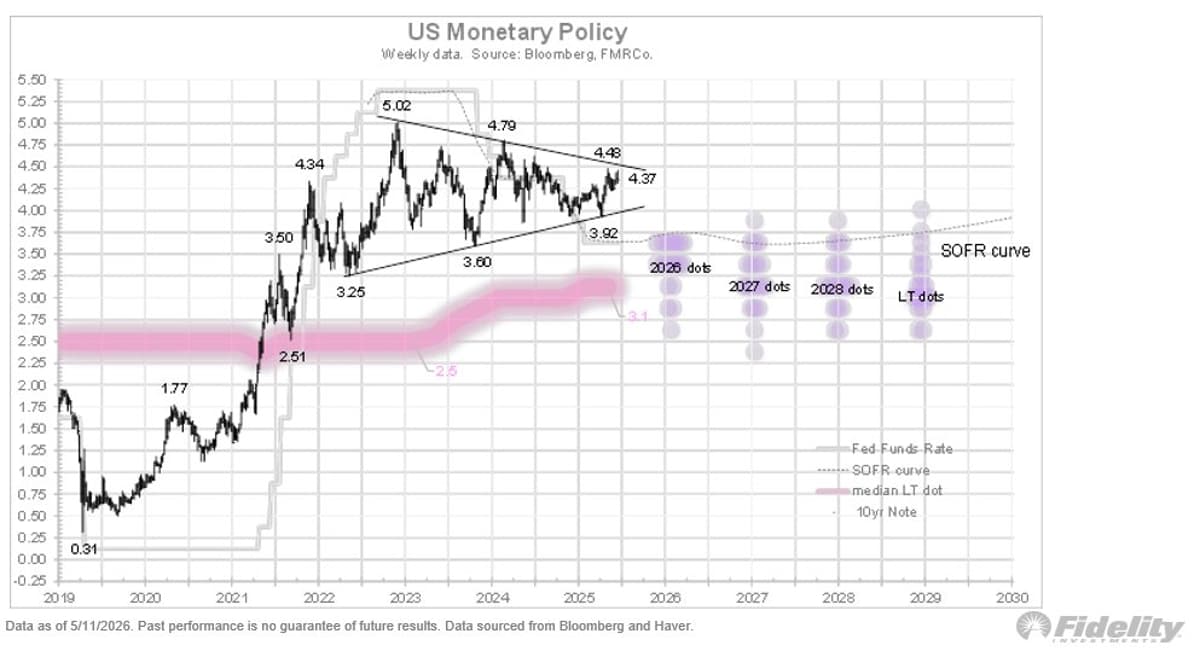
The risk to this rosy scenario remains a prolonged energy crisis that feeds through the broader economy via elevated structural inflation, which in turn could undermine the Treasury-Fed’s strategy of dropping short rates, while driving bond yields into the danger zone of 4.5-5.0%. For now, everything is calm, but at 4.35% we are not far. The energy markets have stabilized a bit, but remain stressed and backwardated. With every passing week, inventories get closer to the danger zone. For now, the conflict in the Strait continues.
10-Year Yield Above 4.5% Signals Trouble Ahead
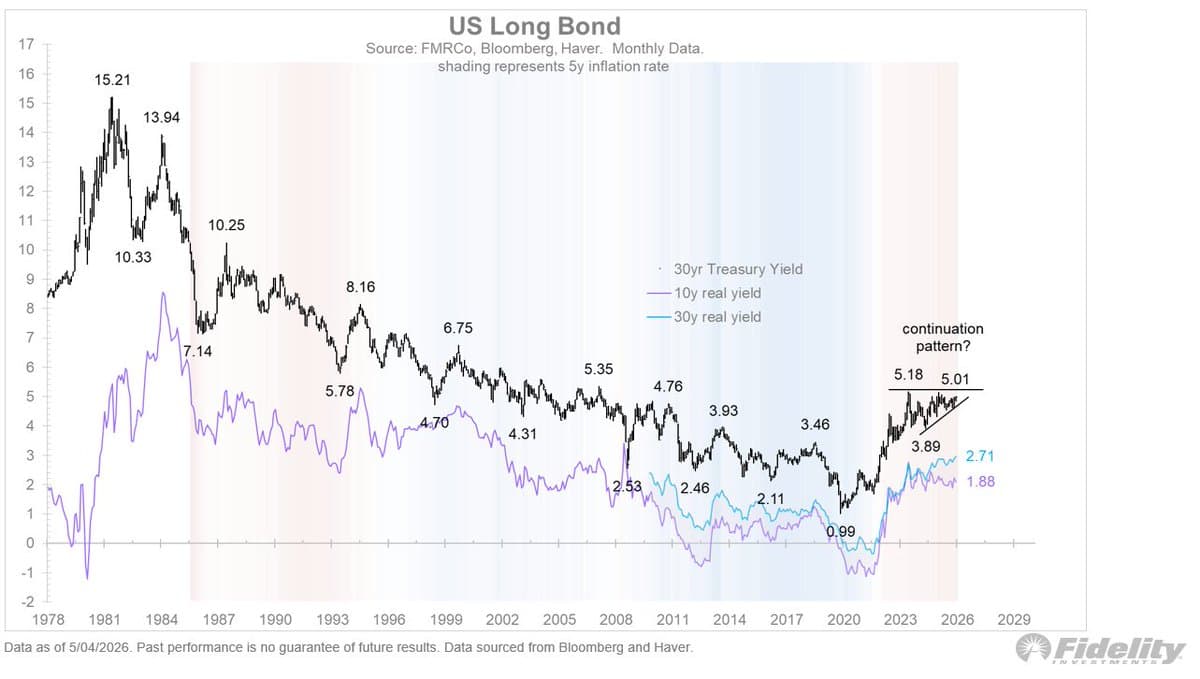
All this may be happening when the long bond is coiling inside what looks like a bearish continuation pattern. Real rates are rising, as are inflation expectations via the TIPS market. Remember: nothing good happens above 4.5% (for the 10-year)....
Oil Spike May Force Fed Rate Hike, Defying Playbook
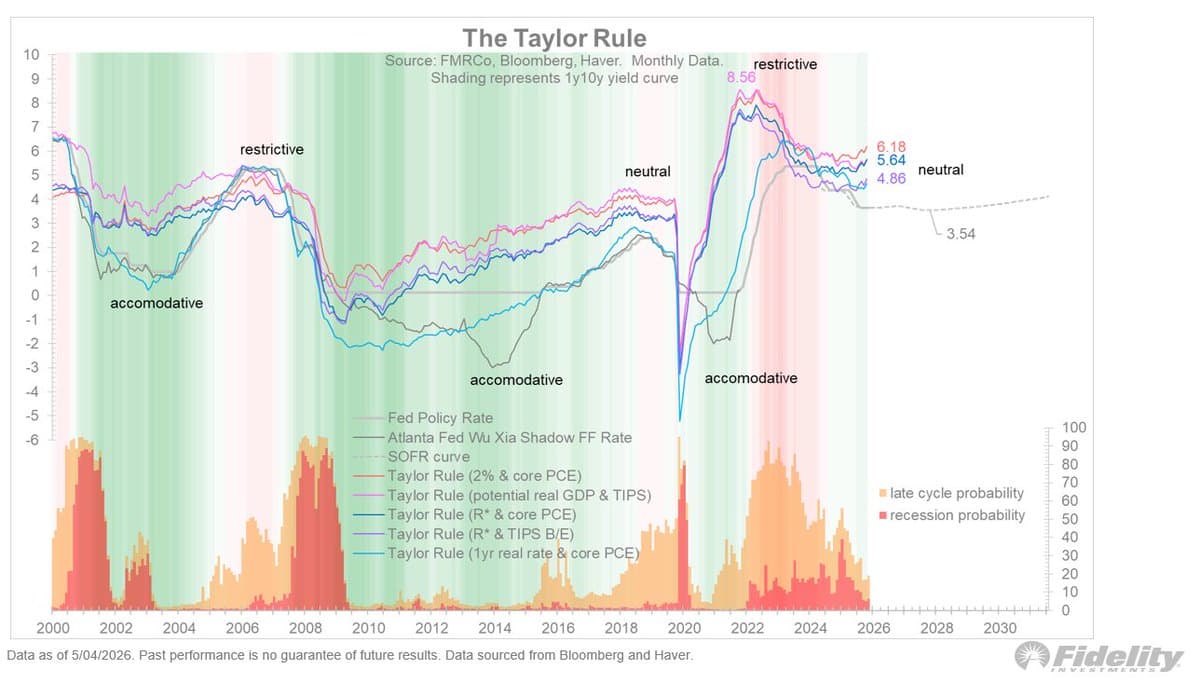
For the Fed and incoming Chair Warsh, a left tail oil spike could throw sand into the gears of the emerging Warsh-Bessent playbook of lower short rates and easier debt financing. In fact, my various interpretations of the Taylor Rule...
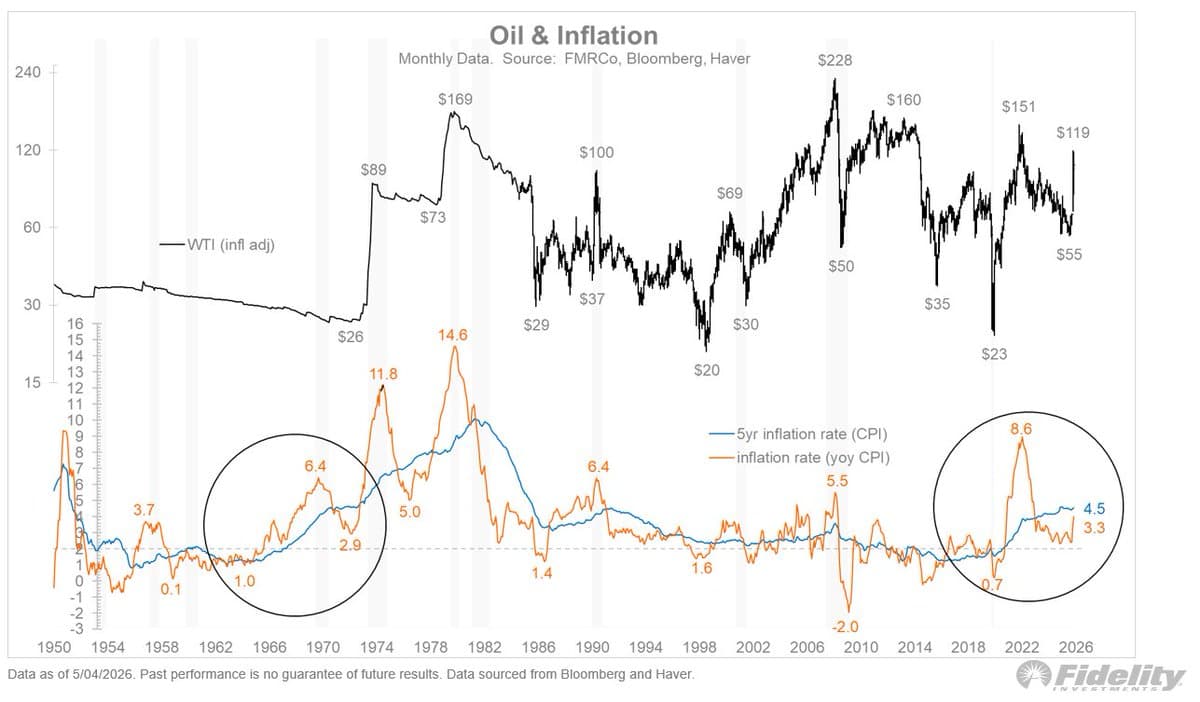
Higher‑base Inflation Risk Echoes 1970s Oil Shock
If this left tail manifests, it would happen at the worst time from an inflation perspective. Since the 9% COVID spike in 2022, the inflation rate has settled down to 3%. That’s better than 9% but it’s not the Fed’s...
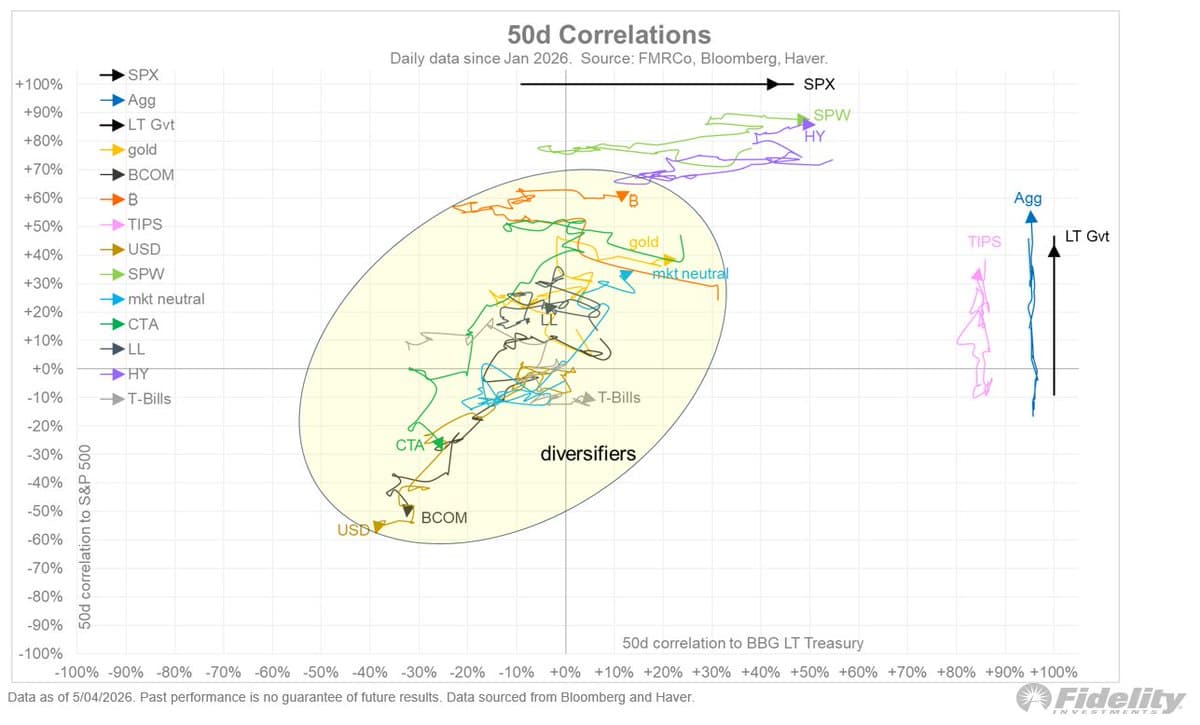
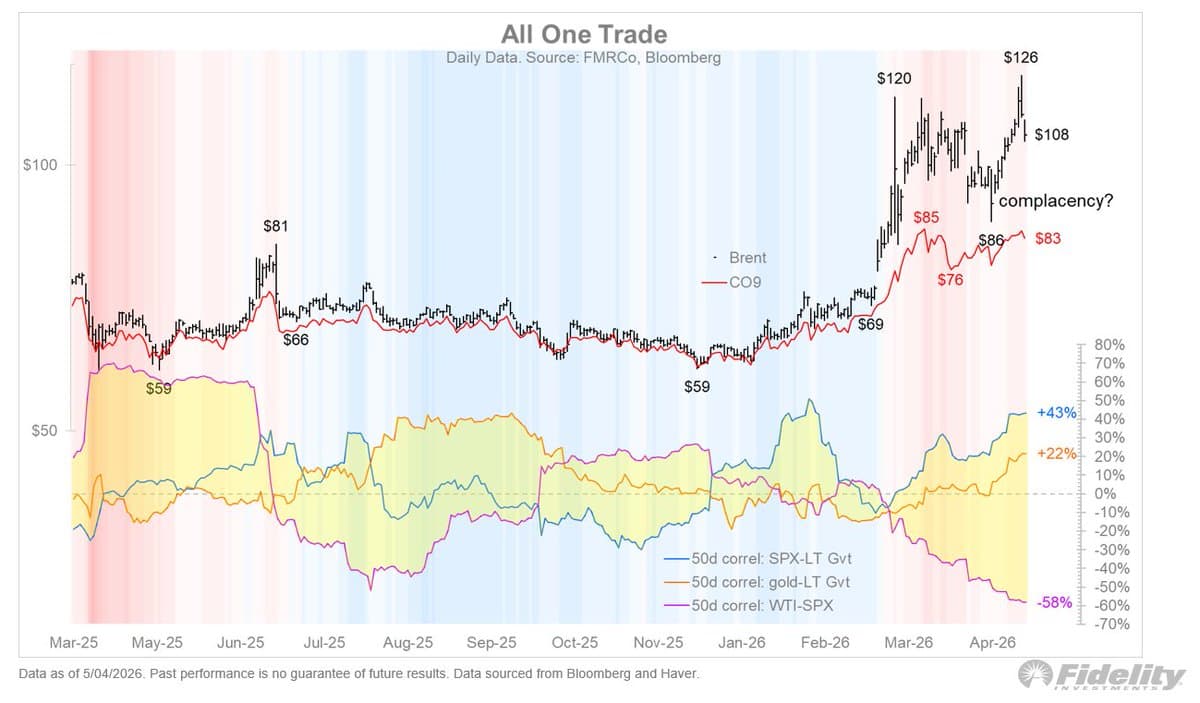
Commodities and Futures Shine as Stocks‑Bonds Correlate
Fortunately we are now in the 60/20/20 era and there are places to hide. The scatterplot below shows that as stocks and bonds become more positively correlated to each other (per the two black lines), some of the diversifiers (especially...
Rising Oil Forwards Threaten 60/40 Portfolio Stability
What if this condition lasts longer than the market assumes? What if it’s not the spot price that is too high but the forwards that are too low? If this left tail risk manifests, it could have far reaching implications...
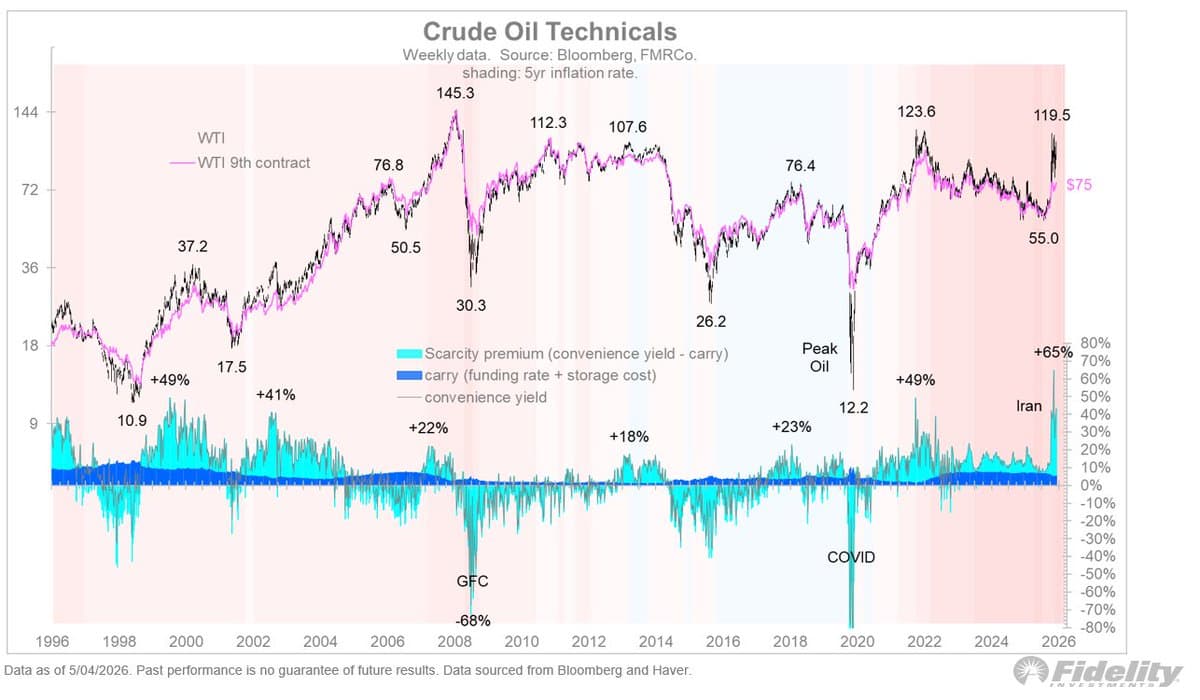
Backwardation Masks True Oil Price, Reflects Convenience Yield
Below we see the front contract for crude oil, as well as its 9-month forward (purple line). For WTI the spread is $109 vs $75. That’s called backwardation, and the lazy interpretation (of which I have been guilty) is that...
Oil Shock May Mirror 2022 Spike, Not Gulf War
Not to rain on this bullish parade, but there is a left tail lurking out there in the Strait of Hormuz. The more I learn about the mechanics of the energy market, the more concerned I am that what the...
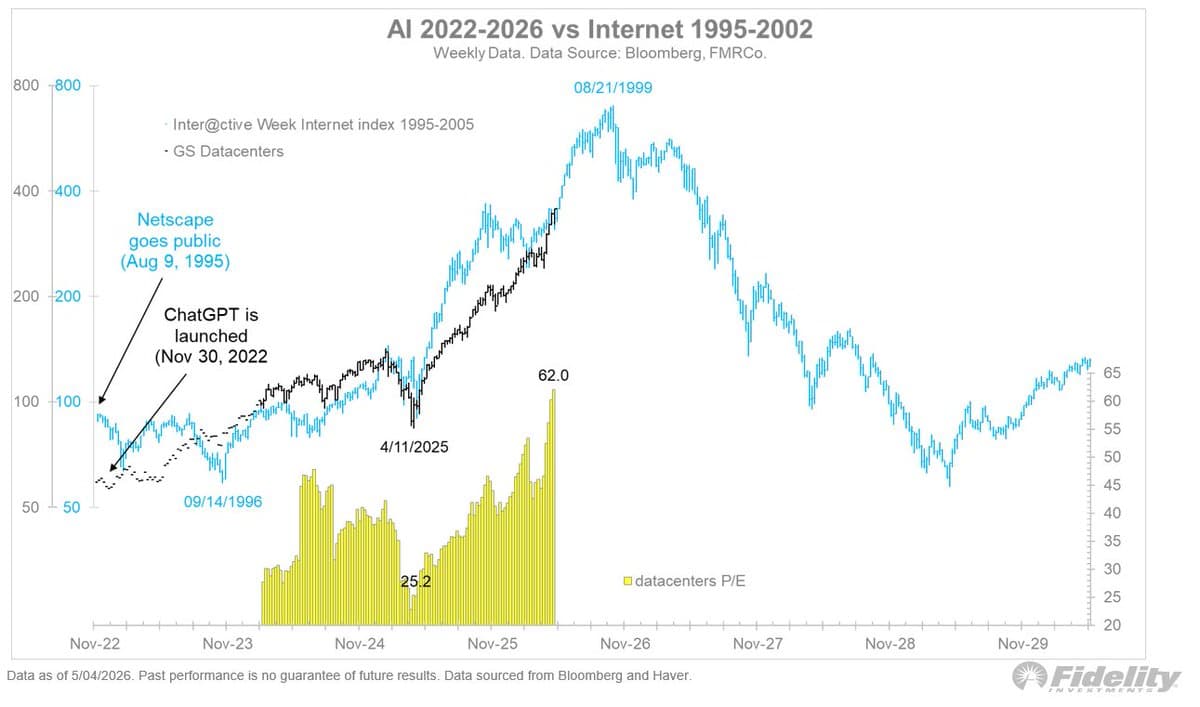
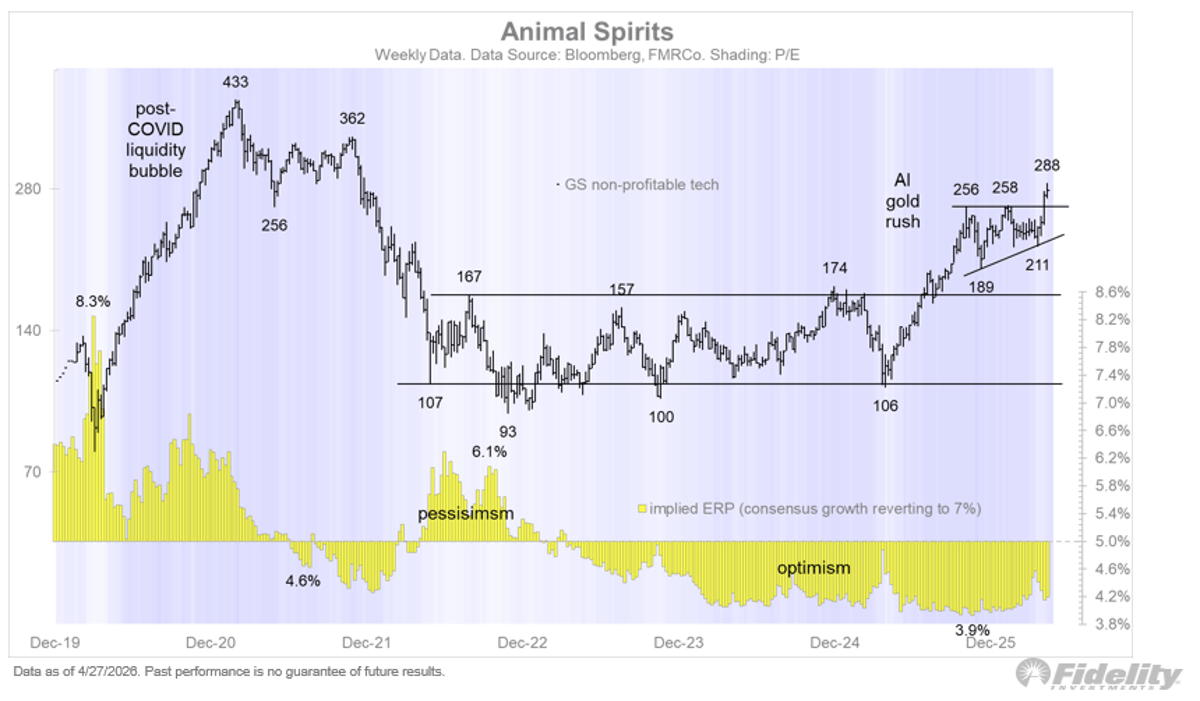
AI Surge Mirrors 1999 Internet Bubble, Signals Blow‑Off Rally
With the AI theme continuing to accelerate higher, should we be back on bubble watch, as we were last October when things started to get frothy? I haven’t shown my bubble analog in a while, so we are due for...
AI Capex Doubles, Outpacing Broader Market Earnings
As remarkable as these data points are, we must remember that this is a top-heavy market with top-heavy earnings. So, there is less than meets the eye here as the broader market is producing more typical earnings breadth. Nevertheless, this...

Q1 Estimates Surge 300bps, Defying Historical Trend
Q1 earnings seasons continued last week, and the results were dramatic. I have been tracking the Bloomberg weekly estimates for over a decade, transcribing the growth rates by hand every weekend. The pattern is familiar: estimates tend to drift lower...
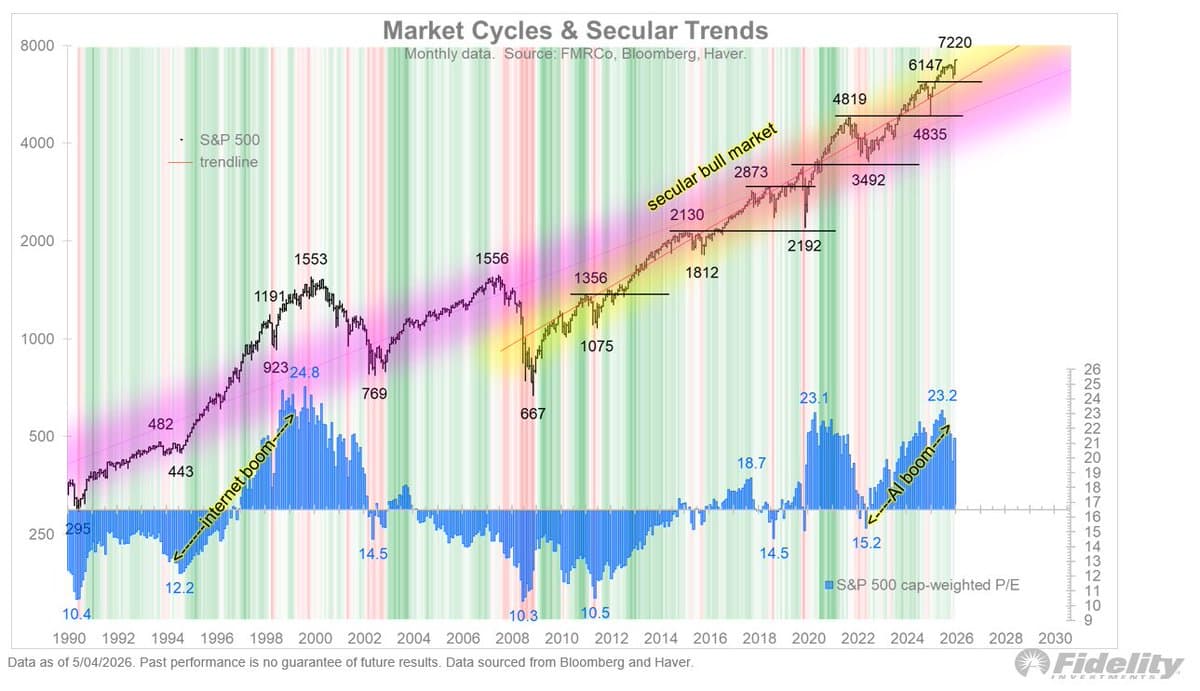
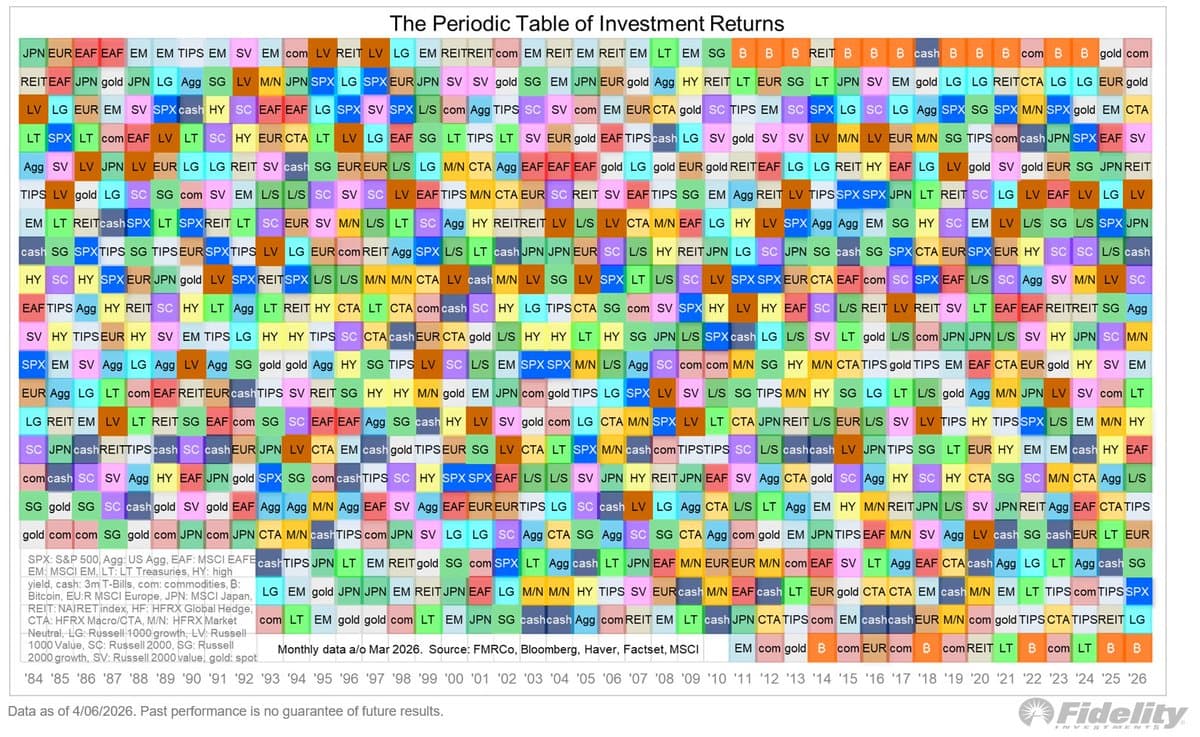
AI‑driven Capex Fuels 17‑year Secular Bull
All those corrections were sharp but short-lived, as is typical during secular bull markets. By my count, the current secular regime started in 2009 and is now 17 years old. There are no signs yet that the secular bull is...
Oil Backwardation May Signal Deeper, Lasting Market Stress
My sense has been that the market is interpreting the backwardated oil strip as a glass half full, concluding that the forward price of $75 is “right” and that the spot price of $109 is temporary. But what if it’s...
Q1 Earnings Surge Sparks AI Melt‑Up Hope Amid Geopolitical Risk
It was another eye-opening week in the markets. Q1 earnings season went “vertical” in a way that I have never seen before. We typically see this during recoveries, not in year four of a bull market. It makes me wonder if we are...
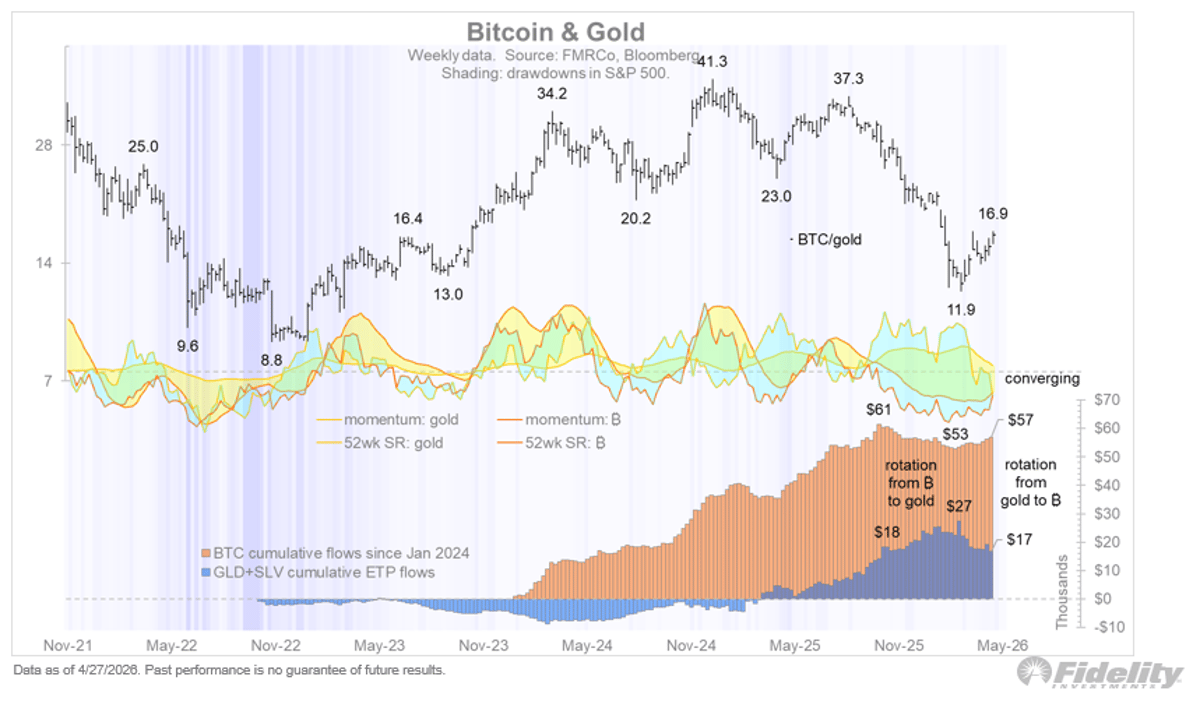
Bitcoin's Sharpe Ratio Surpasses Gold, Signaling New Bull
I continue to watch Bitcoin here following its mild winter from $126k to $60k. Its momentum and Sharpe Ratio continues to improve vs gold and other asset classes (including commodities). There has been a clear rotation away from gold ETPs...
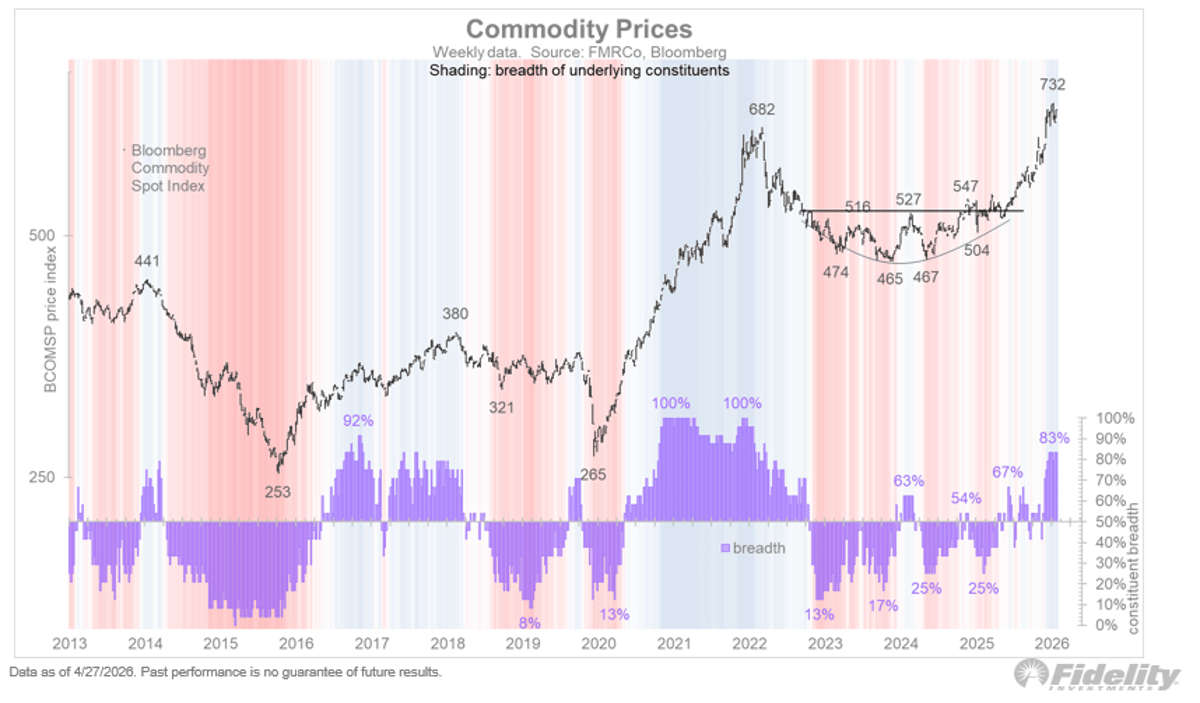
Commodities Reemerge as Strategic Assets Amid Bull Market
The Bloomberg Commodity Spot index continues to show impressive strength, even as both oil and gold continue to churn. And the secular bull market (per the CRB index below) also remains intact. In an increasingly fragmented world, commodities are become strategic...
Beyond 60/40: Bonds No Longer Guaranteed Diversifier
I continue to advocate looking beyond the simple 60/40 paradigm to seek protection from both the 60 and the 40. Bonds are still a viable asset class but they are no longer a surefire diversifier to equities. https://t.co/8GRaglZUAs
Warsh Takes Fed Helm, Signals Lower Short Rates
Bonds have remained eerily quiet and continue to sit near the apex of a long triangle. With Kevin Warsh now about to take the helm of the Fed, we are about to enter what we might call the Warsh-Bessent Treasury-Fed...
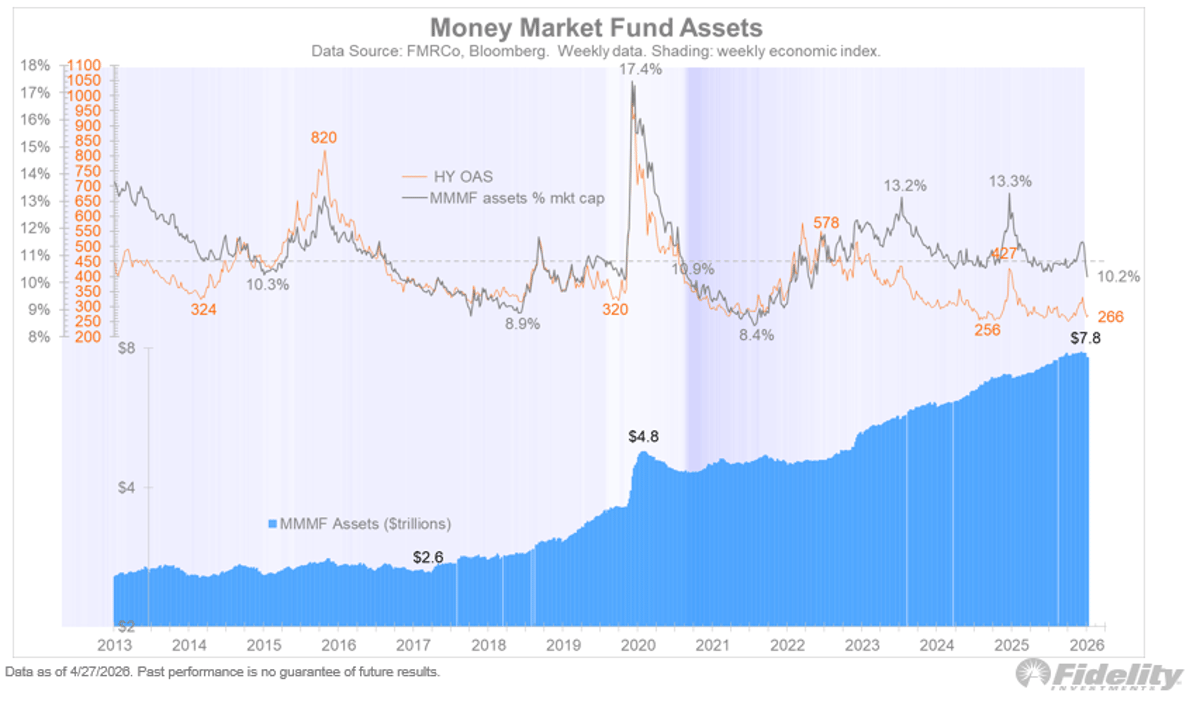
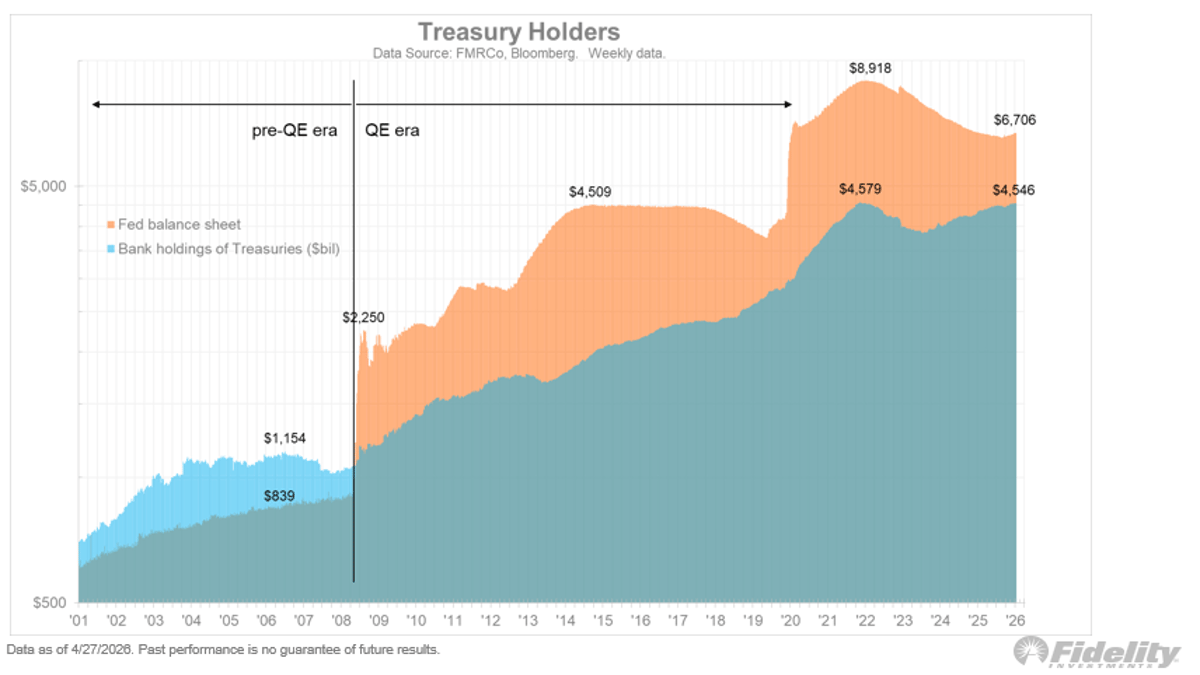
Potential $1.5 T Dry Powder Could Ignite Stock Rally
We haven’t heard much about that mountain of cash supposedly sitting on the sidelines waiting to get sucked into the market. My take has been that the $7.8 trillion sitting in money market funds came from the banks and not...
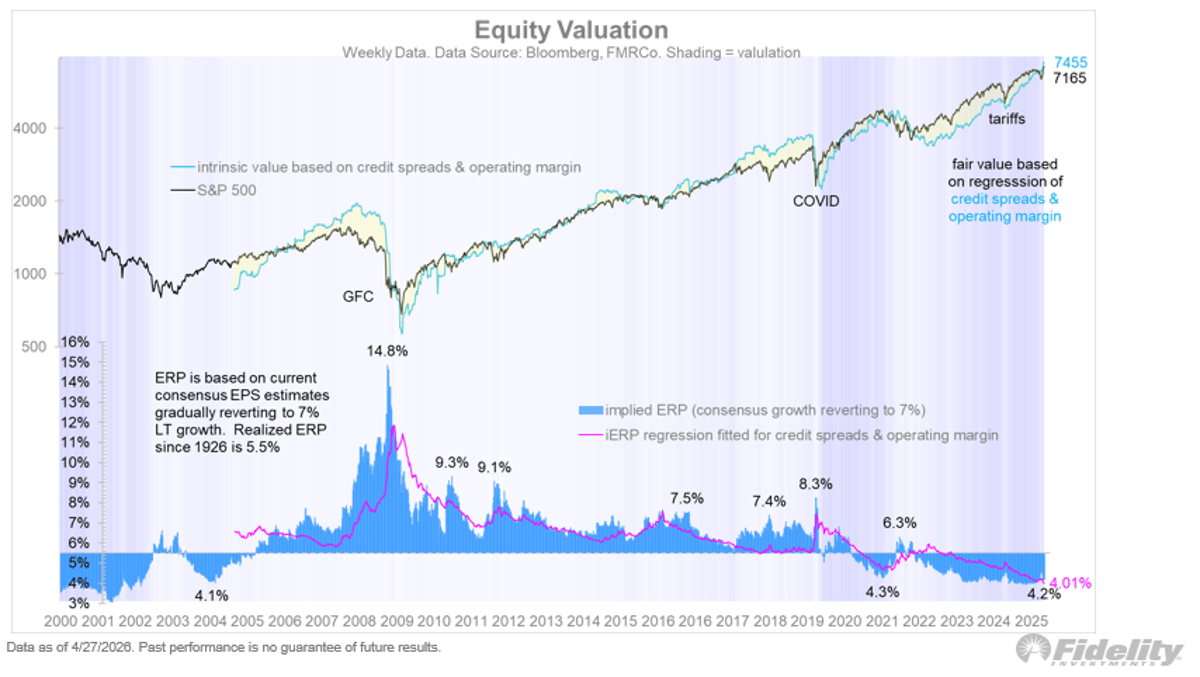
Equity Risk Premium at 4%, S&P Fair Value 7,455
While valuations in the US remain a concern for many investors, in my view they are justified by the macro fundamentals of all-time high (and rising) margins and tight credit spreads. Those two variables are the independent variables in my...
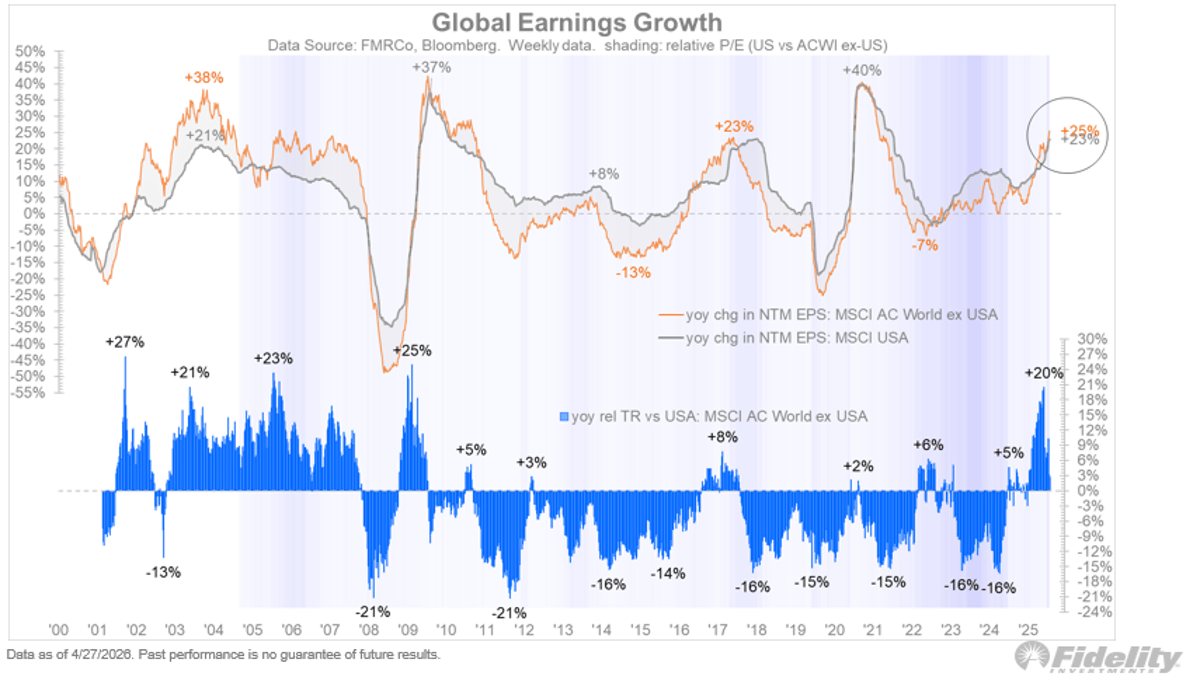
Non‑US Earnings Outpace US, Rising 25% vs 23%
While it’s tempting to lay it all on the AI story, earnings are booming even faster outside the US. The year-over-year change in forward estimates is 25% for the MSCI ACWI ex-US index, vs 23% for the MSCI US index....
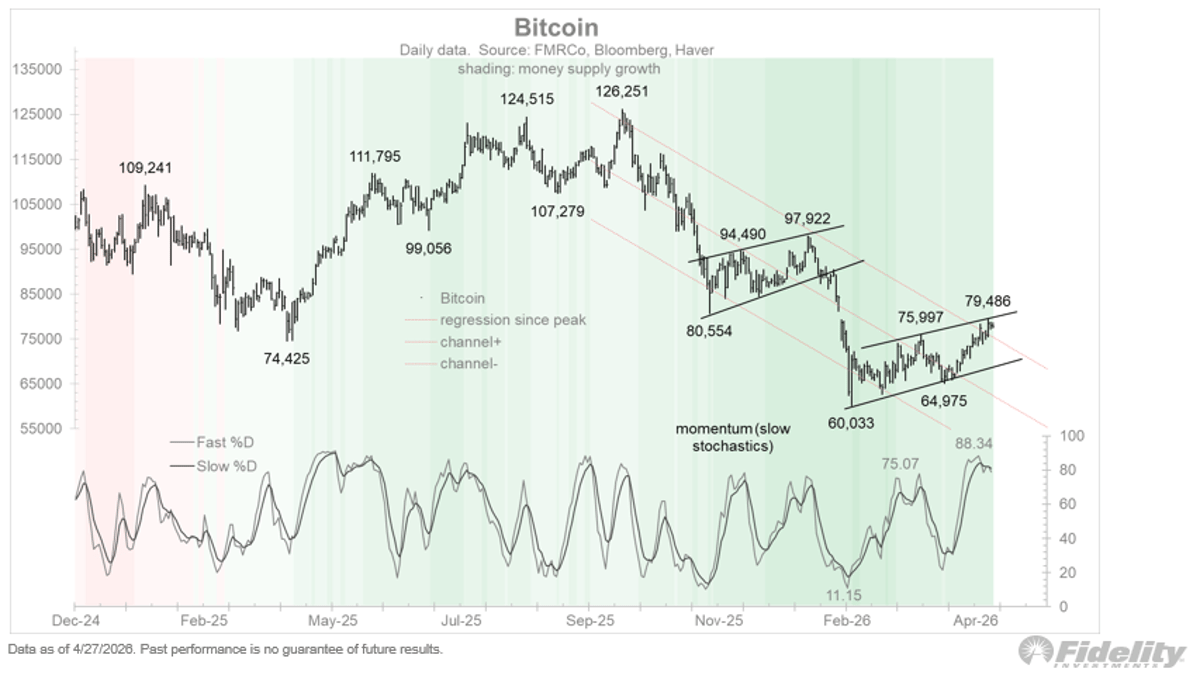
Overbought Momentum Signals Emerging Bitcoin Bull Market
Bitcoin also continues to show resilience as it tests the upper bounds of a potential bear flag. Technical Analysis 101 states that when bear market rallies get overbought (per the stochastics below), it’s usually the kiss of death and time...
Tech's “Cats and Dogs” Rally to New Recovery Highs
Even the “cats and dogs” within the tech space are stirring again, making new recovery highs last week as they rallied out of a holding pattern. https://t.co/YVhrMqi5WA
Earnings Surge Shields Market, Fuels Potential Upside
Booming earnings growth has been a dominant feature of the market’s resilience amid some unsettling geopolitical headlines. Were it not for earnings estimates accelerating to a 20% year-over-year rate, surely the recent 9.8% drawdown would have been closer to the...
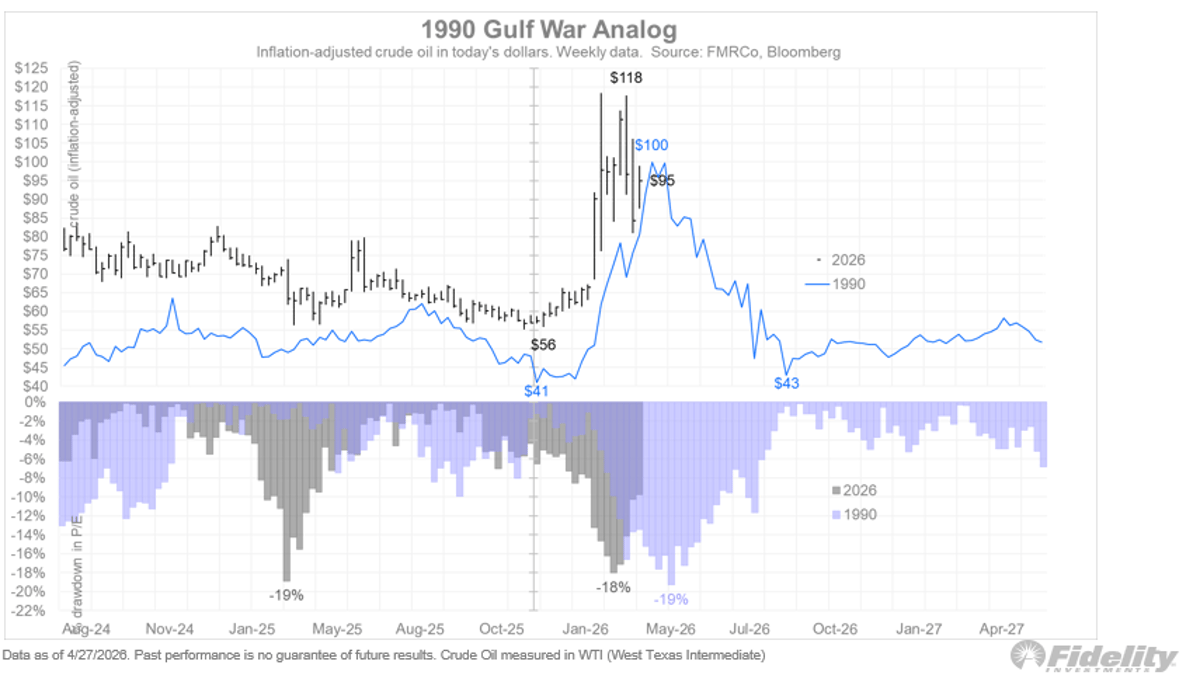
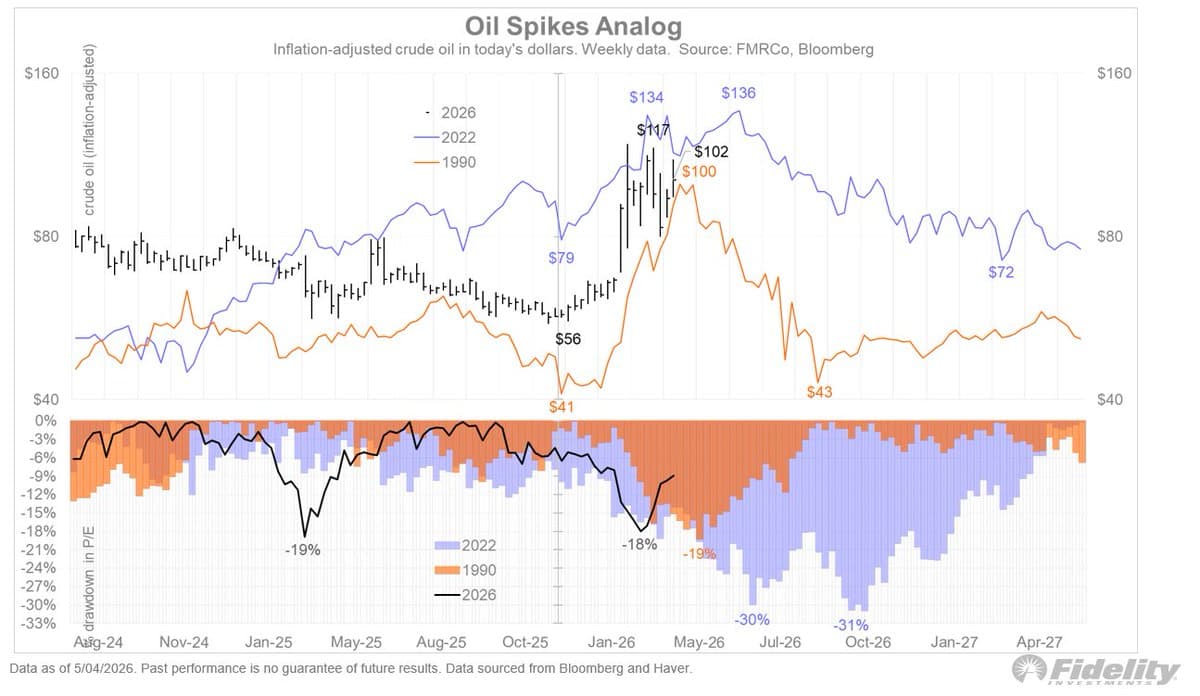
Markets Mirror 1990 Gulf War Oil Drawdown
The market continues to trade along the 1990 Gulf War analog, presumably betting on a quick reversal from the current oil spike. The valuation drawdown of 18% has been a spitting image of the 19% drawdown back in 1990. Let’s...
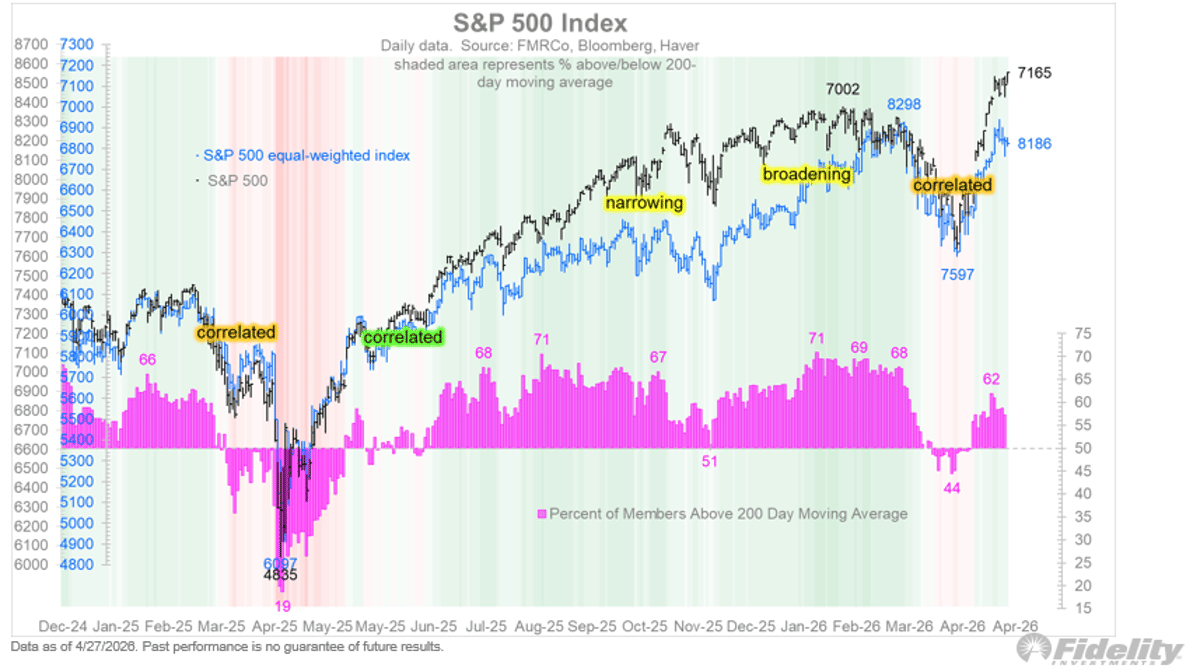
Cap-Weighted Index Outpaces Equal-Weighted, Still Below Jan Highs
While the rally from the March 30th low has been fairly uniform in absolute terms, the cap-weighted index has dominated the equal-weighted index, which remains below its January highs. https://t.co/IIplljdzDN
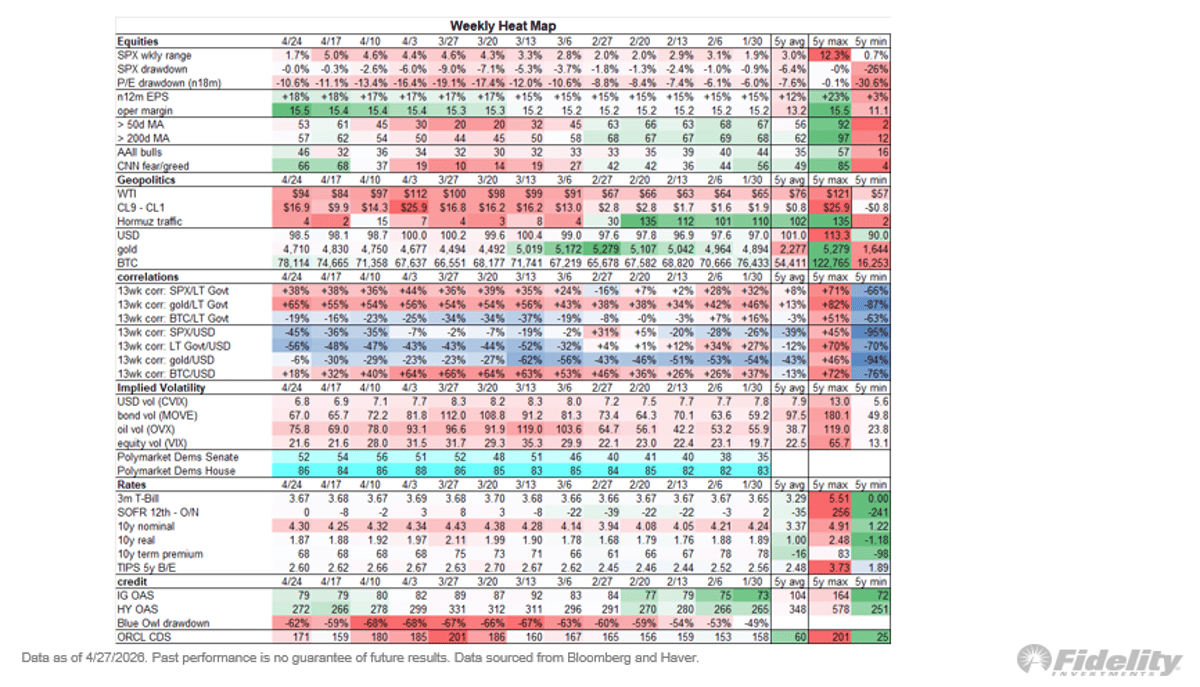
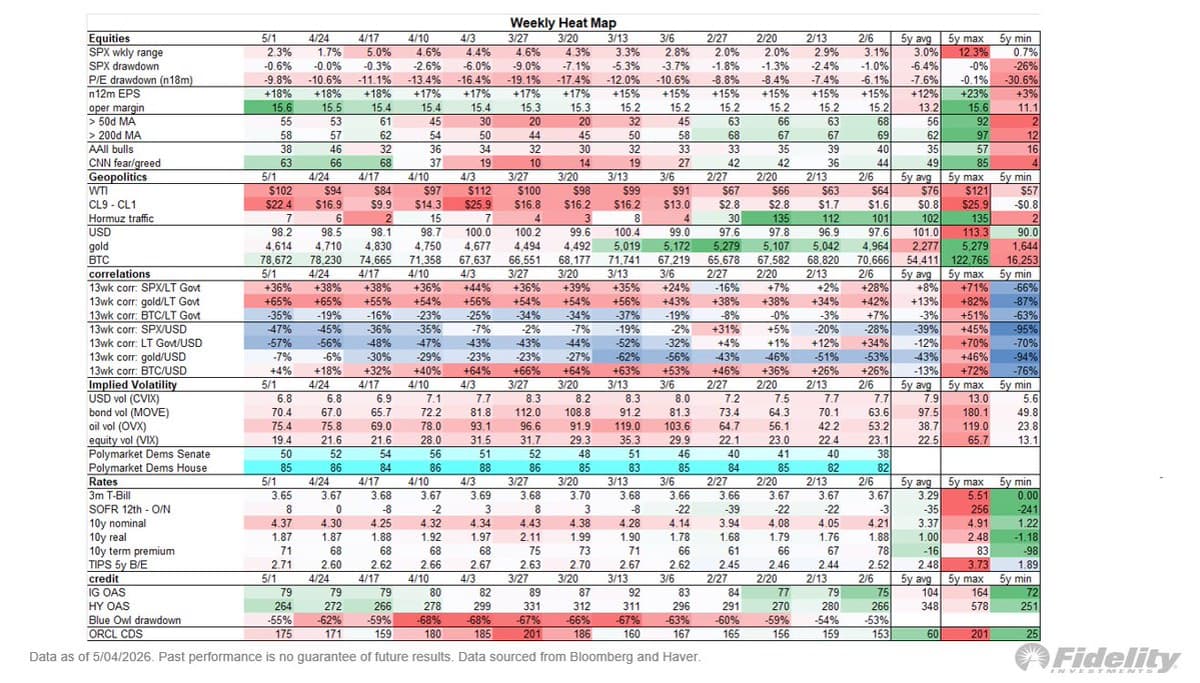
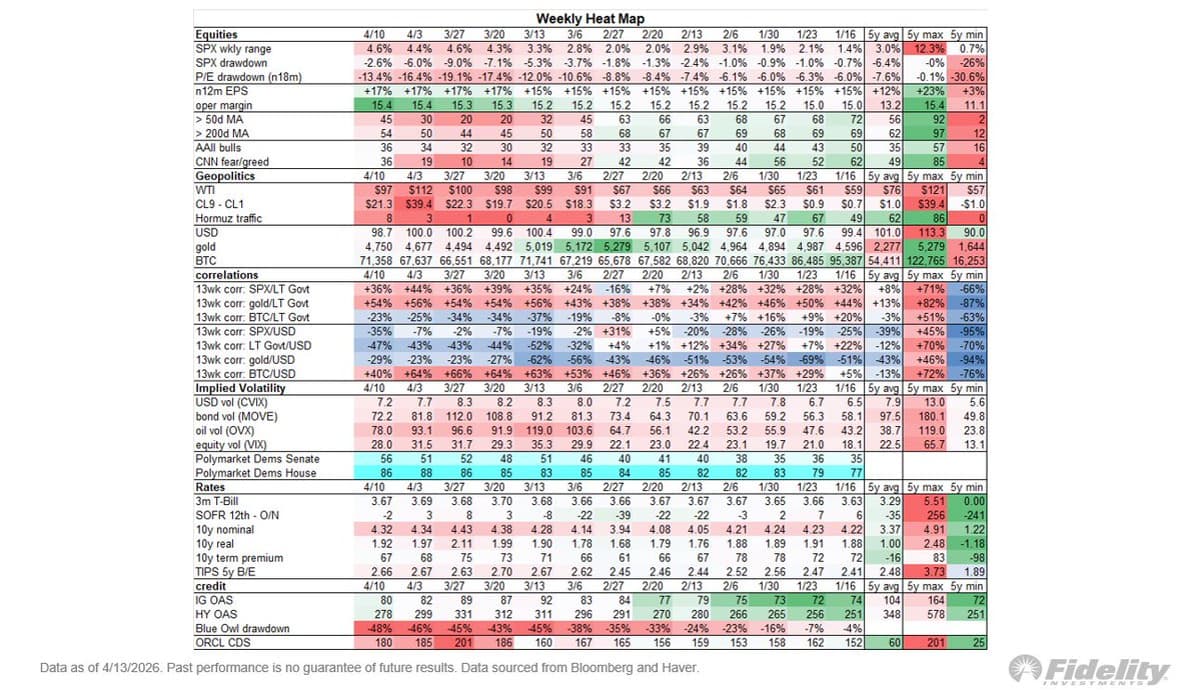
Tech AI Fuels S&P Highs as Breadth Stays Modest
For the markets, last week was more of the same, with strong momentum in the tech/AI space propelling the market away from concerns about oil shortages as the Strait of Hormuz remains mostly shut. Per the heat map below, the...
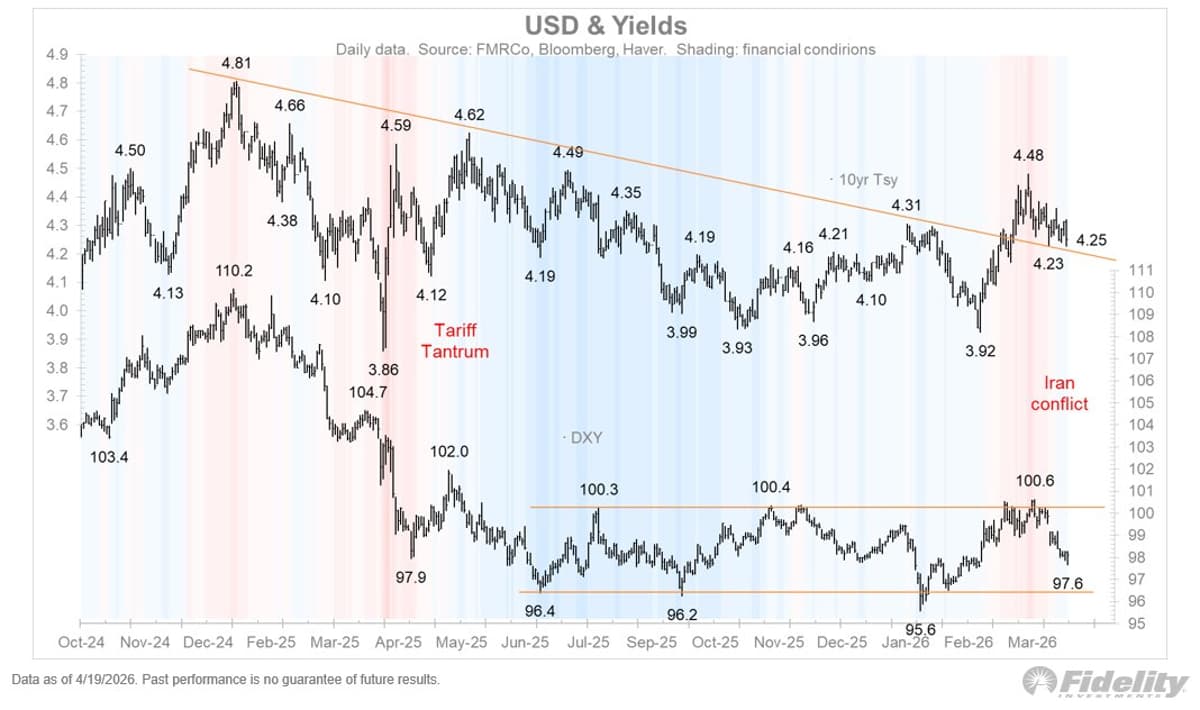
Cease‑fire Stalls Dollar, Hints at Upcoming Decline
Last week’s (week of 4/13) cease fire in the Middle East helped keep the bond market calm and the dollar from surpassing resistance at 100-10. The fact that the dollar’s gains were less than impressive suggests that the next major...
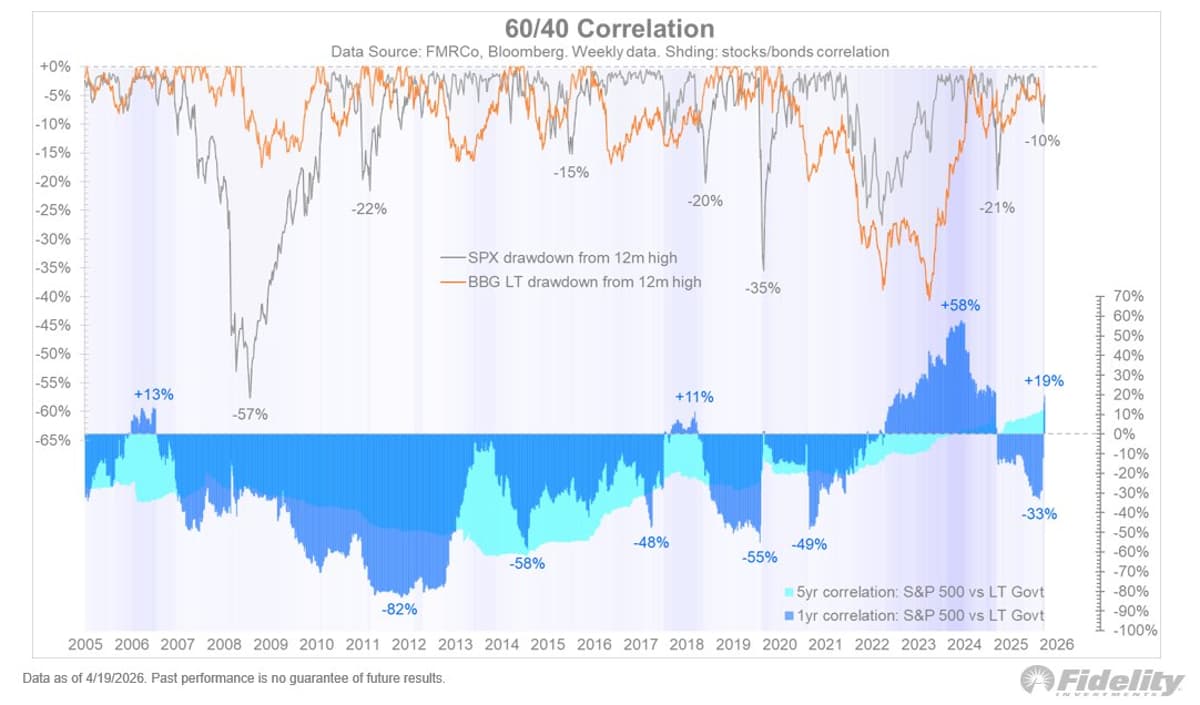
Rethink 60/40: Adopt 60/20/20 with Uncorrelated Assets
With bonds and stocks once again positively correlated (per the chart below), the current/recent market episode served as another reminder to look beyond the 60/40 for that balance between returns and risk. Since 2022 I have been advocating for a 60/20/20...
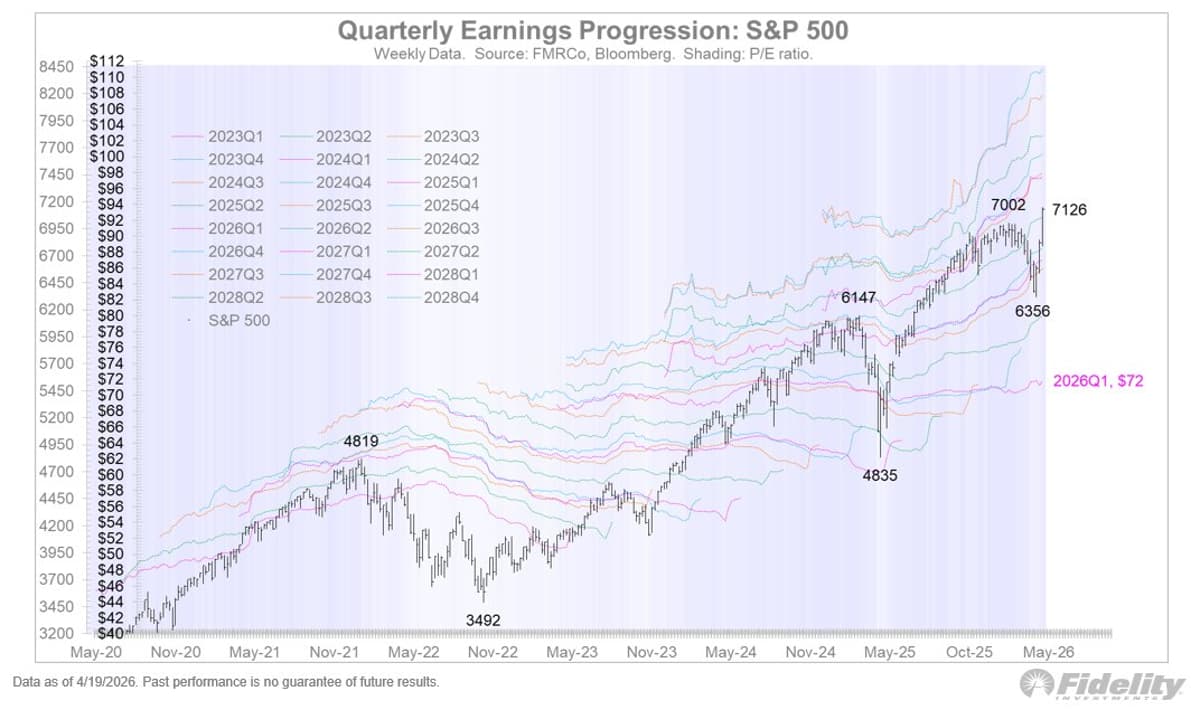
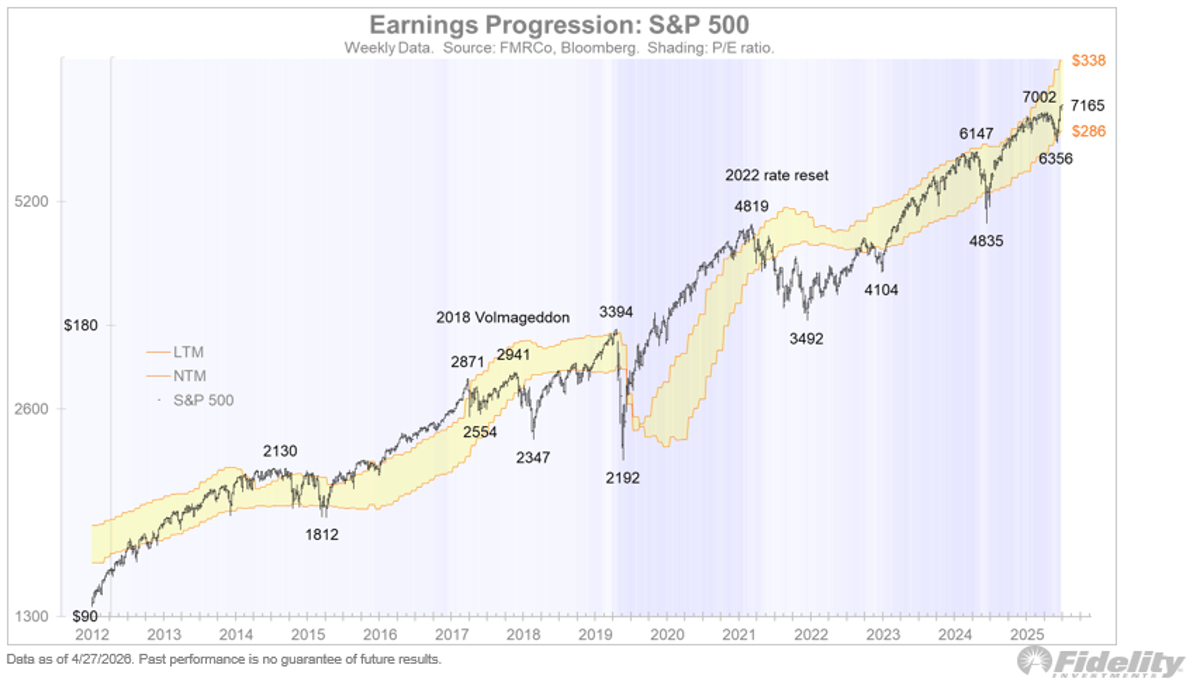
Earnings Growth Offsets P/E Drops, Yields Positive Returns
The resilience and even acceleration in earnings has kept the recent decline to single digits instead of the nearly 20% drawdown in the forward P/E ratio. The earnings & valuation chart below shows the various noteworthy episodes when earnings are growing...
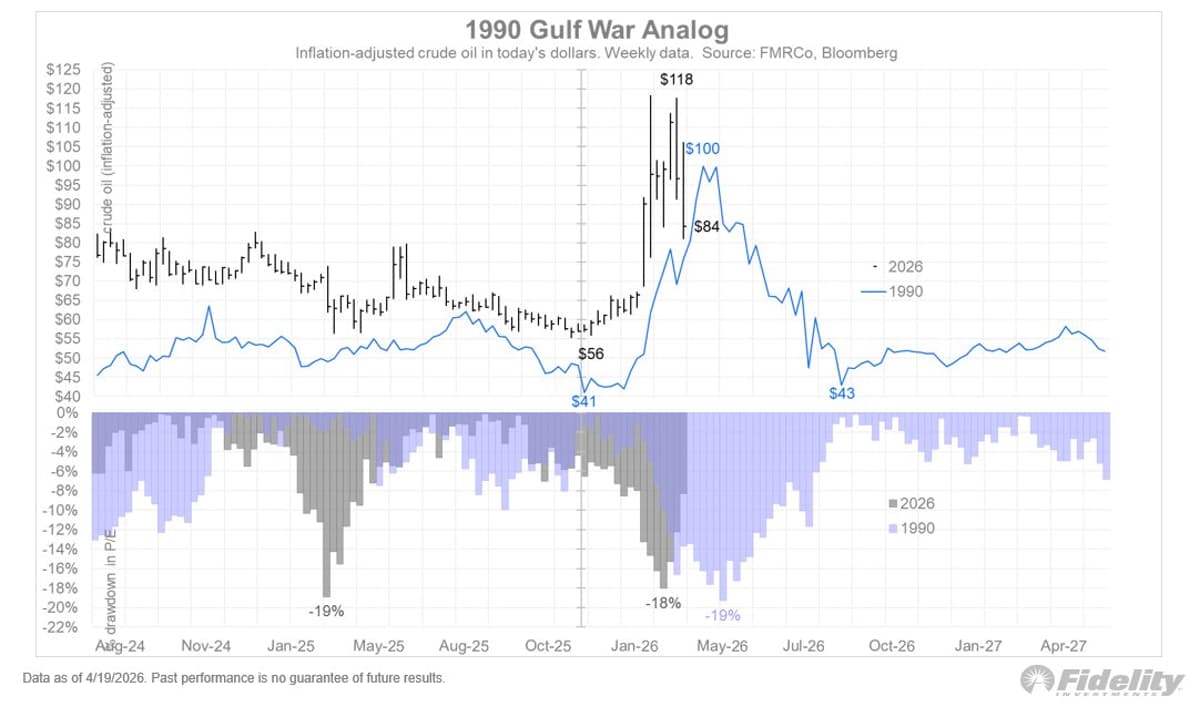
Prolonged Oil Price Spikes Extend Equity Market Correction
With crude oil prices driving equities right now, let’s take a look at two examples of oil shocks. The 1990 Gulf War took oil prices from $41 to $100 (in today’s dollars) was short-lived and caused only a brief 19% drawdown...
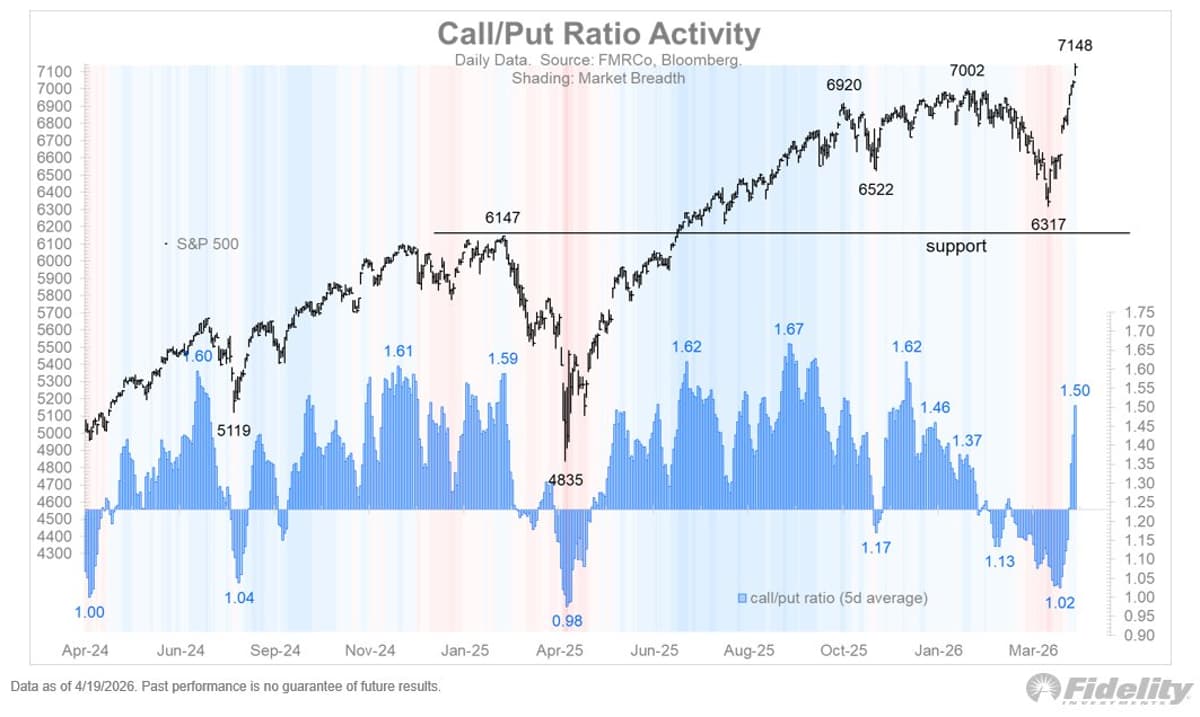
Short Covering Fuels Equity Melt‑up as Call/Put Ratio Spikes
The equity melt-up of the past two weeks was surely driven (in part) by short covering. The call/put ratio below has now surged from 1.02 to 1.50. https://t.co/jGi0QAJW3f
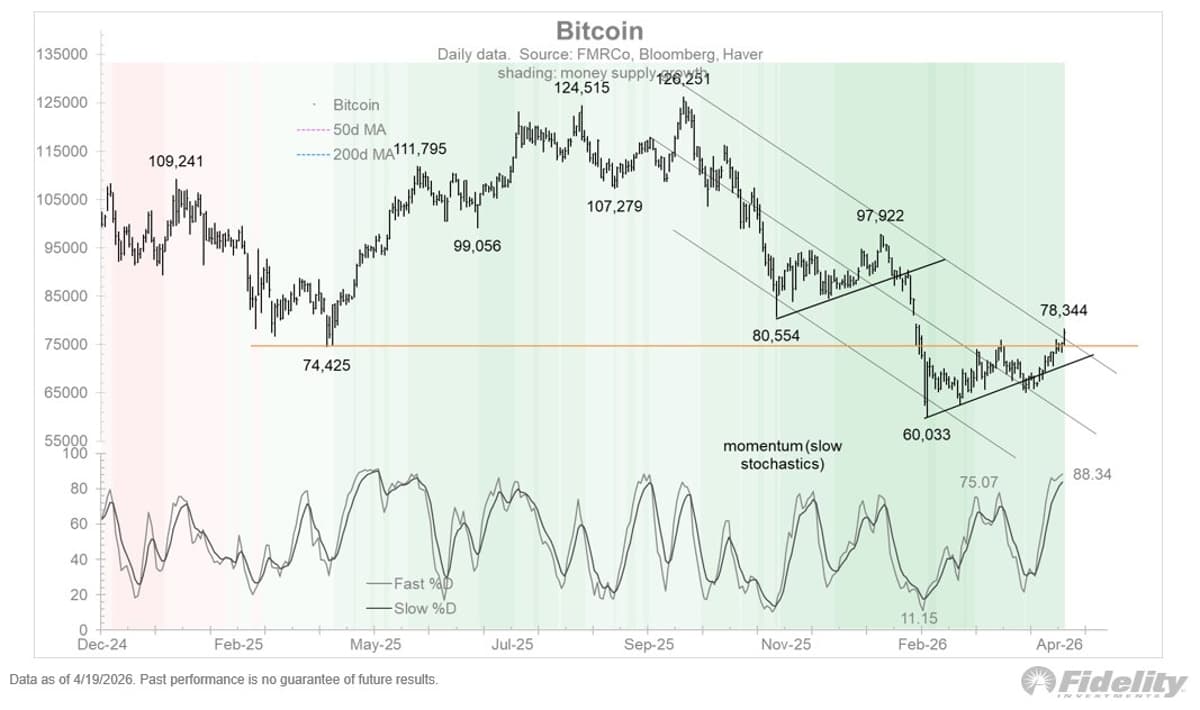
Bitcoin Builds Base at $78k, Primed for Next Surge
Bitcoin continued to build up last week, making a new recovery high of $78,344. The rally off the $60,033 low could still be described as a bear flag (not unlike the bear market rally last fall), but my sense...
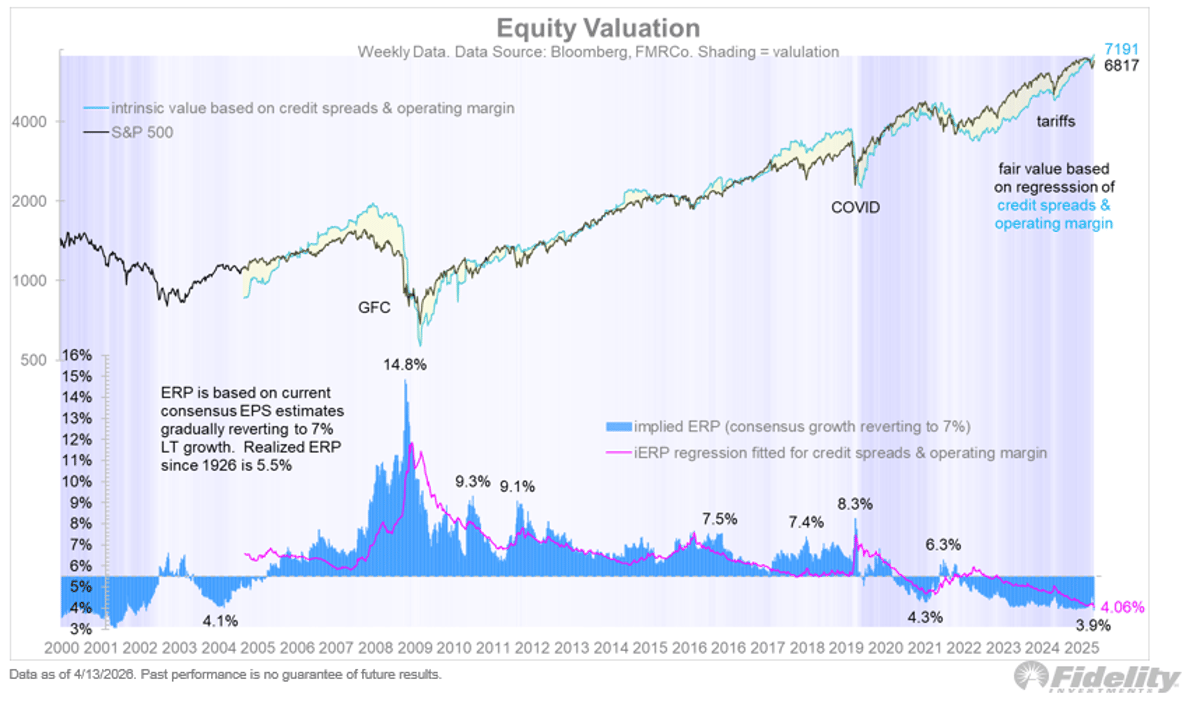
Equity Risk Premium Near 4% Validates Current Valuations
With credit spreads still well-behaved and operating margins making new highs by the week, the valuation picture for US stocks remains justified, especially after the drawdown of the past few weeks. The chart below shows that the “fitted” equity risk...

Strong Fundamentals Keep Equities Resilient Amid Mid‑cycle Economy
The saving grace for equities are strong fundamentals with a US economy firmly in mid-cycle, earnings estimates growing at double digits, and valuations not out of whack against metrics such as credit spreads and operating margins. https://t.co/YcF7Fv550i
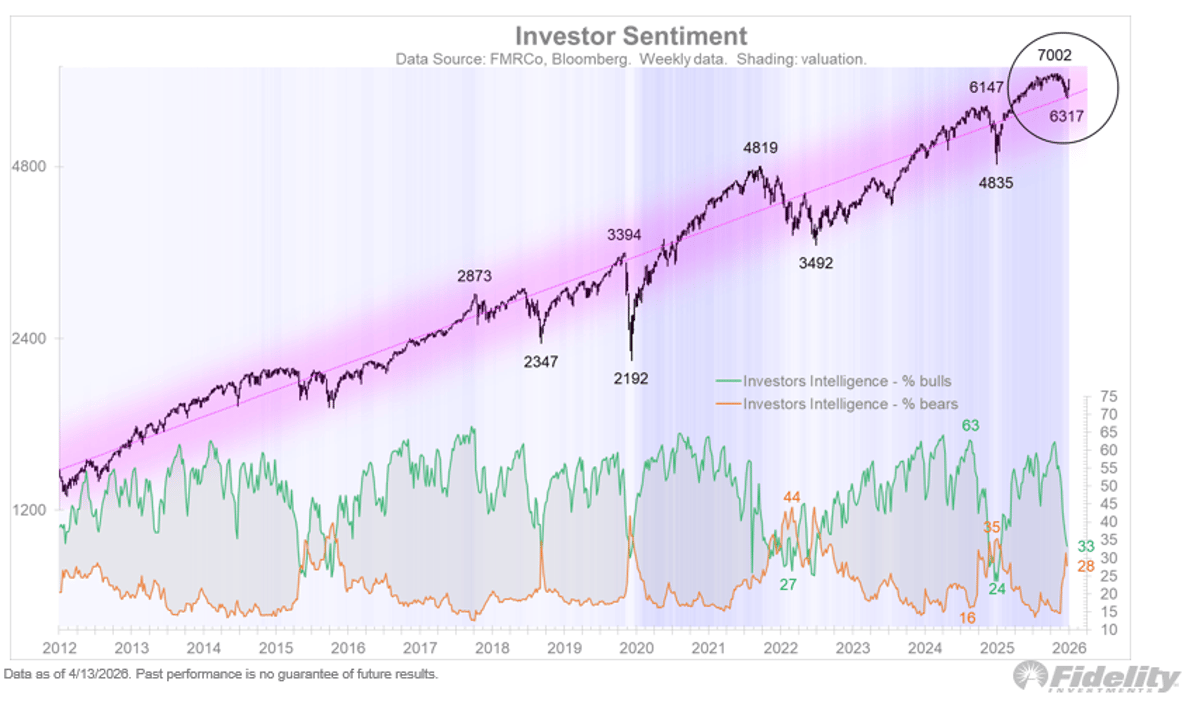
Investor Sentiment Still Below Crossover Amid Shifting Headlines
A longer term measure of sentiment (the Investors Intelligence survey below) shows that sentiment has not “crossed over” as it did a year ago. Maybe that will still happen now that the headlines have pivoted again. https://t.co/UFEsFhZhJf
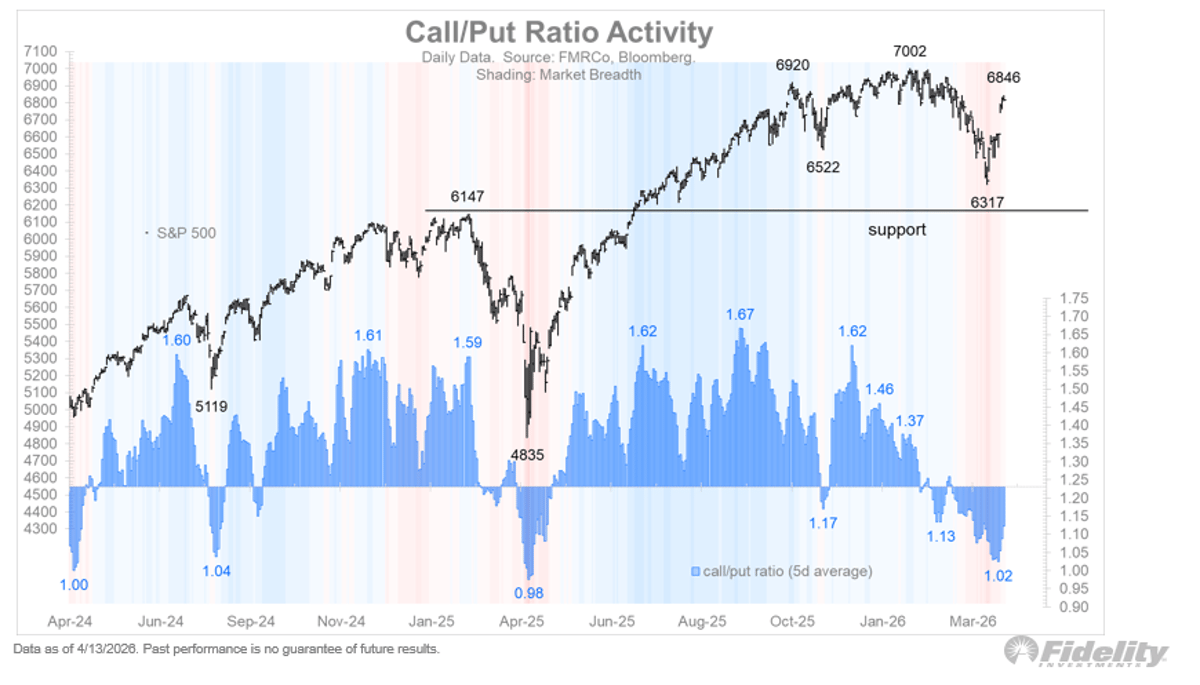
Market Rally Fueled by Call/Put Oversold Reversal
One support behind the market’s surge last week was the reversal in sentiment from an oversold extreme, at least as judged by the call/put ratio. That ratio is still negative. https://t.co/i43C3jXDt6
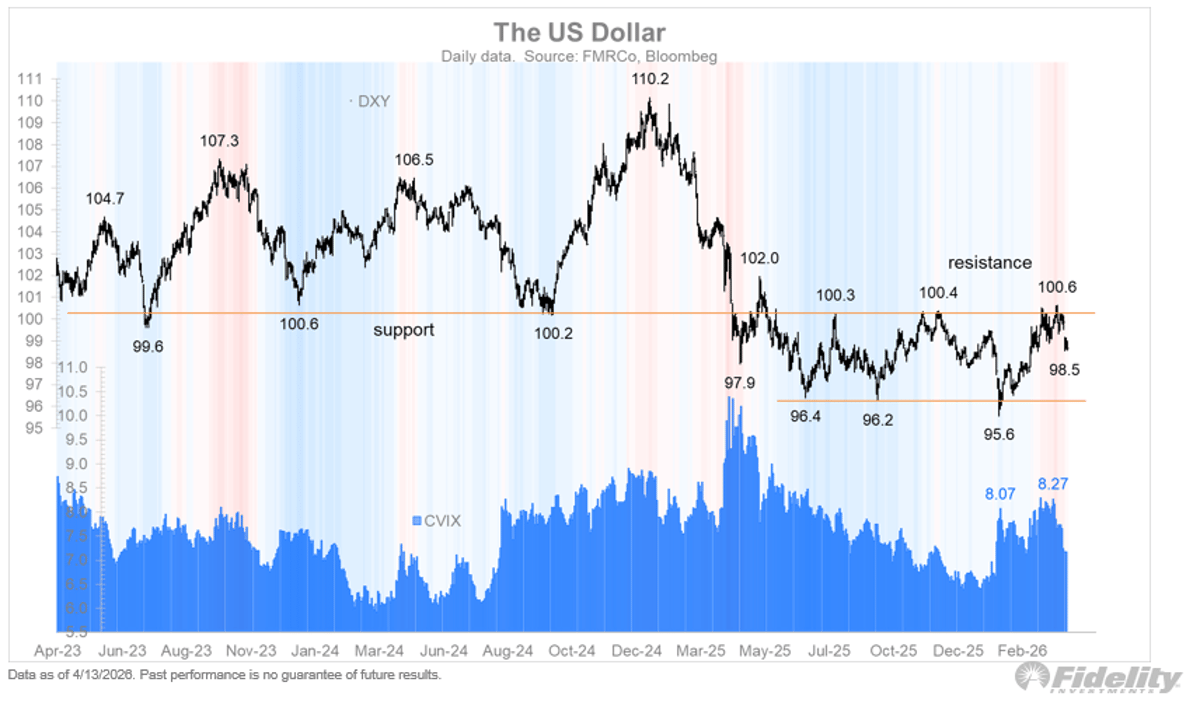
Dollar's Reserve Role Erodes as DXY Stalls Below
The other side to the toll booth narrative in the SoH is that the dollar will continue to devolve as the dominant reserve currency, as more and more of the world’s trade takes place locally or regionally. With that in...
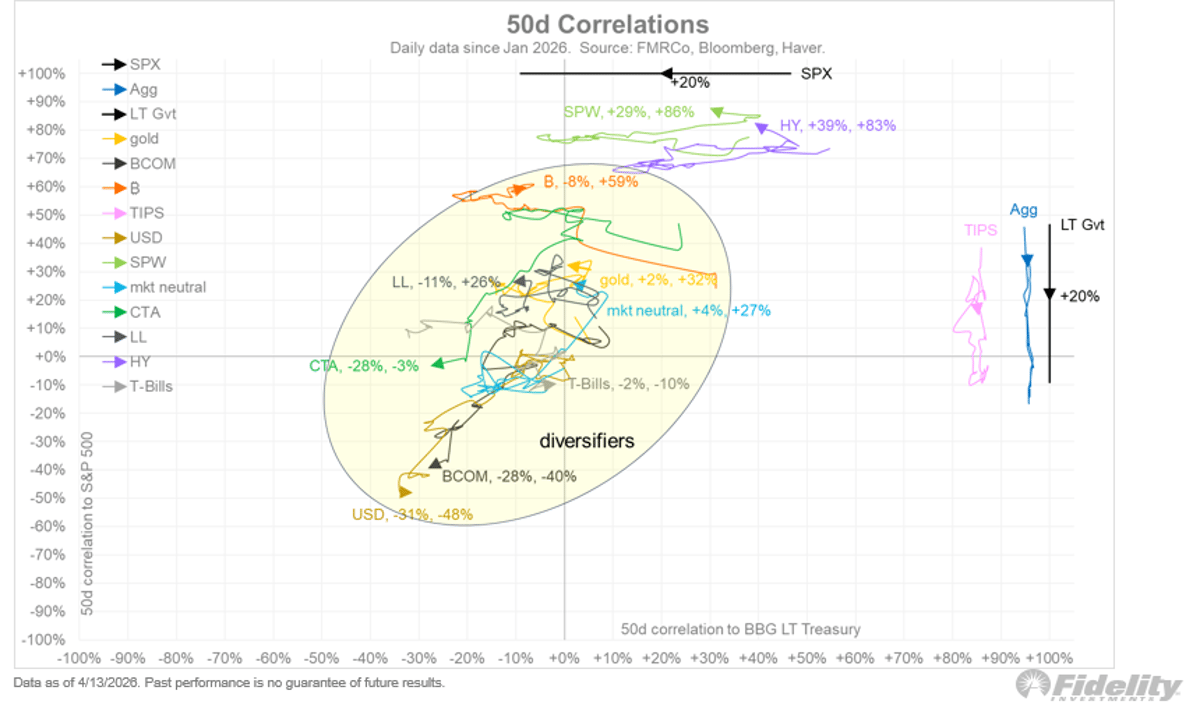
Diversifiers Shine as Equities and Bonds Re‑correlate
With equities and bonds positively correlated again (a déjà vu to 2022), it’s good to see that the group of diversifiers that I have in my hypothetical 60/20/20 model have been doing their job. The chart below shows the “crawling”...
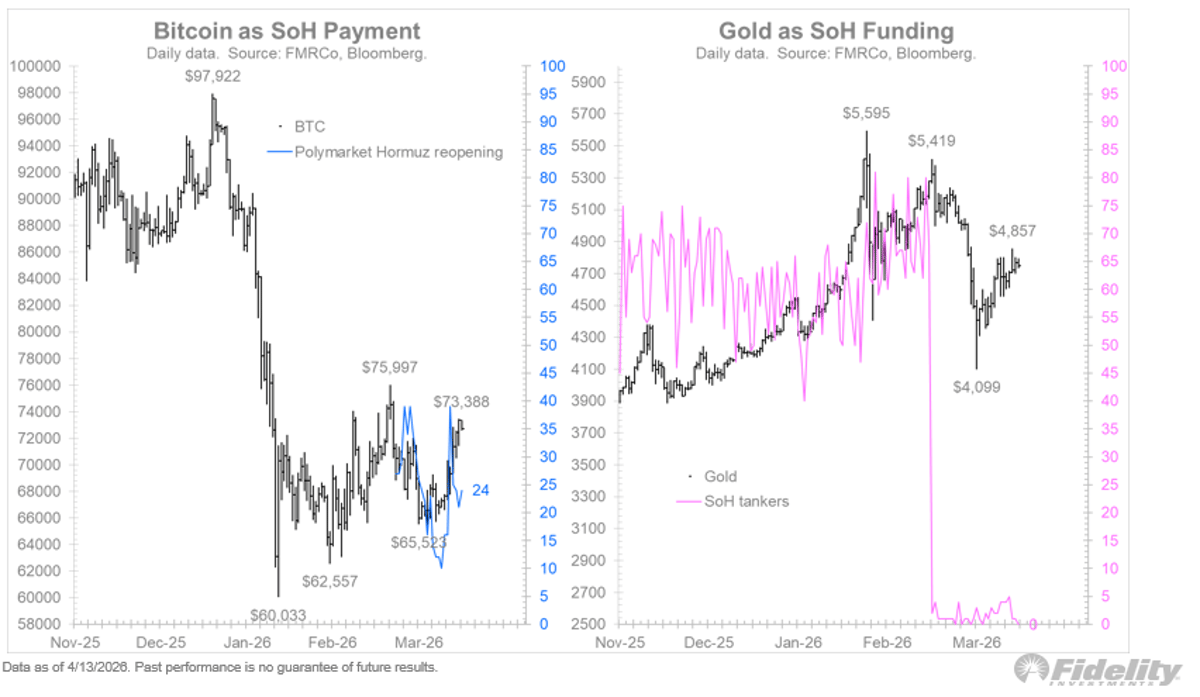
Bitcoin Climbs as Strait Tolls Pressure Gold Reserves
One emerging narrative resulting from the Iran conflict is that Iran will more or less control the Strait of Hormuz with a “toll booth” approach and that countries might pay those tolls in Yuan or crypto. Meanwhile, the exporting countries...
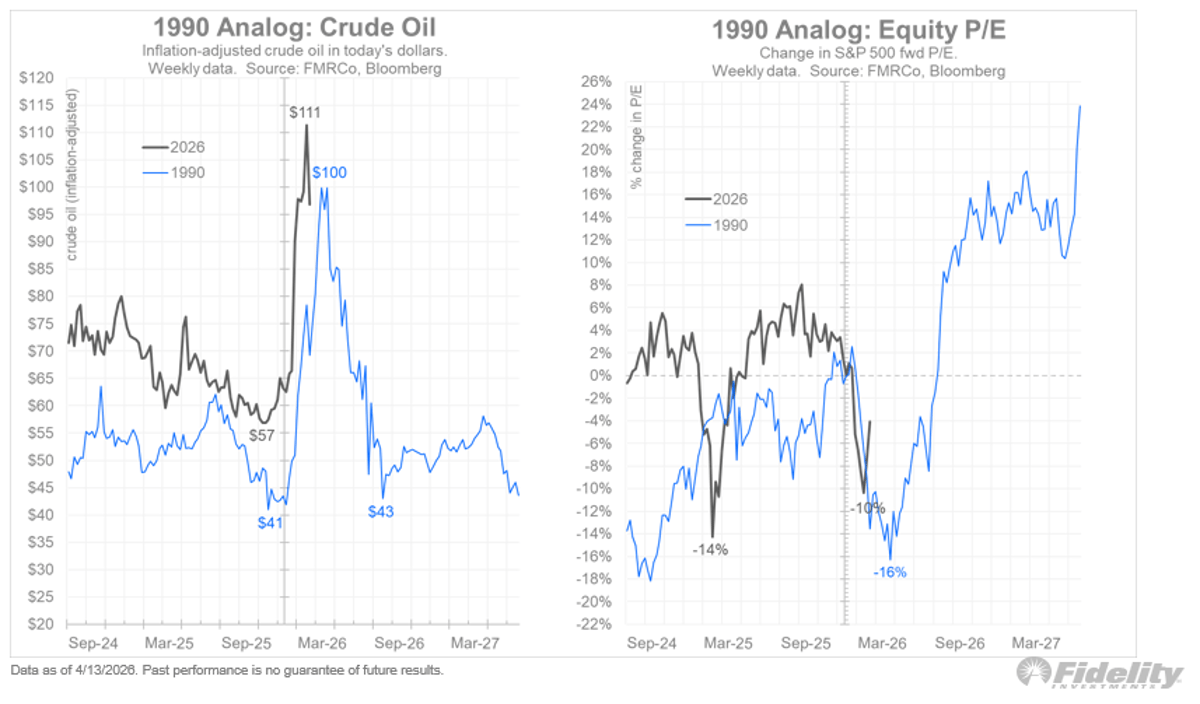
Oil Spikes Trigger Swift P/E Collapses, History Repeats
The markets have been pricing for a quick end, much like what happened during the 1990 Gulf War. The analog below shows that the surge in oil prices to $100 (in today’s terms) was quickly reversed, and with it so...
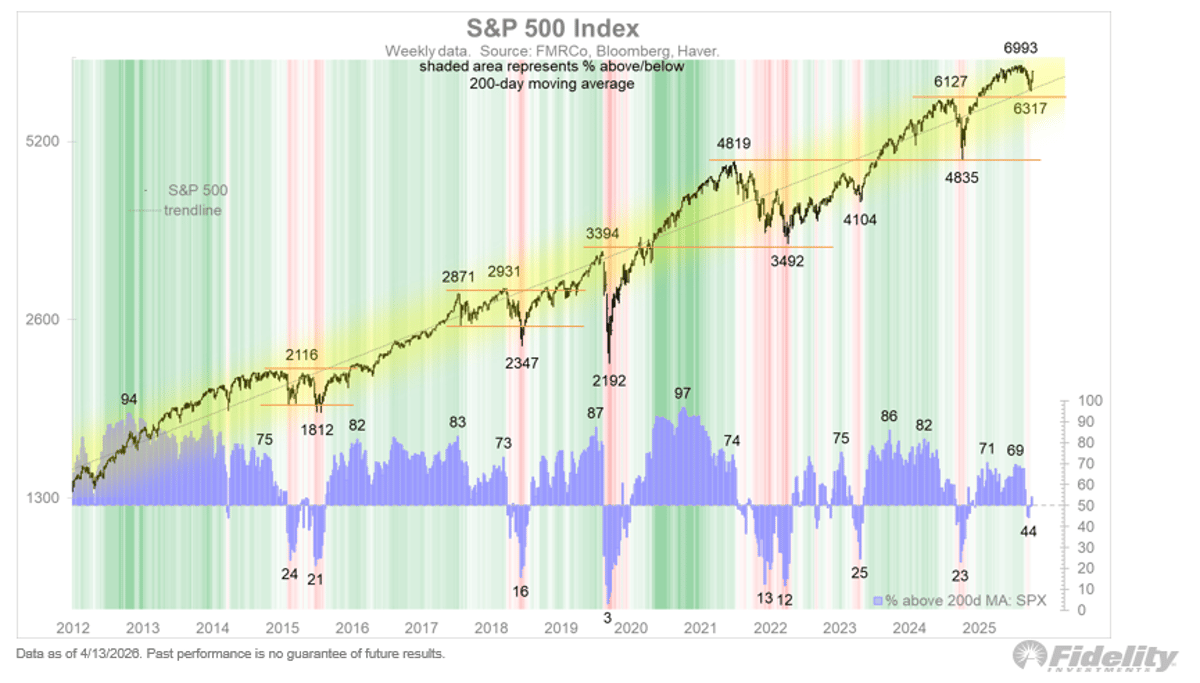
S&P 500 Missed Oversold Low; Further Dip Needed
The weekly chart below shows that the S&P 500 index stopped short of an oversold extreme at its March 30 low of 6317. We never got that juicy entry point. We’ll see how the market reacts as the headlines continue...
Equities Rally on Hope, Valuations Still Under Pressure
Equity markets gapped higher last week on hopes that the negotiations in Pakistan would lead to some sort of détente. The week closed with an S&P 500 index at 6816, a mere 2.6% below its all-time high set on January...

Amid Volatile Headlines, Revisit Your Investment Thesis
It’s getting increasingly challenging to write my WAAR these past few Sundays, given how much the headlines keep lurching back and forth. Truce one day, threats of extinction the next, and back and forth we go. My inclination these days is to...

Commodities Hit Record Highs, 83% in Uptrends
Commodities (per the Bloomberg Commodity Spot index below) are at new highs, driven largely but not exclusively by energy. Some 83% of the components in the BCOMSP are in uptrends. https://t.co/p7ml7lMWnw
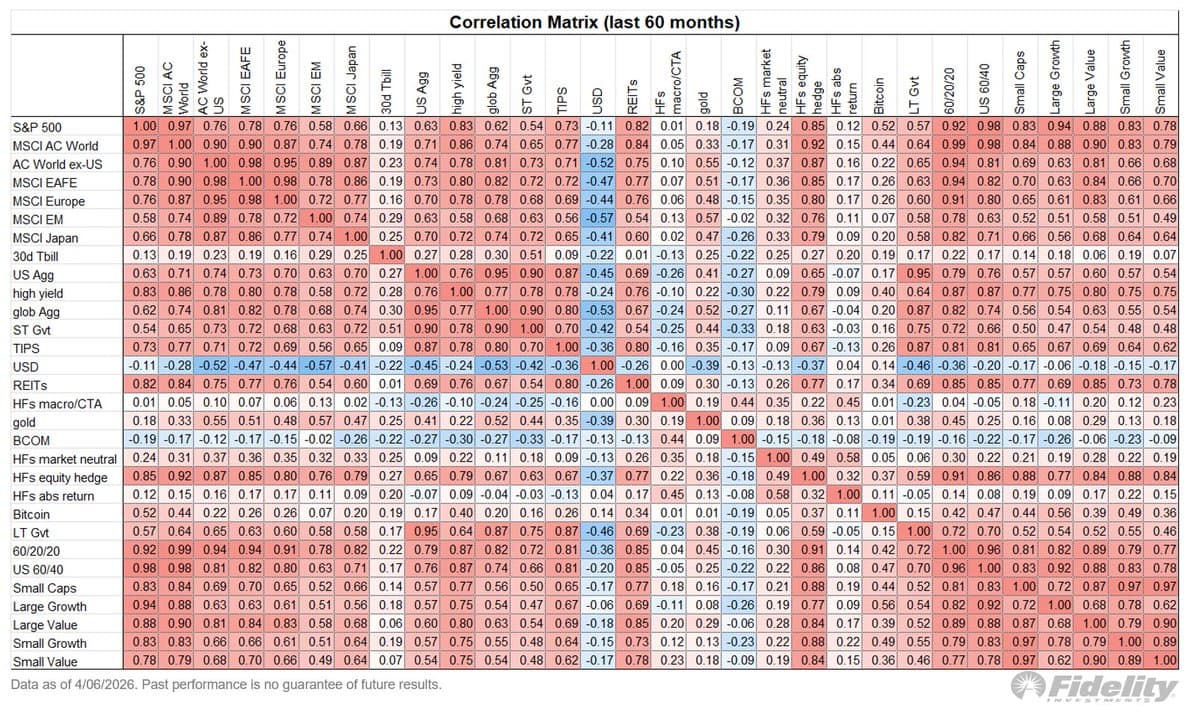
Rethink 60/40: Seek Uncorrelated Returns in Commodities and Alts
The positive stocks/bonds correlation highlights the need to think beyond the 60/40 model in order to find other sources of uncorrelated returns. Fortunately we have those in the form of commodities and alts. https://t.co/l0uBYTBbYD
Commodities Remain the Purest Diversifier Amid Correlated Markets
With equities and bonds once again positively correlated, the purest diversifier have been commodities. https://t.co/ZPvc20l8qu

AI Boom Avoids Bubble as Investors Pose Tough Questions
Just six months ago the question of the day was whether the AI boom was turning into a bubble. Fortunately that did not happen, or the current drawdown would likely have been much bigger. Instead of the AI leaders heading...
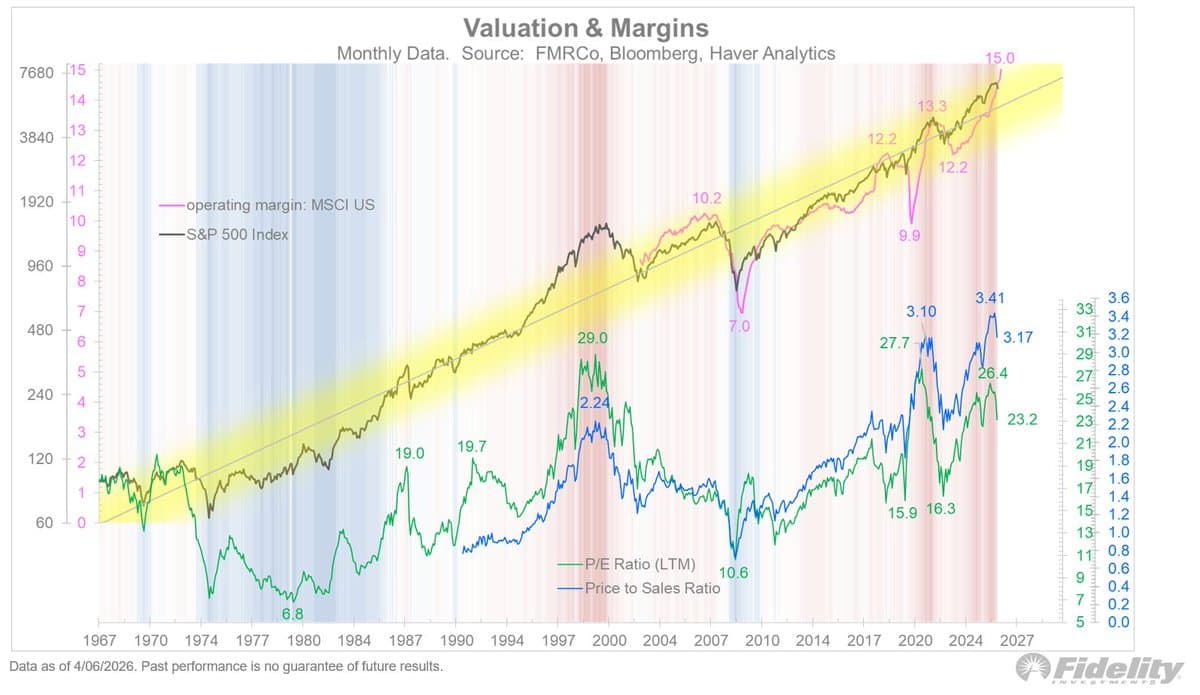
Margins Hit 15% New Highs, Driving Valuation Surge
Margins are also making new highs (now at 15%), which goes a long way to explain the elevated valuation backdrop. https://t.co/etb3rBke43
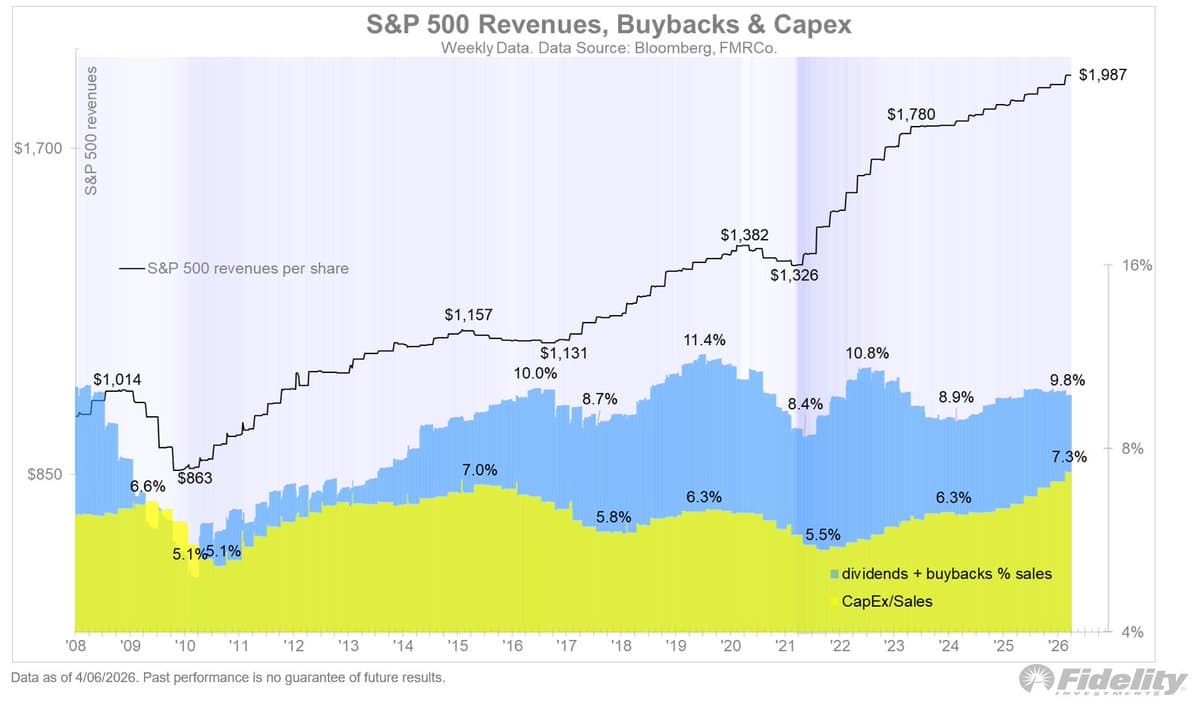
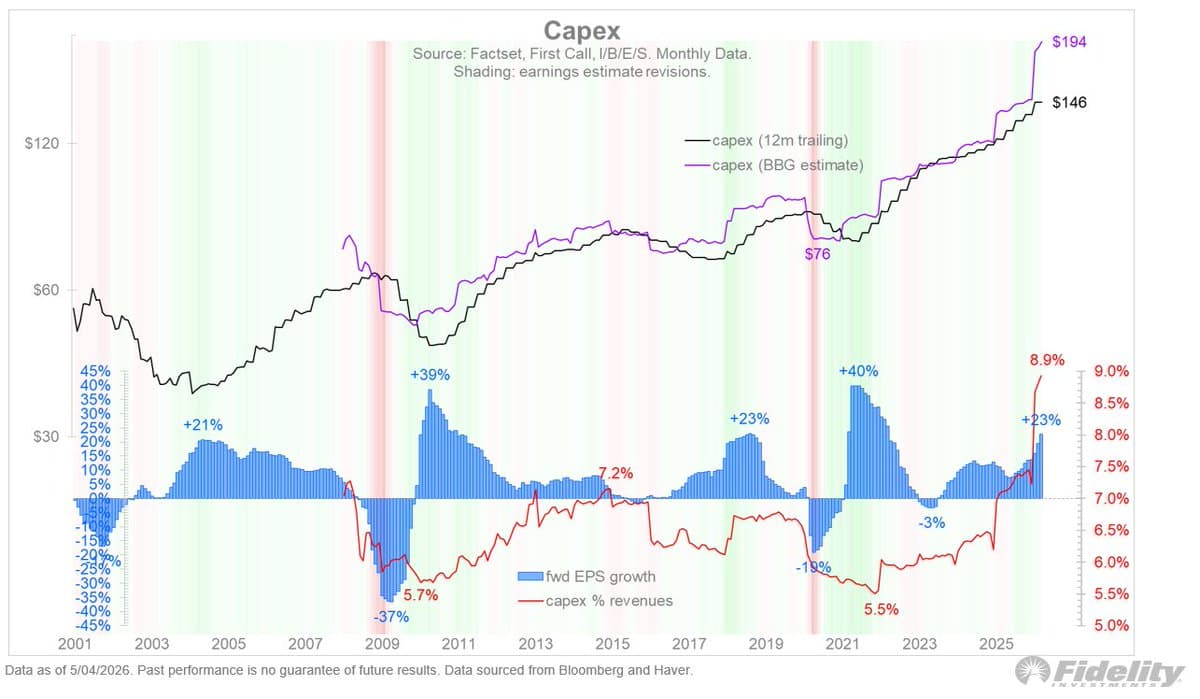
Capex Hits Multi‑Decade Highs, Fueling Bull Market
For now, the bull is alive both cyclically and secularly, with earnings, capex, and margins driving both price and valuations higher. Below we see that capex as a percentage of revenues continues to make new multi-decade highs. https://t.co/4wGEyBuKNd