
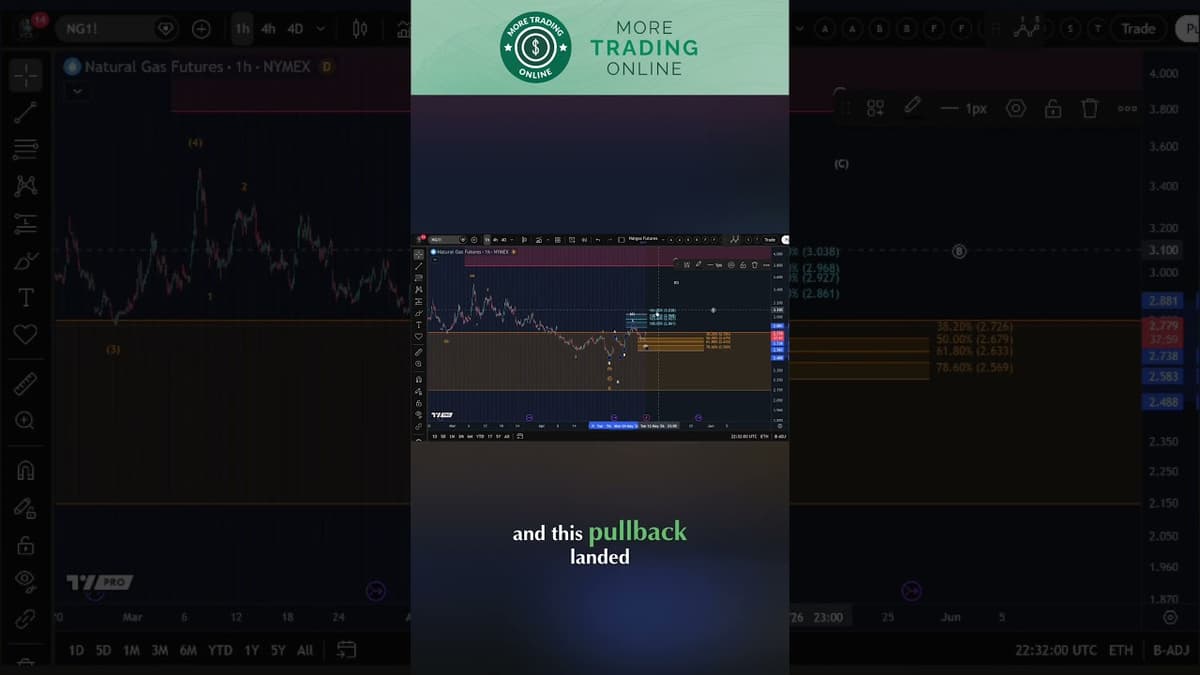
Natgas Natural Gas Technical Analysis Today - Elliott Wave
The video provides a technical breakdown of natural‑gas prices using Elliott Wave theory, highlighting that the market has largely followed the anticipated three‑wave upward trajectory. The analyst revisits the internal C‑wave target, pegged between $2.86 and $3.04 per MMBtu, as the next logical price objective. Key data points include a pullback that landed squarely within the $2.56‑$2.67 support corridor, effectively hitting the 50% Fibonacci retracement of the preceding rally. This corrective move aligns with the expected pattern, confirming that the market is currently in a corrective phase rather than a fresh impulse. The presenter notes that the pullback’s placement “right in the middle of the support zone” validates the earlier forecast and that the ensuing reaction is “not particularly surprising” given the tested support. No extraordinary catalysts were cited, reinforcing the technical narrative. For traders, the analysis suggests that the support area may act as a short‑term floor, offering potential buying opportunities before the next upward impulse wave resumes. Monitoring price behavior around the $2.86‑$3.04 target will be crucial for positioning ahead of the next Elliott Wave cycle.
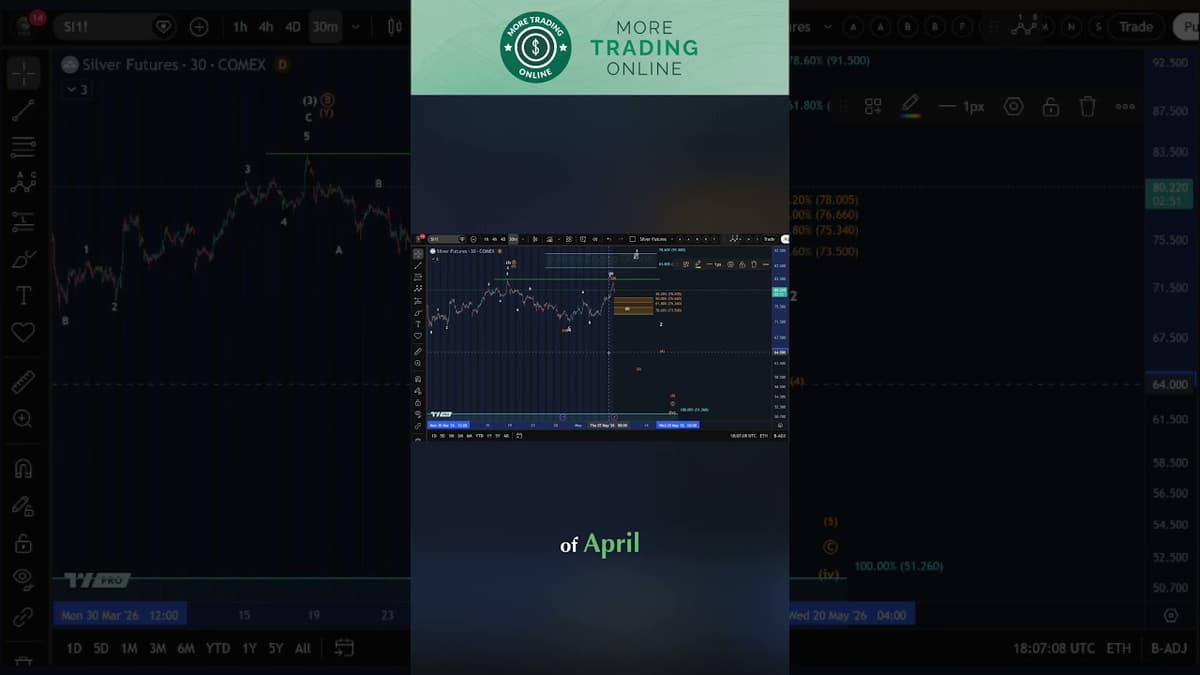
Has Silver Started an Upside Reversal?
Silver’s recent price action is being dissected through Elliott‑wave analysis to determine whether the metal is entering an upside reversal or merely a corrective pullback. The presenter notes that the move resembles a shallow B‑wave within a three‑wave decline, suggesting the...
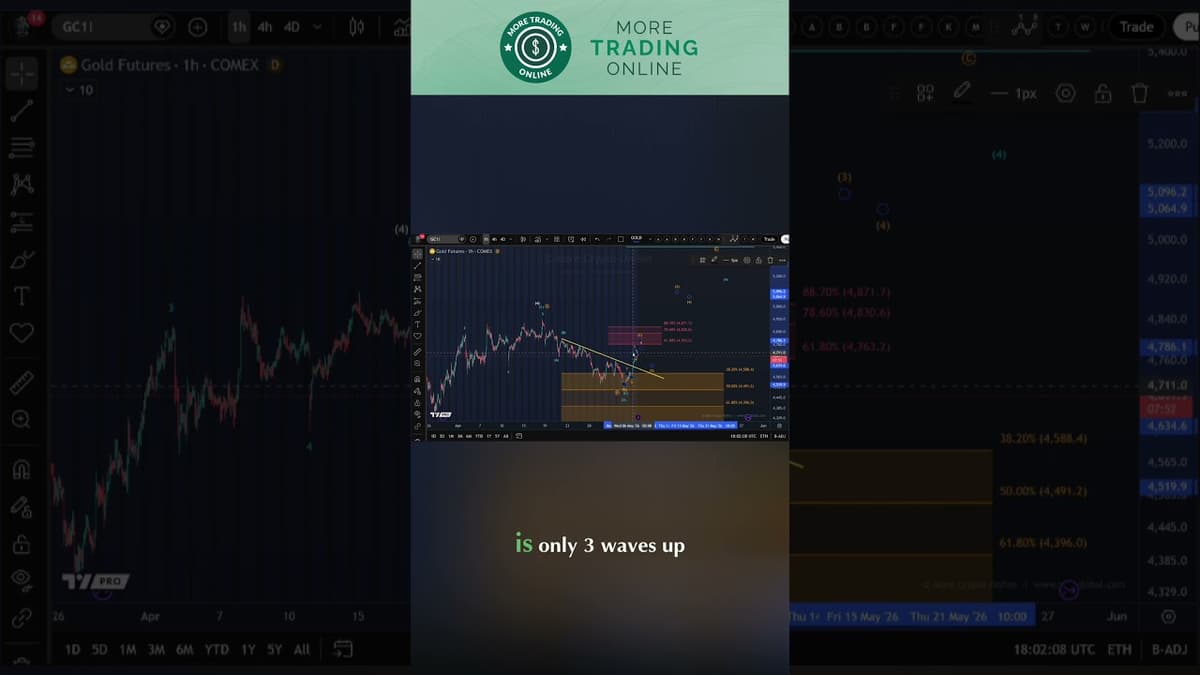
Gold Analysis - Upside Reversal Unfolding?
The video focuses on a technical analysis of gold, highlighting a recent breakout above a yellow trend line on the chart. The analyst evaluates whether this move represents a genuine breakout toward new local highs or a temporary rally, using...
Has Silver Started an Upside Reversal?
The video dissects silver’s price action, arguing the metal is still trapped in a wave‑four correction that began after the January peak. The analyst stresses that the broader Elliott‑wave framework has not shifted since early 2024, leaving the market in...
Has Silver Started an Upside Reversal?
Today's analysis focuses on silver's emerging upside reversal after breaking the yellow trend line. The speaker notes that the breakout triggered a retest overnight, and the market now exhibits renewed strength, suggesting a shift in short‑term bias. Key technical signals include...
WTI & Brent Crude Oil Technical Analysis - Elliott Wave Update
The video provides an Elliott Wave‑based technical read on WTI and Brent crude, questioning whether the recent price pattern forms a bullish triangle or merely a five‑wave decline. The analyst emphasizes that chart interpretation hinges on wave counts and broader...
Gold Analysis - Upside Reversal Unfolding?
The video provides a technical read on gold, focusing on whether the recent price action signals an upside reversal. The analyst notes that gold is trading just below the first resistance band of $4,653 to $4,685 and could, if momentum...
Natgas Natural Gas Technical Analysis Today - Elliott Wave
The video provides an Elliott Wave technical analysis of the natural‑gas market, focusing on the net‑gas chart’s current price action and its proximity to a previously identified signal line. The presenter notes that the downward five‑wave count appears complete, positioning the...
Natgas Natural Gas Technical Analysis Today - Elliott Wave
The video provides a technical analysis of natural‑gas (NG) prices, focusing on Elliott Wave patterns and the imminent test of a $2.75 signal line. The analyst argues that the five‑wave down move is complete, opening the possibility of a bullish...
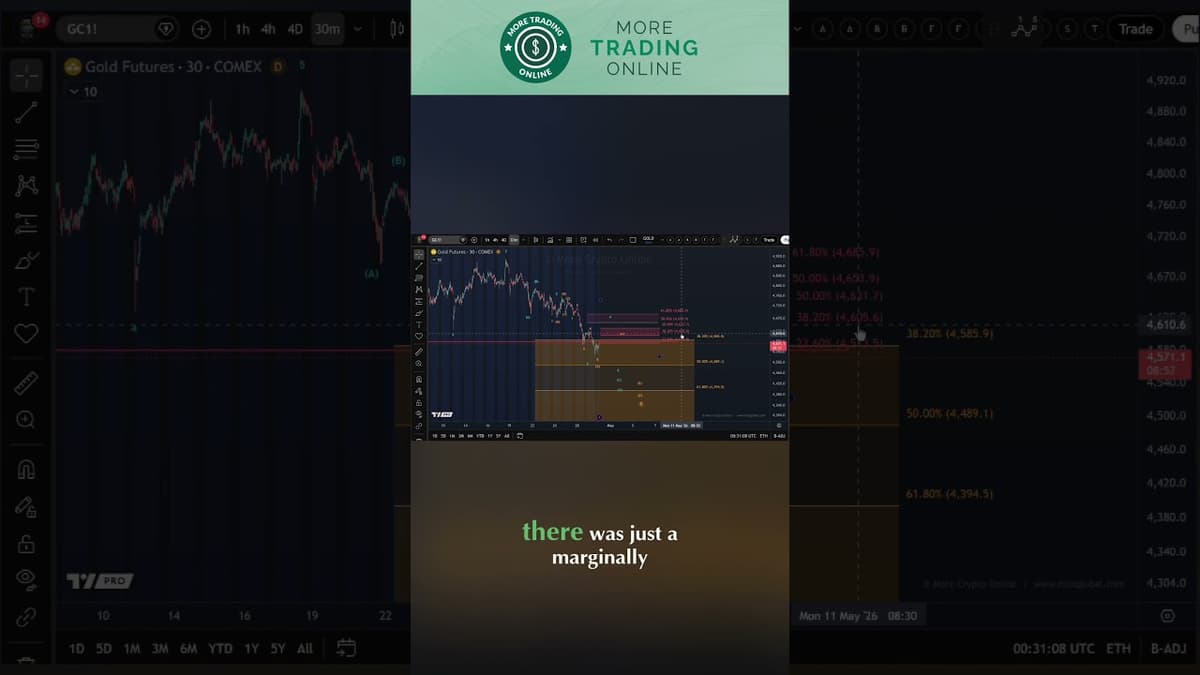
Gold Analysis - Is This the Expected Pullback?
The video provides a technical read on gold, focusing on the recent sell‑off that the analyst labels as wave three of an Elliott‑type pattern. He notes a marginally lower low since his last update, prompting a slight downward shift in the...
Gold Analysis - Is This the Expected Pullback?
The video analyzes gold’s short‑term market structure, focusing on a bearish divergence that has emerged on the four‑hour chart and identifying key resistance levels that could shape the next price move. Technical data show the price making higher highs while the...
Gold Price Consolidation: Key Support Zone Revealed
The video focuses on gold’s current consolidation phase, highlighting a critical support zone that could dictate the next price direction. Analysts note that the market’s reaction to the 4,671 level—set by Friday’s low—will be pivotal in determining whether gold resumes...
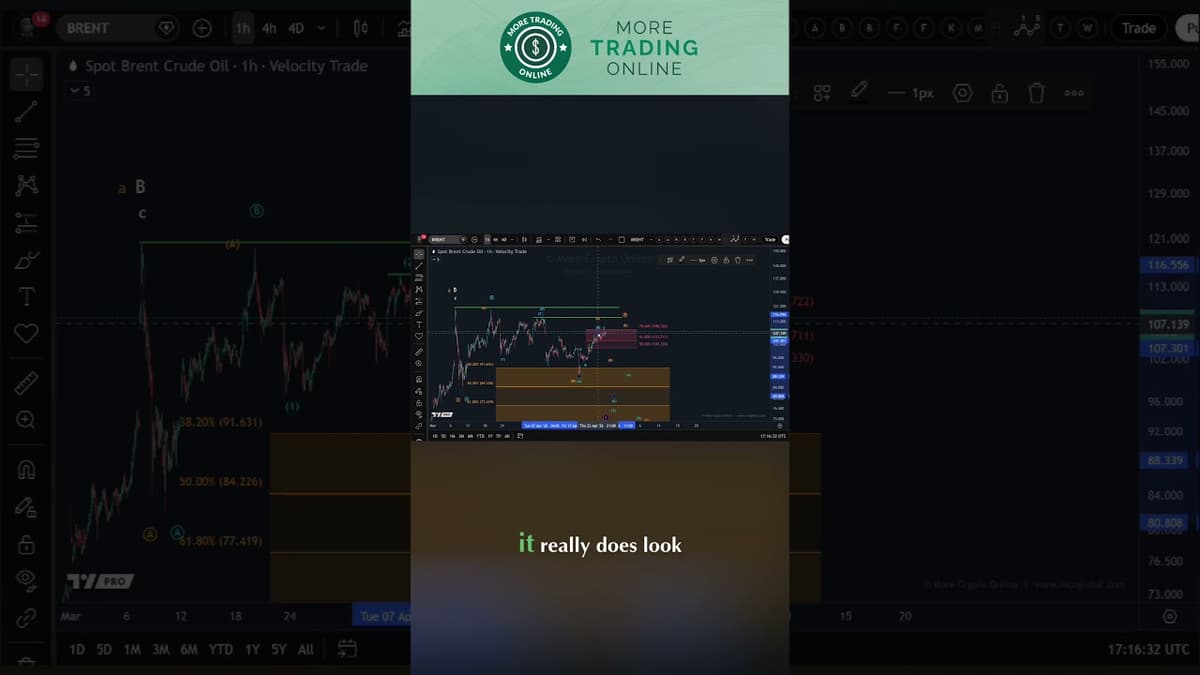
WTI & Brent Crude Oil Technical Analysis - Elliott Wave Update
The video provides an Elliott Wave‑based technical outlook for WTI and Brent crude, highlighting current price structures and the analyst’s scenario counts. The analyst identifies WTI’s primary support between $69.90 and $85.50, while Brent appears to be executing a three‑wave upward...
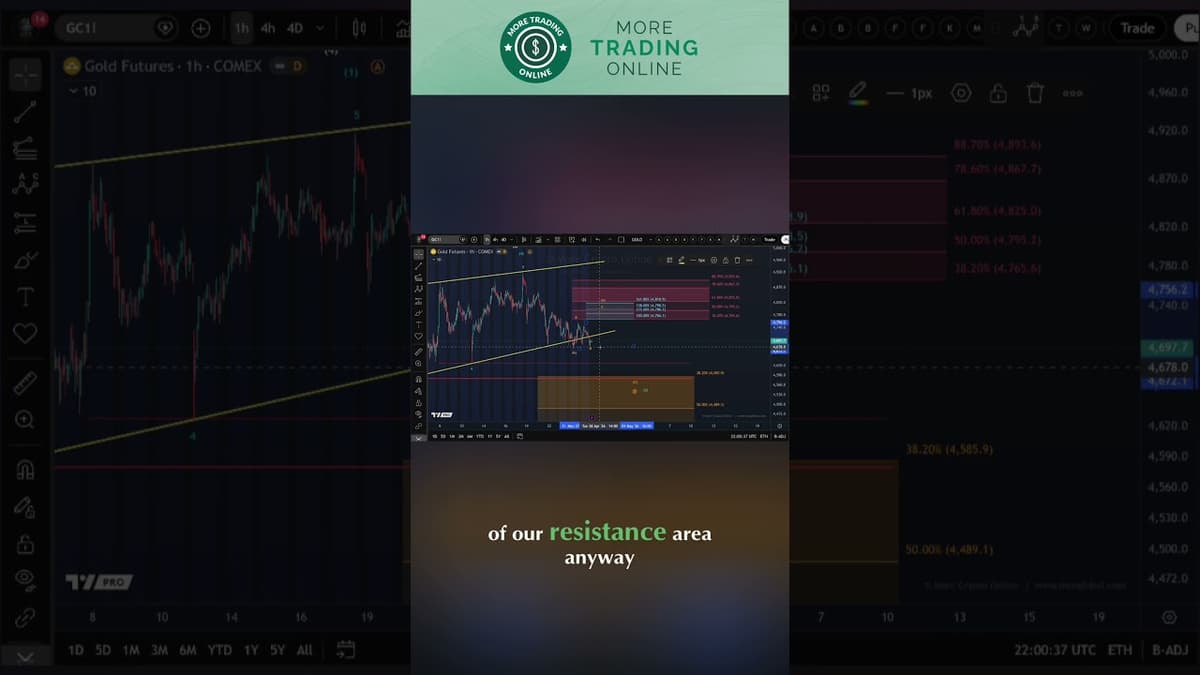
Gold Price Analysis: Key Levels For Next Week
The video provides a technical snapshot of gold’s price action, noting a quiet trading day with little movement. Analysts highlight that the market continues to sit within a wedge pattern, and although the lower trend line was briefly pierced, the...
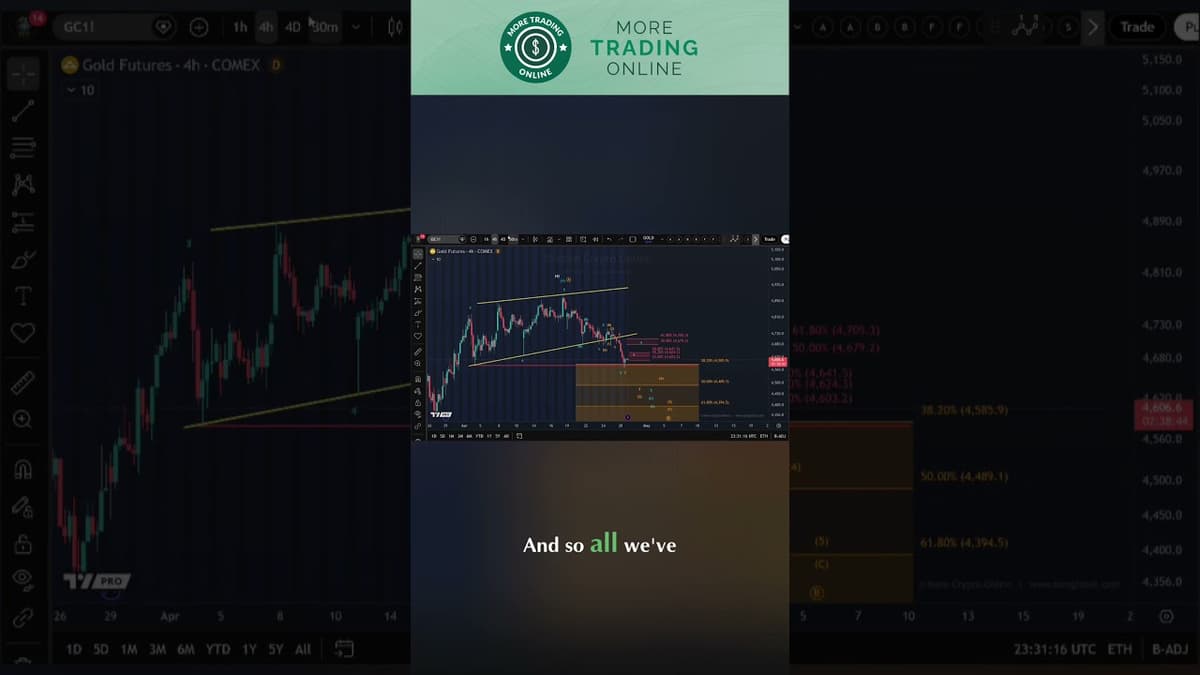
Gold Analysis - This Rally Might Not Last
The video focuses on gold’s recent price action, which remains confined within a classic wedge pattern on the 4‑hour chart. Traders have not witnessed a decisive break below the lower trend line, leaving the market in a holding pattern. While the...
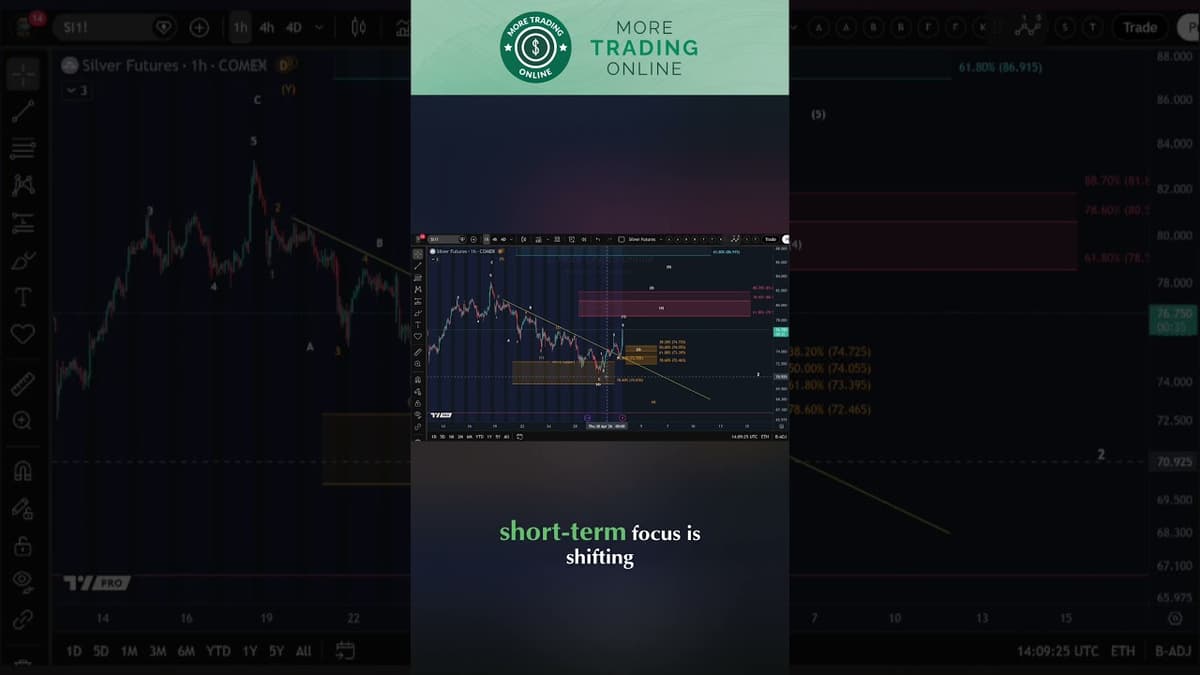
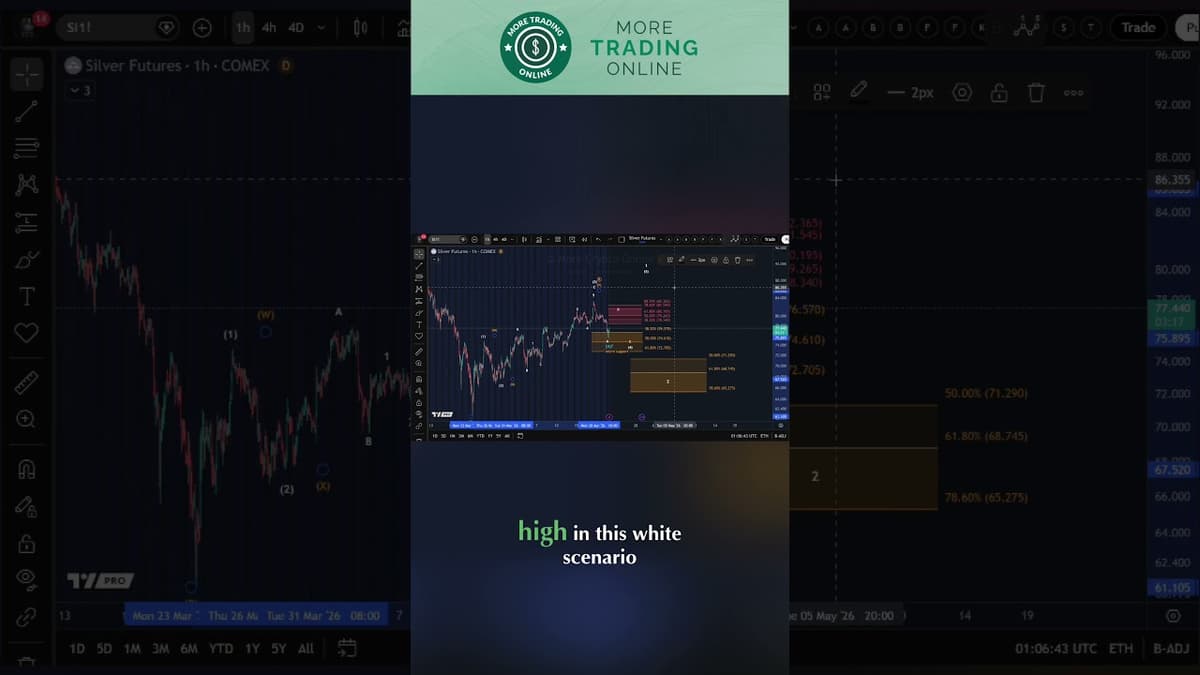
Has Silver Started the Next Decline?
The video provides a technical read on silver, focusing on whether the metal is entering a new decline. The analyst maps the current price action against a $72.70‑$76.57 micro‑support zone and a broader trend‑channel lower boundary. He notes that silver remains...
Has Silver Started the Next Decline?
The video analyzes the recent silver price action, noting that the chart has entered a pullback that began on Friday and continues today. Technical analysis shows the price testing a previously identified resistance level before sliding into a support zone. However,...
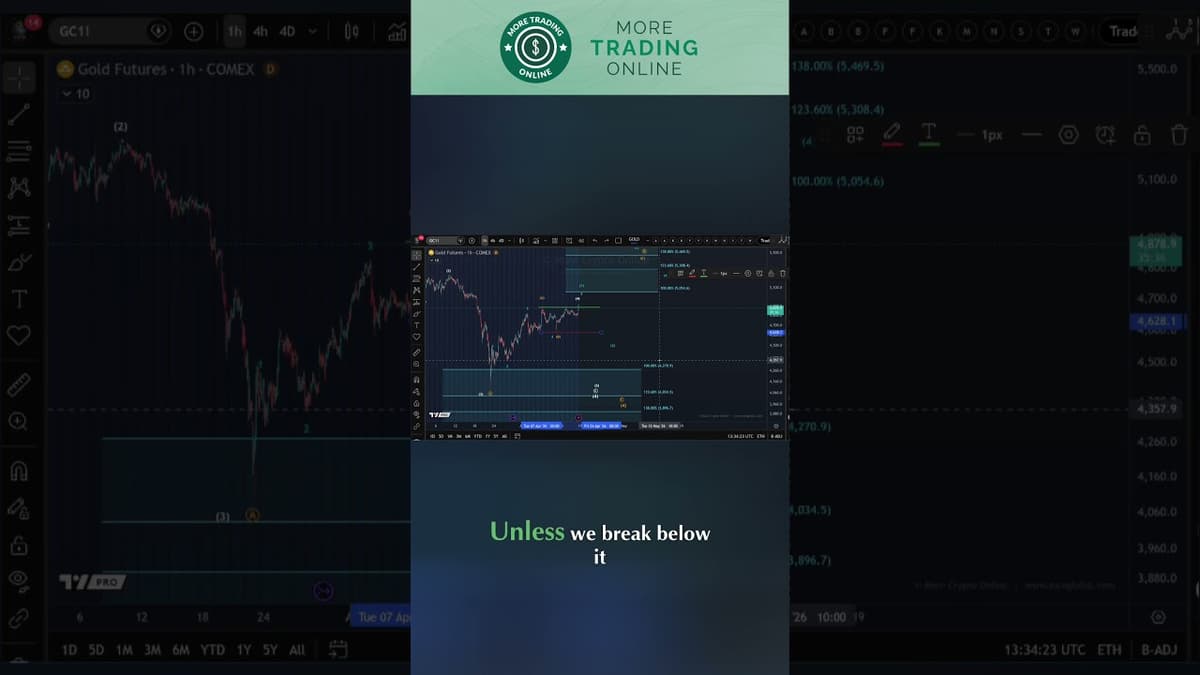
Gold Analysis - This Rally Might Not Last
The video provides a technical assessment of gold, warning that the recent rally may be short‑lived unless a key price level is breached. The analyst centers the discussion on a $4,750 threshold, stating that only a break below this mark...
Has Silver Started the Next Decline?
The video examines whether silver is poised for its next major correction, focusing on recent technical patterns and price action. The analyst notes that the bullish momentum that emerged at the end of March persists, with the metal charting higher...
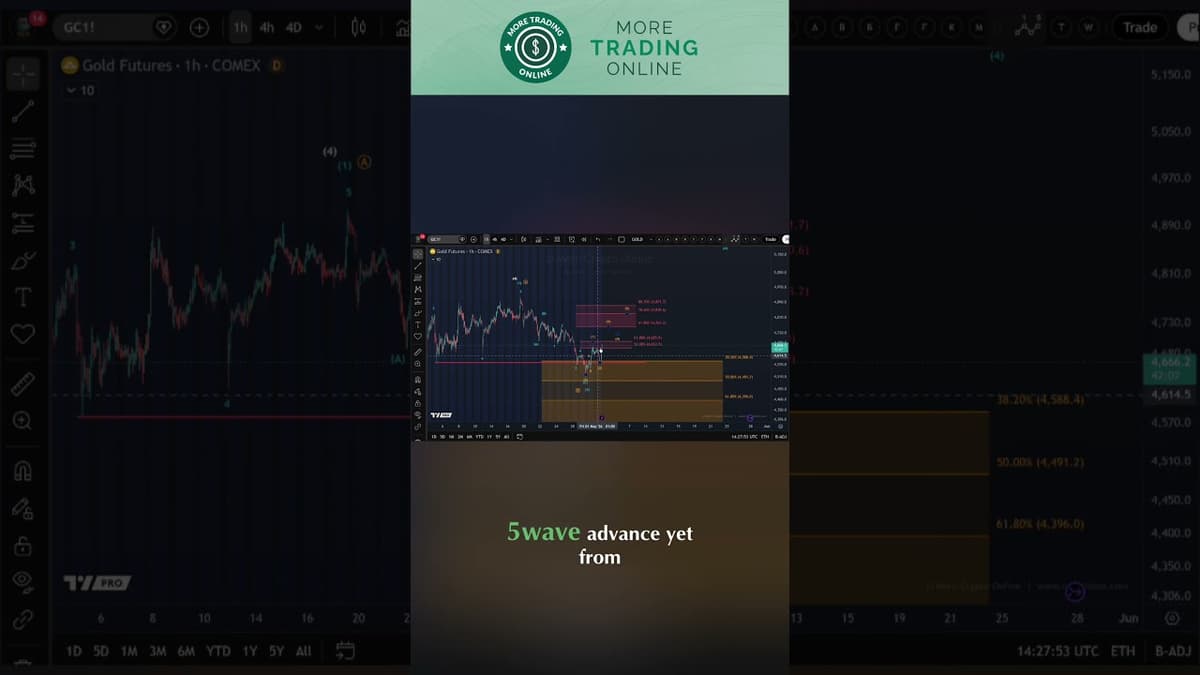
Gold Analysis - This Rally Might Not Last
The video focuses on a technical analysis of gold, questioning whether the current rally can be sustained. Using Elliott Wave theory, the presenter outlines a potential five‑wave advance but stresses that the pattern remains uncertain without a decisive breakdown. Key insights...

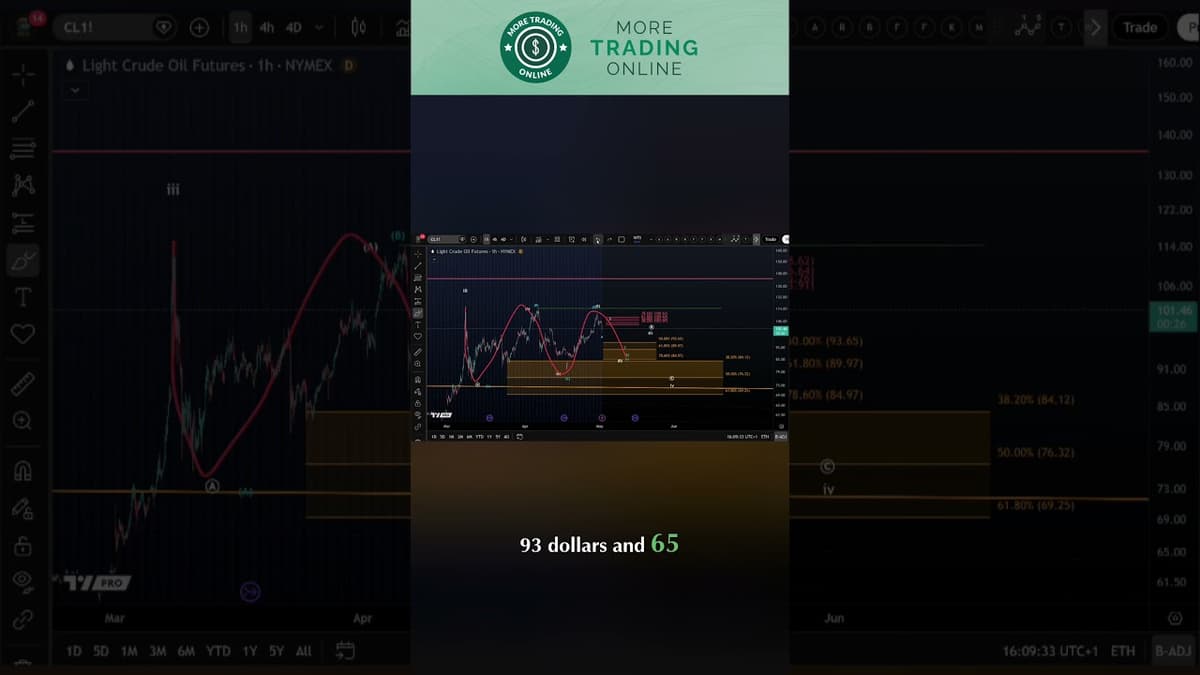
Brent & WTI: Has a Top Formed?
The video dissects current price action in WTI and Brent crude, asking whether a top has formed. It maps short‑term pullbacks against longer wave structures and highlights key Fibonacci‑derived support and resistance zones. Key insights include WTI’s descent to the first...

Has Silver Started the Next Decline?
The video examines silver’s current market dynamics, highlighting that the metal is consolidating below the $81 resistance level and showing no decisive upward momentum. The analyst points to an ascending wedge pattern and overlapping price action as signs that the...

Gold Analysis - This Rally Might Not Last
The video provides a technical update on gold, noting that the price is currently moving sideways as it nears a key breakout level marked by a green line on the chart. The analyst emphasizes that there is no confirmed breakdown; the...

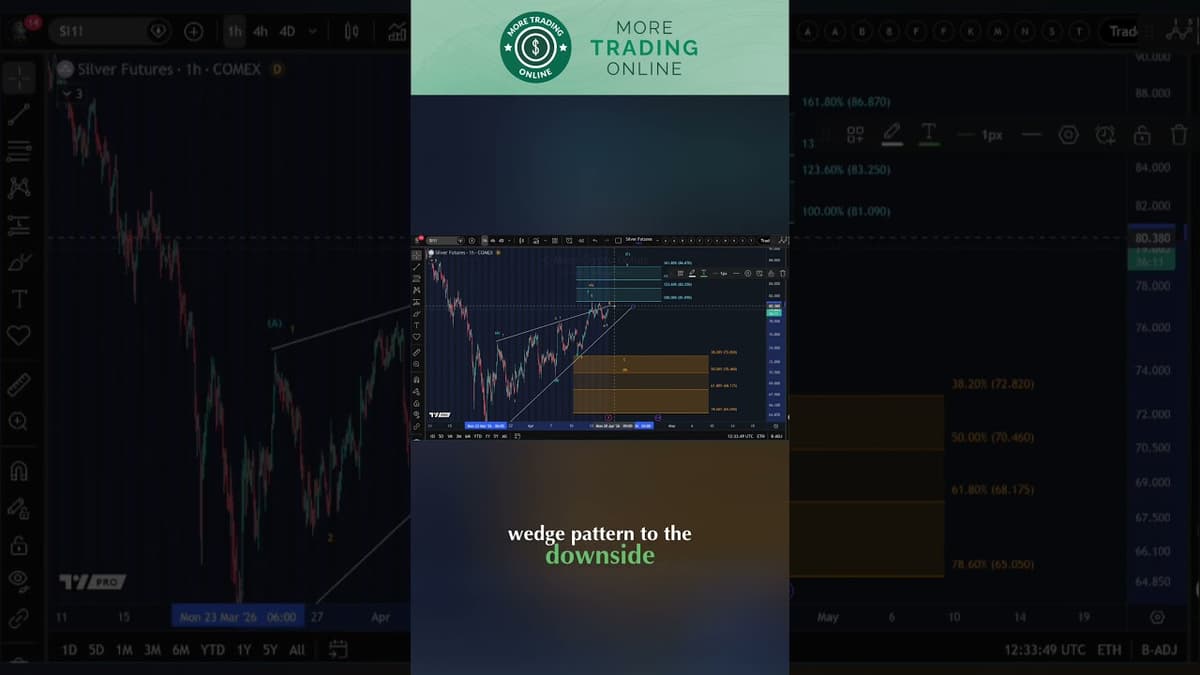
Has Silver Started the Next Decline?
The video dissects silver’s current technical landscape, focusing on a descending wedge formation and an Elliott‑wave diagonal that could dictate the metal’s next move. The analyst warns that such wedge patterns frequently produce false upward spikes before a sharper decline,...

Brent & WTI: Has a Top Formed?
The video examines whether Brent and WTI crude have capped a short‑term top. Analysts note the recent rally fits a classic three‑wave corrective bounce rather than a new bullish trend. They stress that forecasting oil prices is precarious, with the market...

S&P 500 Technical Analysis Major Decision Point, Elliott Wave Analysis Today and Price of S&P500 SPX
The video provides a technical update on the S&P 500, focusing on a pivotal decision point after a roughly 10% rally from the March low. The analyst ties the price action to Elliott Wave theory, suggesting the recent advance may...

Gold Analysis - This Rally Might Not Last
Gold analyst argues the current rally is likely a Wave 4 correction that may not sustain. He emphasizes looking at higher‑timeframe charts each weekend, arguing that short‑term 30‑minute moves are less relevant for the broader trend. The recent mini‑crash tested the $4,240...

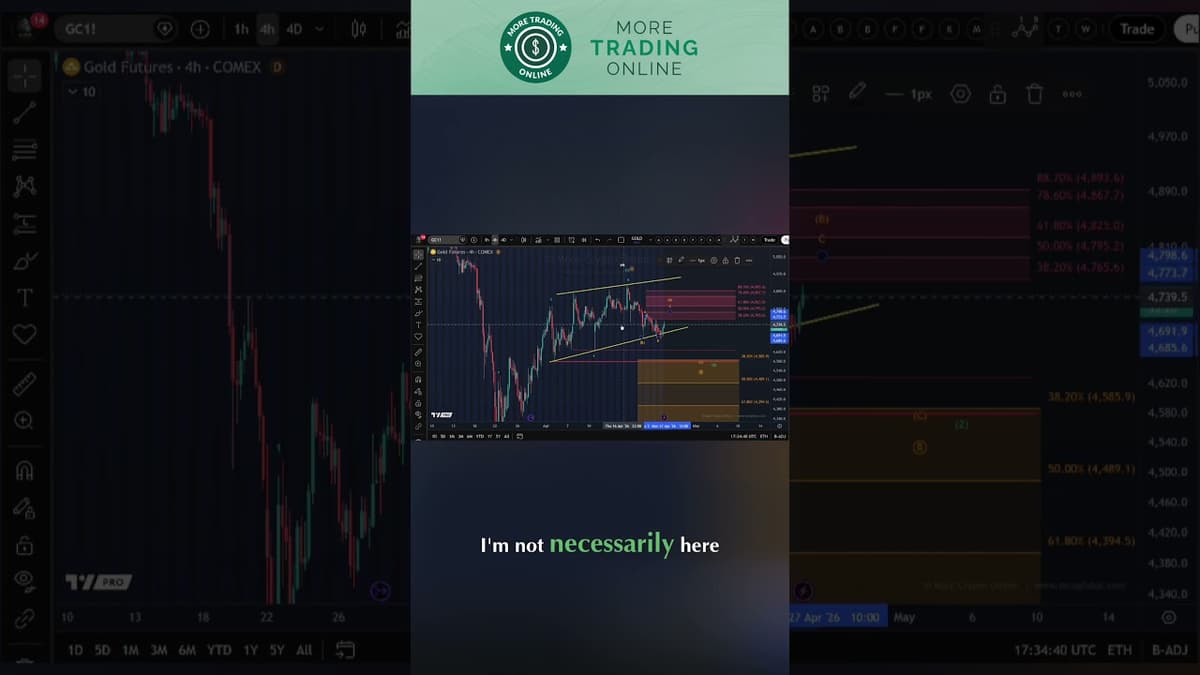
Copper Elliott Wave Analysis: Big Picture Structure Through 2026
The video provides an Elliott‑wave outlook for copper futures, arguing that the market has likely completed its wave‑four correction and is poised for a new upward leg that could extend through 2026. Using Fibonacci analysis, the presenter identifies a critical support...

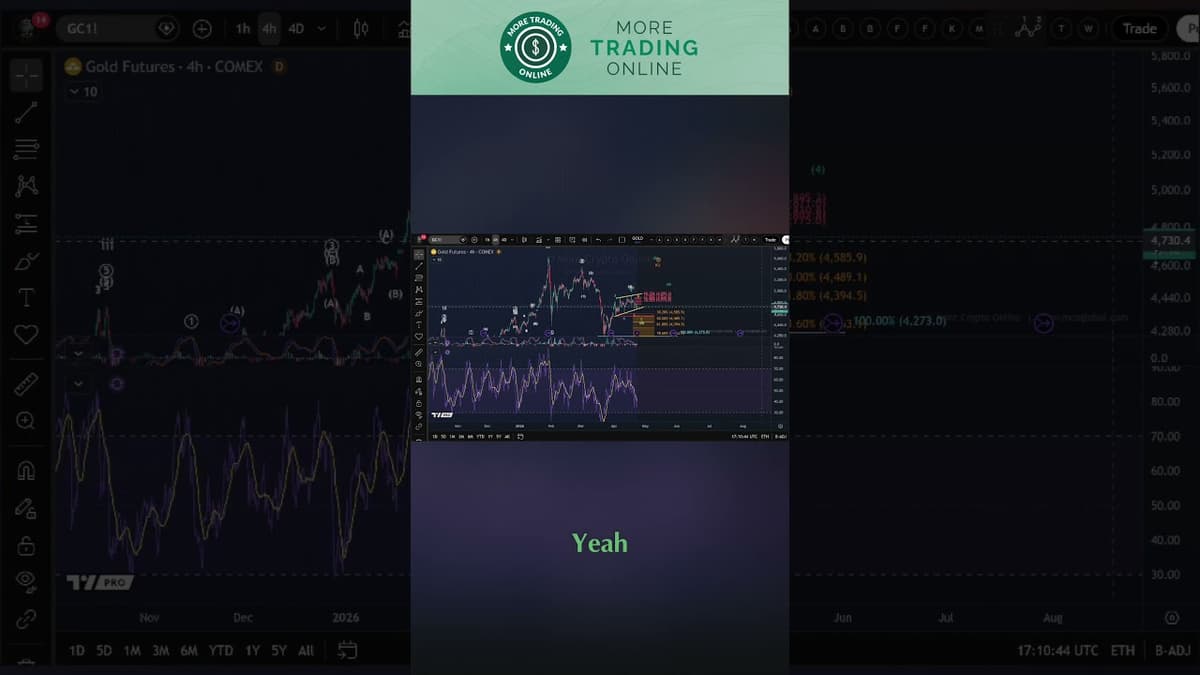
Silver Long-Term Roadmap | Elliott Wave Analysis Weekly Chart
The video focuses on the weekly Relative Strength Index (RSI) for silver, highlighting its position at the pivotal 50‑point level. The analyst ties this technical reading to the broader Elliott Wave framework, noting that the 50 mark often separates bullish...

S&P 500 Technical Analysis Major Decision Point, Elliott Wave Analysis Today and Price of S&P500 SPX
The video focuses on a technical read of the S&P 500, highlighting a recent break above a yellow trendline that the analyst had flagged as a likely bounce. By referencing his prior analysis, he confirms the move aligns with expectations...

Gold Analysis - This Rally Might Not Last
The video provides a short‑term technical update on gold, focusing on whether the recent breakout above the April 1 swing high can sustain momentum. The analyst maps the price action onto Elliott‑wave labels, emphasizing that the crucial factor is price staying...

Has Silver Started the Next Decline?
Silver traders received a brief technical update, focusing on the metal’s recent failure to breach a micro‑resistance level and its continued confinement within a broader resistance zone. The analyst noted that while a three‑wave decline has unfolded, it does not...

Gold Analysis - Has the Breakout Attempt Failed?
The video examines gold’s ongoing corrective phase that began in January, outlining an Elliott‑wave‑style A‑down, B‑up, C‑down pattern and suggesting the market may be approaching the final leg of this move. The analyst notes that if another low materialises, price could...

Gold Analysis - Has the Breakout Attempt Failed?
The video analyzes whether gold's recent breakout attempt has failed, focusing on the $4,780 resistance cluster as a decisive level that could confirm a meaningful low and set up a bullish C‑wave toward $5.50. The analyst notes a clear three‑wave corrective...

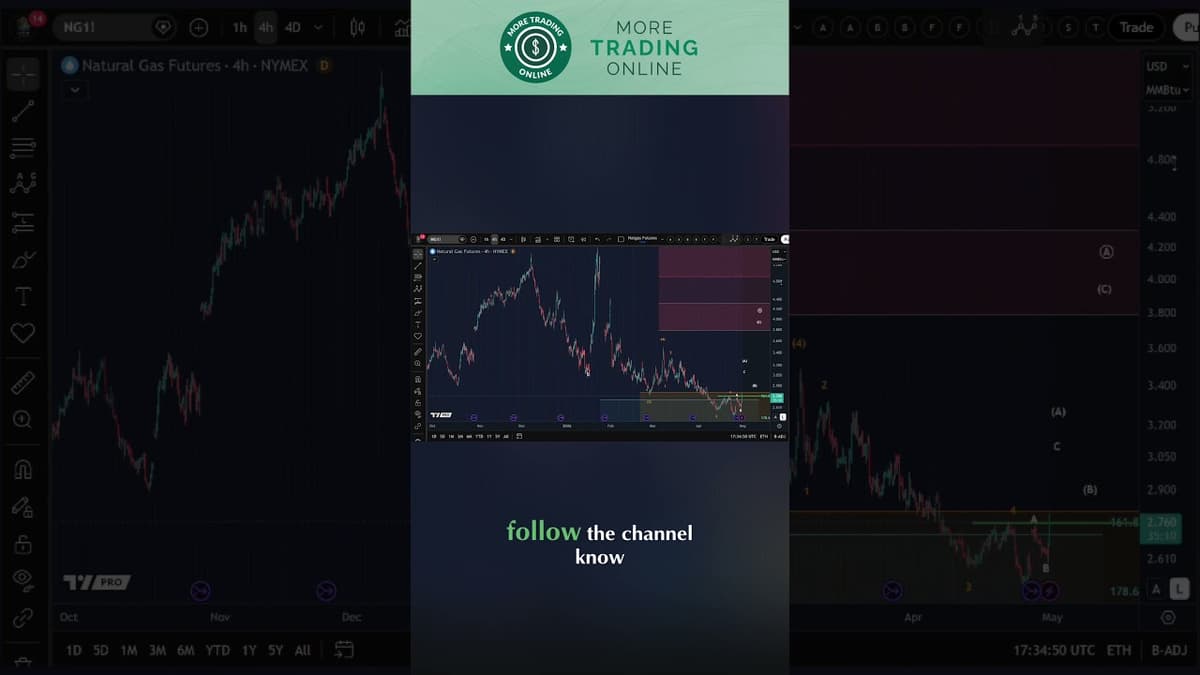
Natgas Natural Gas Technical Analysis Today - Elliott Wave and Price News
The video provides a technical read on natural‑gas futures, focusing on Elliott Wave structures and key price levels. The analyst notes that the market has yet to post a decisive lower low beneath the February trough, and a clear bottom...

Gold Analysis - Has the Breakout Attempt Failed?
The video provides an update on gold, centering on the gold‑silver ratio, a member’s question, and an Elliott wave analysis of recent price action. Since the March 23 low, gold has completed a three‑wave upward move, which the presenter interprets as...

Gold Chart Analysis Today: Key Support Levels Based on Elliott Wave Analysis
The video provides an Elliott Wave‑based technical update on gold, focusing on whether the metal is poised for a five‑wave bullish rally or approaching a top. The analyst notes that gold has broken its initial trend line, raising the odds...

WTI & Brent Crude Oil Technical Analysis - Elliott Wave Update
The video provides an Elliott‑wave‑based technical update on both WTI and Brent crude, focusing on current pull‑backs and the levels that could dictate the next move. For WTI, the analyst identifies a micro‑support zone between $96.11 and $96.12. As long as...

WTI & Brent Crude Oil Technical Analysis - Elliott Wave Update
Analysts reviewed WTI and Brent crude using Elliott Wave theory, highlighting immediate resistance and Fibonacci targets for the coming week. The discussion centered on a potential breakout above a green trend line, which would open the path to four key...

Silver Long-Term Roadmap | Elliott Wave Analysis Weekly Chart
The video provides a weekly Elliott Wave analysis of silver, focusing on whether the market will produce one more low to complete an ABC correction and what that means for price targets. The analyst notes that the correction that began after...

Gold Chart Analysis Today: Key Support Levels Based on Elliott Wave Analysis
The video provides an Elliott Wave‑based technical outlook on gold, focusing on whether the broad correction that began in January is nearing its end. The analyst identifies a resistance corridor between $4,780 and $4,510 that the price is currently testing. He...

WTI & Brent Crude Oil Technical Analysis - Elliott Wave Update
The video provides a technical update on WTI and Brent crude, linking recent price movements to both Elliott Wave analysis and emerging geopolitical news. The host notes that U.S. oil prices slipped after reports of a one‑month cease‑fire negotiation with...

Gold Chart Analysis Today: Key Support Levels Based on Elliott Wave Analysis
The video provides a technical update on gold, focusing on Elliott Wave analysis and the chart’s movement into a key support zone. The presenter identifies the current pattern as an A‑wave down, B‑wave up, and C‑wave down, noting that the C‑wave...

Gold Chart Analysis Today: Key Support Levels Based on Elliott Wave Analysis
The video delivers a technical update on gold, centering on Elliott Wave analysis and the current pull‑back into a defined micro‑support zone. The presenter reiterates the prevailing wave count—an A‑wave down, B‑wave up, and C‑wave down—while highlighting that the C‑wave’s...

Platinum Market Structure – Upside Reversal Incoming? Elliott Wave Analysis
The video provides an Elliott Wave analysis of the platinum market, focusing on the current wave‑four correction and the projected path toward a potential upside reversal. The presenter argues that platinum is in the C‑wave of an ABC correction, with...

Gold Chart Analysis Today: Key Support Levels Based on Elliott Wave Analysis
The video provides an Elliott Wave‑based technical outlook on gold, emphasizing that the metal is still navigating a corrective phase rather than launching a fresh rally. The analyst walks viewers through the current chart pattern, highlighting a five‑wave decline that...

Gold Chart Analysis Today: Key Support Levels Based on Elliott Wave Analysis
The video provides a quick technical update on gold, focusing on Elliott Wave analysis and the gold‑silver ratio to gauge near‑term direction. The presenter argues that gold is likely at the start of a third‑wave decline, with current support holding but...

Gold Chart Analysis Today: Key Support Levels Based on Elliott Wave Analysis
Gold analysts examined the current Elliott Wave structure on the gold chart, arguing that wave B has likely peaked while the anticipated third wave remains unconfirmed. The discussion centered on a one‑two pattern that traditionally signals short positions when pointing...

Platinum Market Structure – Upside Reversal Incoming? Elliott Wave Analysis
The video delivers a detailed Elliott Wave and technical analysis of platinum (XPT), highlighting the current market structure and pinpointing major support around $850 and resistance near $1,000 per ounce. It outlines both bullish and bearish scenarios, suggesting an upside...

Gold Chart Analysis Today: Key Support Levels Based on Elliott Wave Analysis
The video delivers a professional Elliott Wave and technical analysis of gold, outlining the current price structure and identifying key support and resistance zones. It examines short‑term setups and projects mid‑ to long‑term scenarios based on wave counts. Viewers receive...