
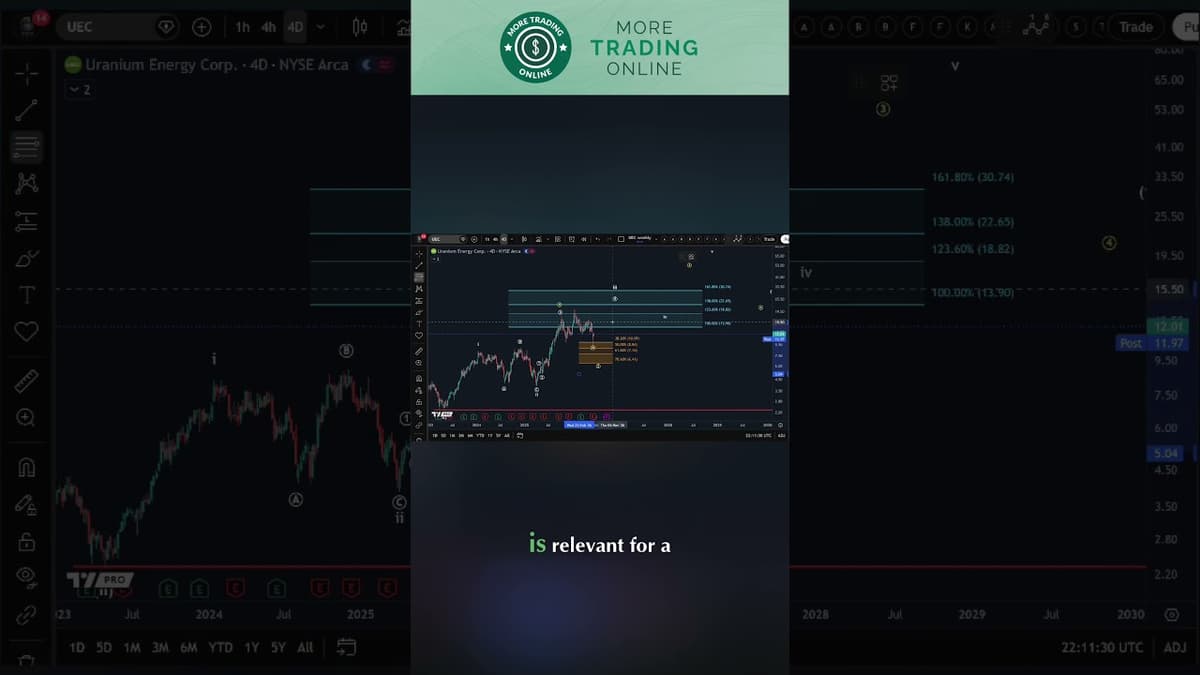
Uranium Energy | Wave Analysis & Future Price
The video dissects uranium’s price trajectory through Elliott Wave theory, proposing that the market is riding a larger third wave that originated in 2020. After a secondary wave completed in 2023, the sector entered a corrective phase in October 2025, now manifesting as a three‑wave decline. Key data points include a potential wave‑four corrective low near $9.40 per pound and a deeper wave‑two scenario that could push prices toward the 61.8%–78.6% Fibonacci retracement zone between $6.94 and $5.38. The analyst stresses that a decisive break below $9.40 would shift the wave count, opening the door to a more pronounced pullback. The presenter emphasizes, “If we break decisively below $9.40 it should be rather the wave two scenario,” underscoring the importance of that price threshold. The discussion also references the golden‑ratio retracements as critical technical markers for gauging the lower support. Implications are clear: investors should monitor the $9.40 level closely, as it determines whether uranium will stabilize or face a steeper decline, influencing mining stocks, ETFs, and contracts tied to the commodity’s price.
Is the IONQ Correction Ending? Key Support Levels Explained
The video provides a technical breakdown of IONQ’s recent price correction, outlining two possible bullish scenarios and the key support‑resistance levels that could shape the stock’s short‑term trajectory. Using Elliott Wave analysis, the presenter identifies a three‑wave decline from the October 2025...
Is the Natural Gas Correction Ending Here?
The video examines the ongoing correction in natural gas prices through Elliott Wave theory, zeroing in on whether the market is concluding its recent downtrend. The analyst emphasizes the importance of the $2.66‑$3.01 Fibonacci support zone as a decisive level...

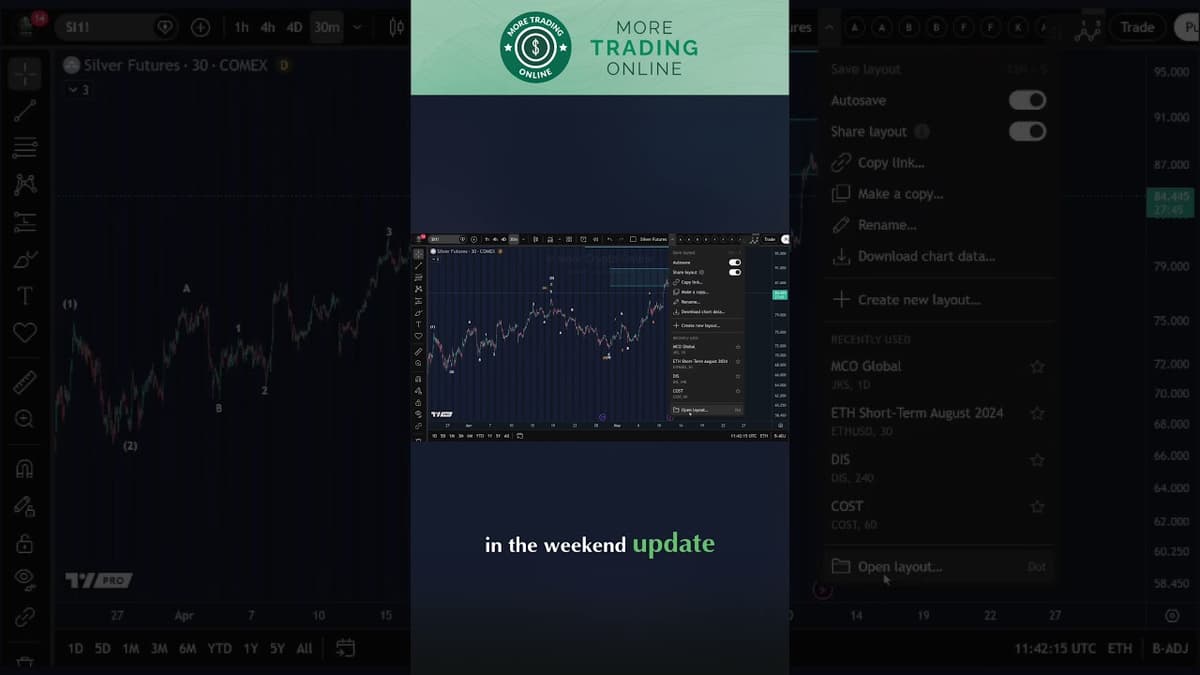
Silver Support Levels: Critical Spots for the Week Ahead
Silver experienced a sharp sell‑off this week, dropping roughly 15% from recent highs and testing the $50 support level. The video breaks down the current Elliott Wave structure, highlighting a potential corrective wave and several key resistance zones. The presenter...
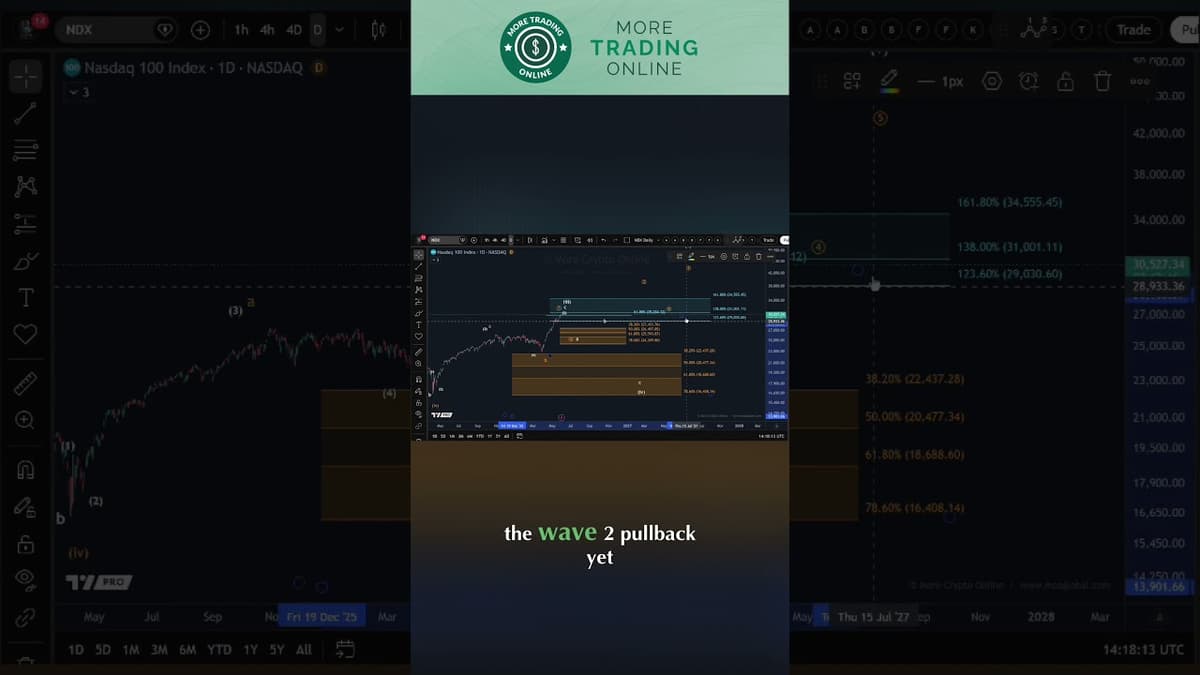
NASDAQ Technical Analysis Update - Elliott Wave Analysis
The video provides an Elliott Wave technical update on the Nasdaq, focusing on the current wave count and potential price targets. Analysts maintain the existing wave structure, noting that the index is still in an up‑trend that could eventually breach the...
Silver Analysis: Next Bounce Incoming? Elliott Wave Analysis
The video provides an Elliott Wave analysis of silver, outlining its current price corridor between a four‑day support zone of roughly $49‑$60 and an upper resistance band near $86‑$90. The analyst maintains that silver is still in a wave‑four correction that...
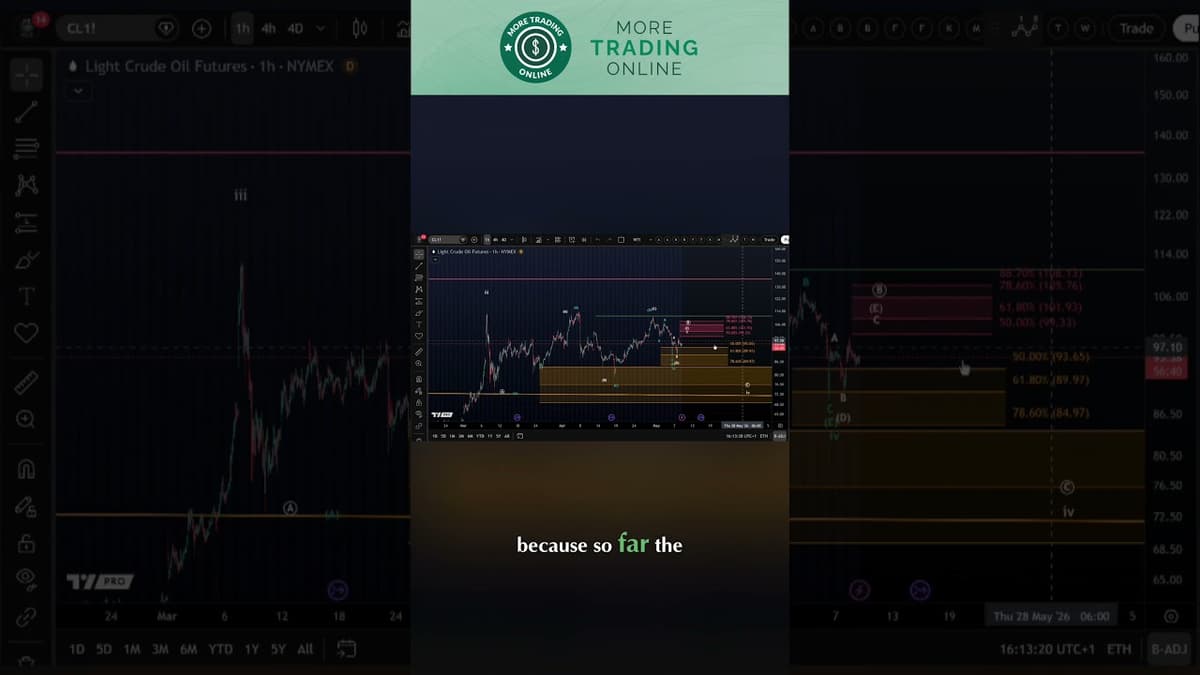
Is the Oil Market Preparing for a Direct Upside Breakout?
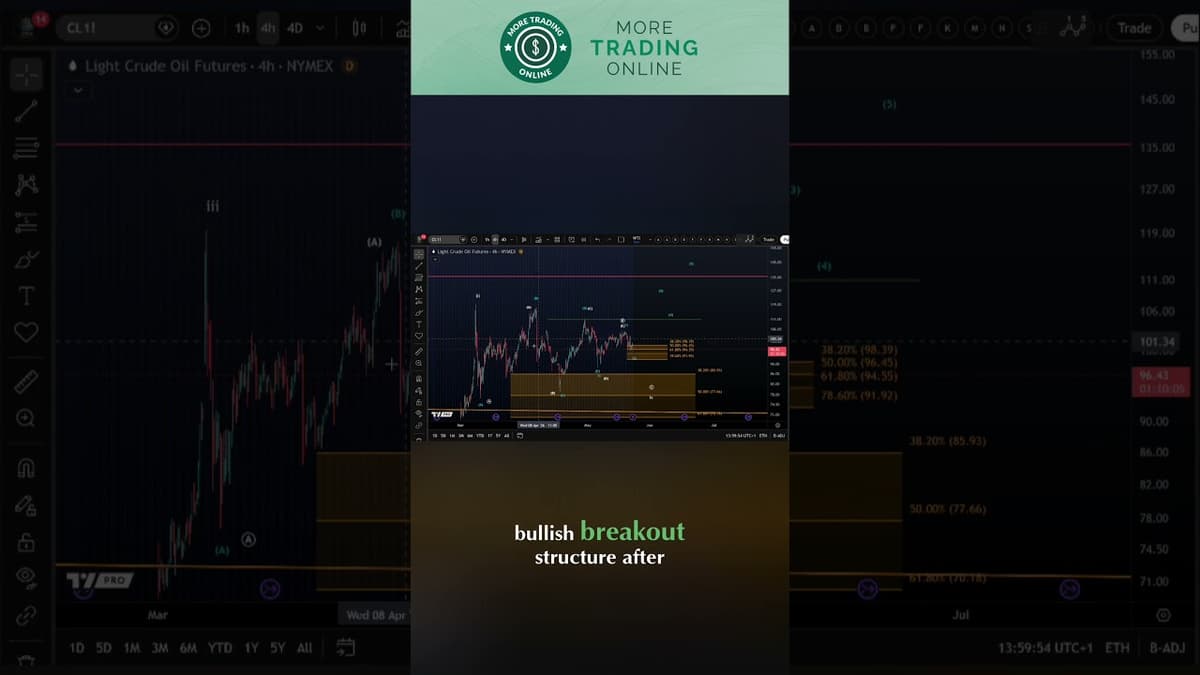
The video examines whether the oil market is primed for a direct upside breakout, focusing on the WTI chart and briefly referencing Brent. After a recent rally, the market has entered a corrective pullback that is testing a micro‑support zone...
Is the Oil Market Preparing for a Direct Upside Breakout?
The video analyzes current oil market technicals, focusing on WTI and Brent charts after a recent pullback, exploring potential bullish breakout scenarios. The presenter outlines two primary Elliott‑wave‑based pathways: a “blue” five‑wave advance from the May low near $88.50 that could...
Silver Breakdown: The Key Zone I’m Watching to Buy
The video analyzes the recent sharp sell‑off in silver, a roughly 15% drop on Friday that marked the largest red candle since early March, and frames it within an Elliott wave perspective. The presenter argues that silver remains in wave‑four of...
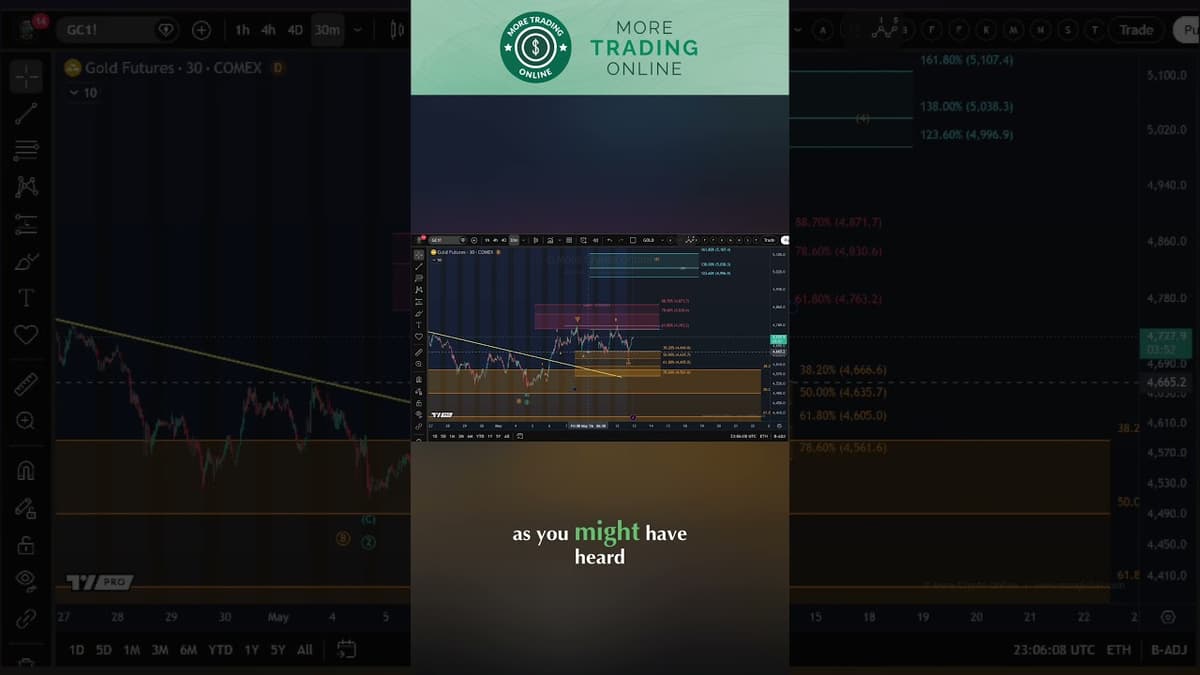
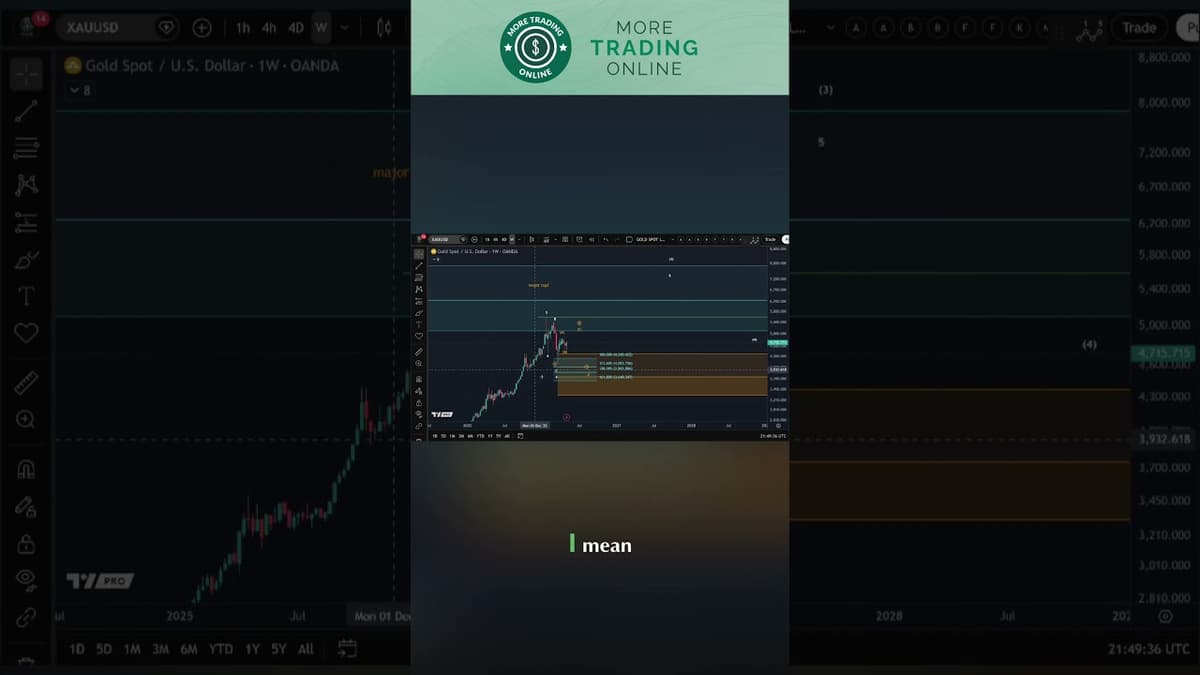
Gold Analysis - Upside Reversal Unfolding?
The video provides a technical analysis of gold, focusing on today’s price action that briefly slipped below Monday’s low before retaking the primary support zone around $4,645. The analyst frames the dip as a liquidity grab and questions whether it...
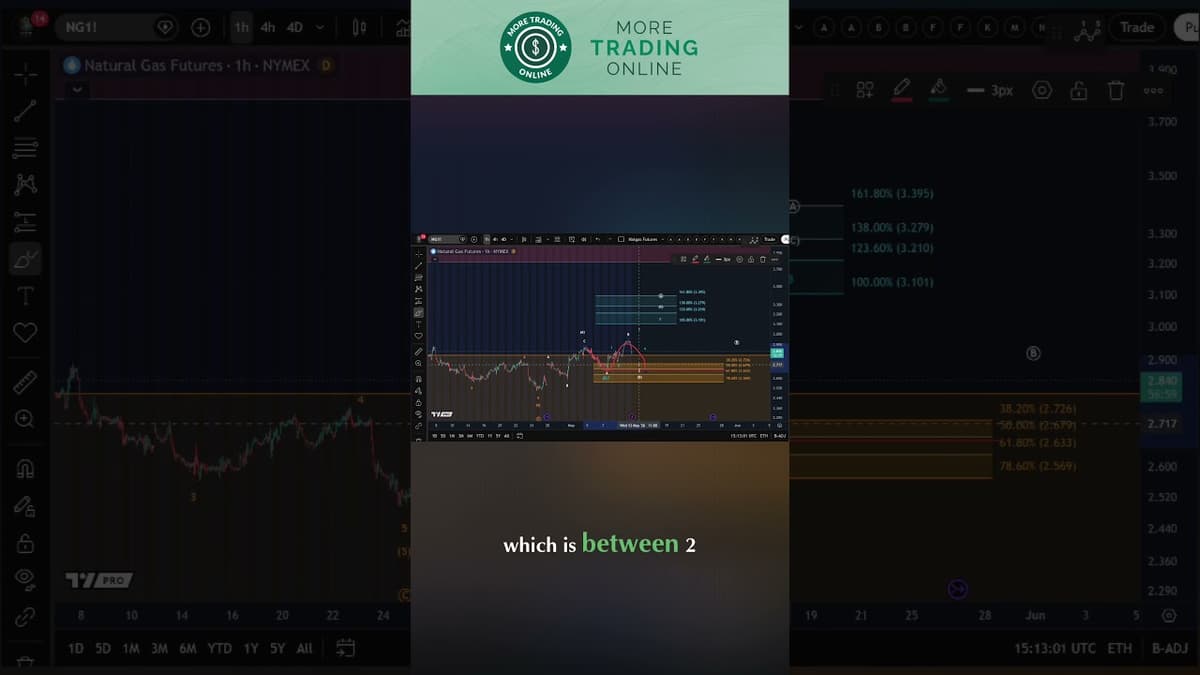
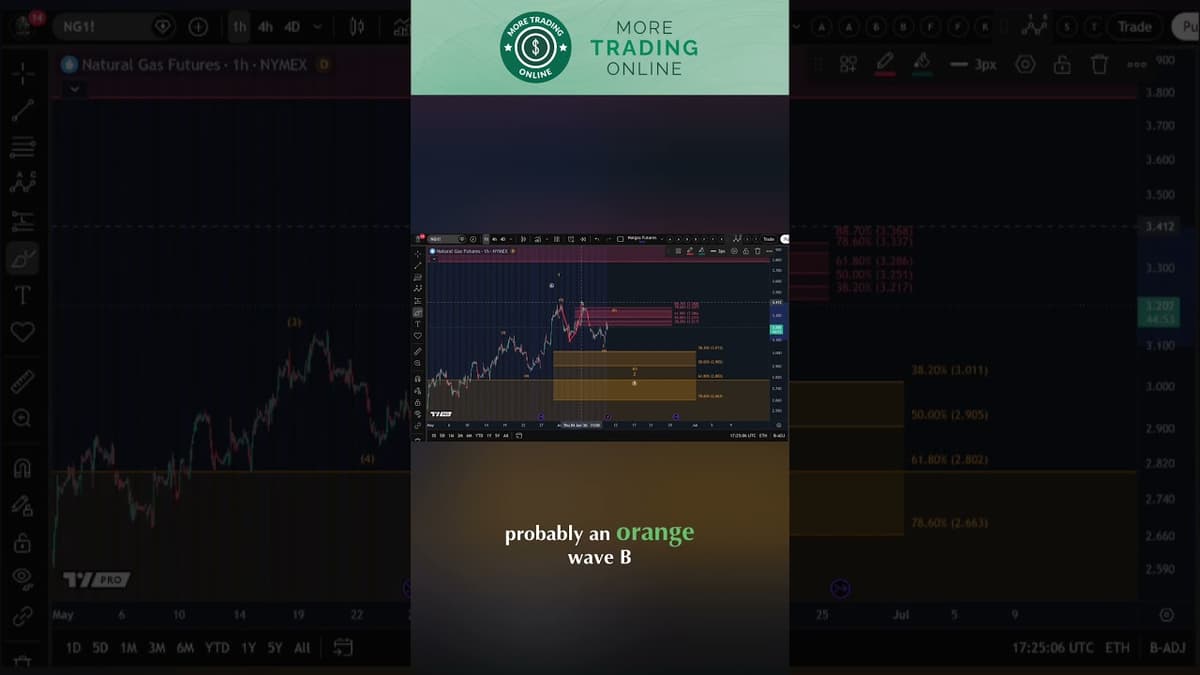
Natgas Natural Gas Technical Analysis Today - Elliott Wave
The video provides an Elliott‑wave technical read on natural‑gas prices, focusing on the recent upward bounce that began on May 7. The analyst argues that the move may be a corrective B wave rather than the start of a new bullish...
Has Silver Started an Upside Reversal?
The video focuses on silver’s price chart, applying Elliott Wave theory to assess whether the metal is entering an upside reversal. The analyst notes that silver has reached the "blue target zone" associated with a potential fifth wave, a bullish...
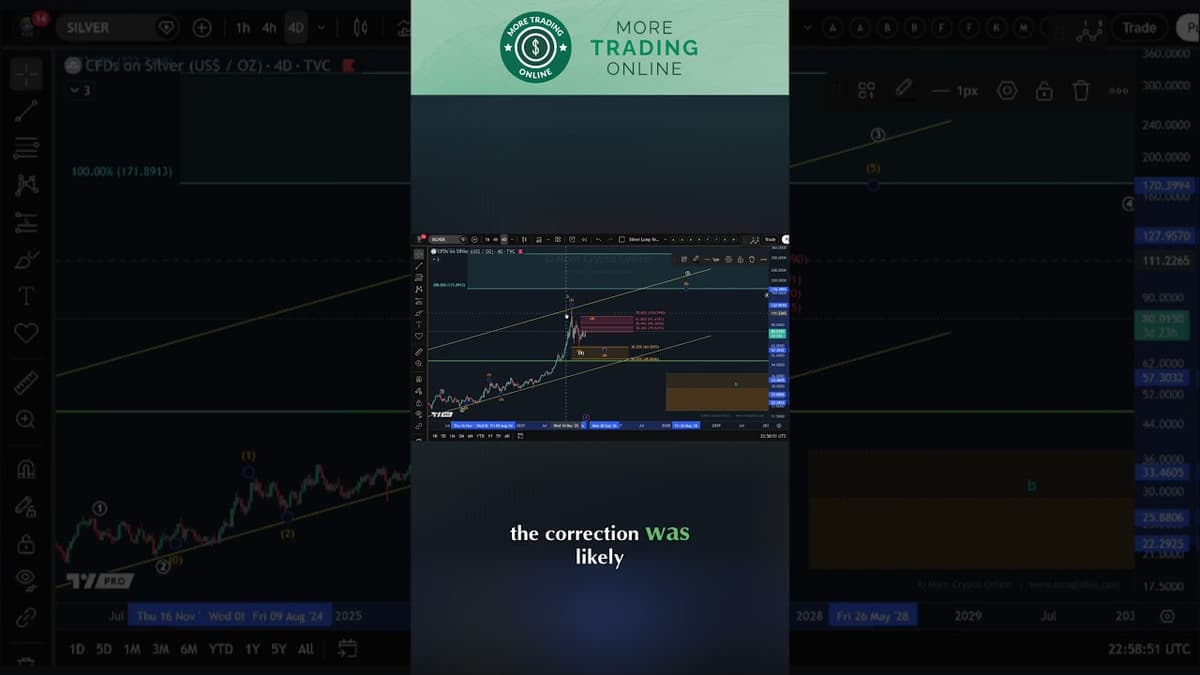
Silver Long-Term Roadmap | Elliott Wave Analysis Weekly Chart
The weekly Elliott Wave analysis focuses on silver’s long‑term price trajectory, noting that its higher‑timeframe chart now resembles gold’s recent movements. The presenter outlines a potential larger B wave that could lift silver above the $60 level before a broader...
Gold Analysis - Upside Reversal Unfolding?
The video focuses on the current technical state of gold, examining whether the recent price rally is a genuine reversal or merely a segment of a larger wave‑four correction. Using Elliott Wave principles on higher‑timeframe charts, the analyst stresses that...
WTI & Brent Crude Oil Technical Analysis - Elliott Wave Update
The video provides an Elliott Wave‑focused technical update on WTI and Brent crude, emphasizing that both benchmarks are trapped in a prolonged sideways corrective range. The analyst argues the pattern likely represents Wave 4 of a larger impulse, with micro‑structures still...