

Gold Chart Analysis Today: Key Support Levels Based on Elliott Wave Analysis
The video delivers a professional Elliott Wave and technical analysis of gold, pinpointing current support around $1,950 and potential resistance near $2,050. It outlines how the metal fits into a five‑wave corrective pattern and explores mid‑ to long‑term scenarios, including possible breakout or deeper correction. Viewers receive actionable insights for short‑term setups and broader market context. The analysis is presented alongside disclosures about CFD risks and affiliate partnerships.

Gold Chart Analysis Today: Key Support Levels Based on Elliott Wave Analysis
The latest video from MCO Global delivers an Elliott Wave‑based technical breakdown of gold, pinpointing current price structure and key support zones. Analysts identify a critical support level near $1,950 per ounce, with the wave count suggesting the end of...

Gold Chart Analysis Today: Key Support Levels Based on Elliott Wave Analysis
The video dissects today’s gold price chart through the lens of Elliott Wave theory, zeroing in on whether the market has already capped Wave 2 or if a broader corrective wave is still unfolding. The analyst leans toward a wider Wave 2...

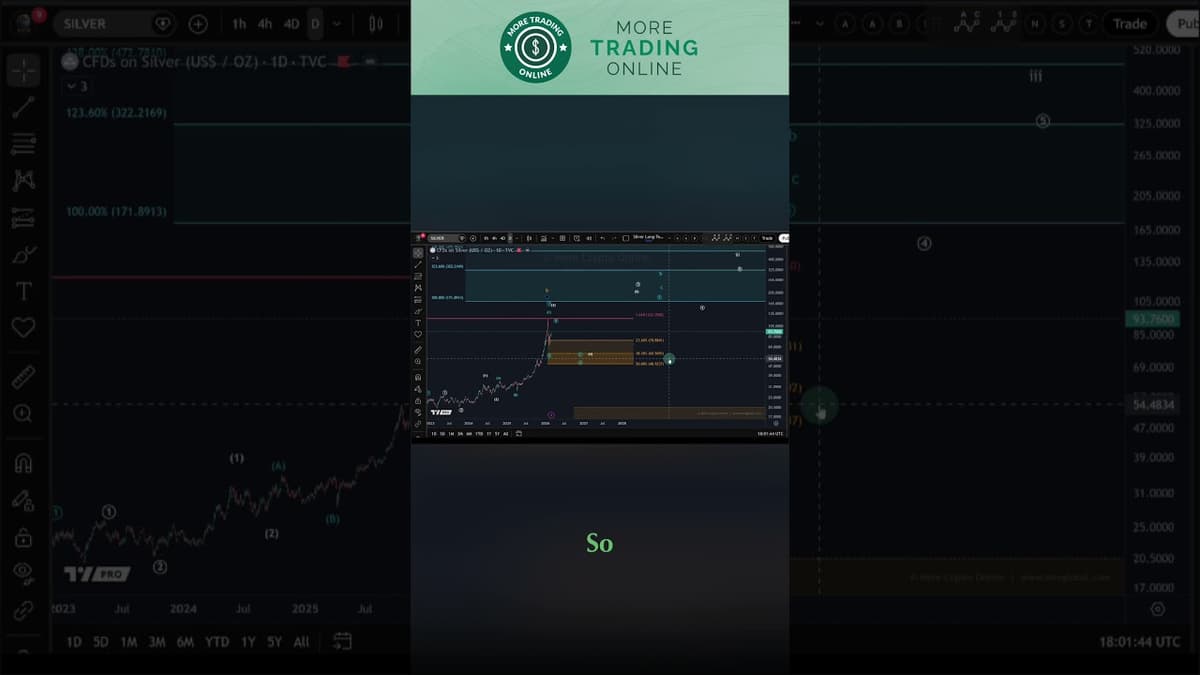
Silver Long-Term Roadmap | Elliott Wave Analysis Weekly Chart
The weekly video delivers an Elliott Wave and technical breakdown of the silver market, mapping its current price structure and identifying key support and resistance zones. It outlines several mid‑term and long‑term scenarios, including potential corrective patterns and a possible...

Gold Chart Analysis Today: Key Support Levels Based on Elliott Wave Analysis
The video delivers a detailed Elliott Wave and technical breakdown of gold, pinpointing current price structure, key support around $1,950 and resistance near $2,050‑$2,100. It outlines several wave scenarios that could push the metal toward $2,200 in the medium term....

Copper Elliott Wave Analysis: Big Picture Structure Through 2026
The video delivers a detailed Elliott Wave and technical breakdown of the copper market, pinpointing the current wave count and mapping key support around $3,300 and resistance near $4,200 per metric ton. It outlines several mid‑term to long‑term scenarios that...

Gold Chart Analysis Today: Key Support Levels Based on Elliott Wave Analysis
The video delivers an Elliott Wave‑based technical breakdown of gold, pinpointing current price structure, key support and resistance zones, and outlining short‑term setups alongside mid‑ to long‑term scenarios. It emphasizes how wave counts suggest a potential corrective phase before a...

Gold Chart Analysis Today: Key Support Levels Based on Elliott Wave Analysis
The latest video delivers an Elliott Wave‑based technical breakdown of gold, pinpointing current wave structures and charting key support and resistance zones. Analysts identify a primary support level around $1,950 per ounce and a resistance band near $2,050‑$2,100. They outline...

Platinum Market Structure – Upside Reversal Incoming? Elliott Wave Analysis
The video provides an Elliott Wave analysis of platinum, noting that the metal has completed a five‑wave decline into February lows and that a wave‑B rally was observed. The analyst confirms that the wave‑B bounce hit the projected $2,480‑$2,719 zone, satisfying...

Gold Chart Analysis Today: Key Support Levels Based on Elliott Wave Analysis
The video provides a short‑term technical update on gold, focusing on Elliott Wave analysis after a pronounced downside move. The analyst notes that gold fell below Monday’s low, which he interprets as confirmation of a local top in the larger...

Copper Elliott Wave Analysis: Big Picture Structure Through 2026
The video focuses on a fresh Elliott Wave analysis of copper, arguing that the metal is entering the final C leg of a multi‑year correction that began earlier this year. The presenter maps the move onto a classic ABC structure,...
Silver Long-Term Roadmap | Elliott Wave Analysis Weekly Chart
The video presents a long‑term roadmap for silver, emphasizing analysis on the weekly chart and higher‑time‑frame structures. The presenter frames the discussion against the backdrop of escalating geopolitical tensions involving Iran, Israel, and the United States, noting that such uncertainty...
Gold Chart Analysis Today: Key Support Levels Based on Elliott Wave Analysis
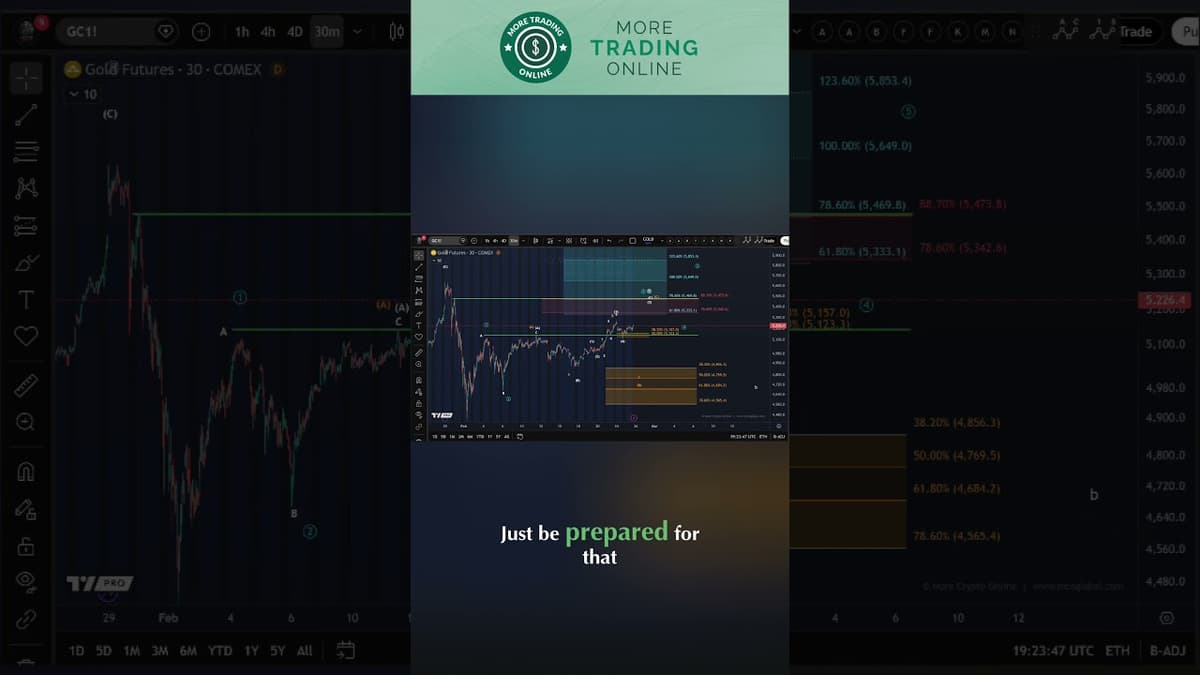
The video provides an Elliott Wave analysis of gold, focusing on the current support zone and potential upward movement. The analyst notes gold is trading just above the $5,123‑$5,157 support band. The C‑wave remains incomplete, requiring an additional high to satisfy...
Gold Chart Analysis Today: Key Support Levels Based on Elliott Wave Analysis
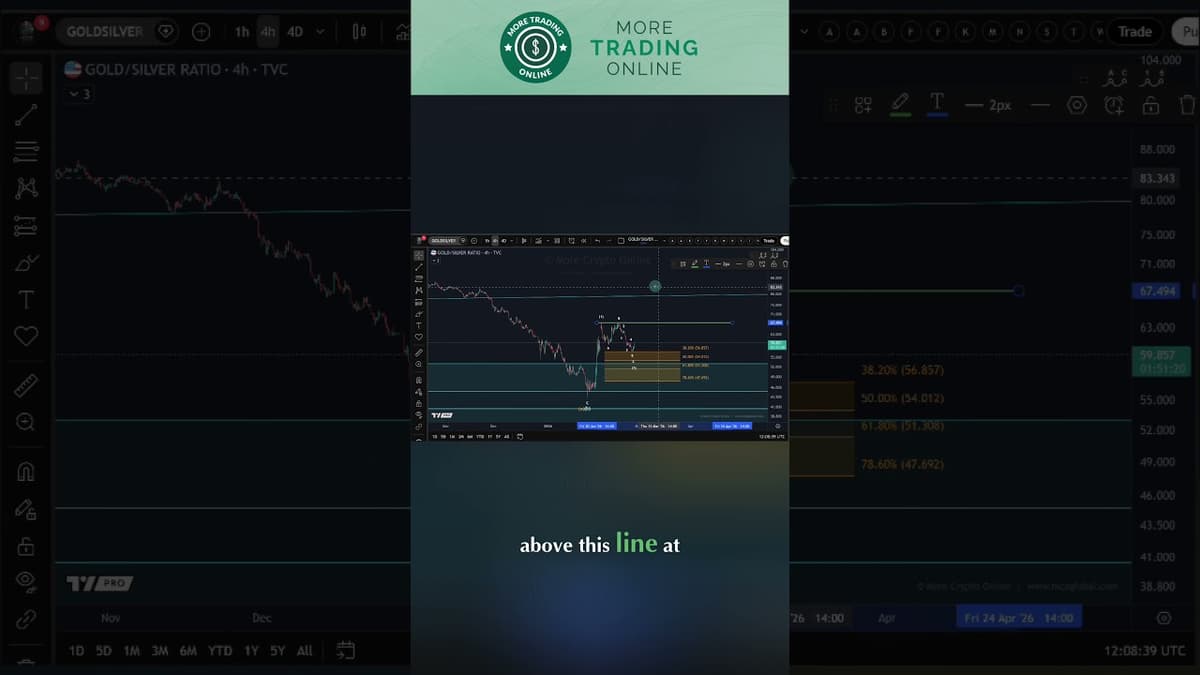
The video provides a technical breakdown of gold’s price action through the lens of Elliott Wave theory, zeroing in on whether the metal is poised to launch into a third‑wave impulse. The analyst stresses that a decisive breakout above the...

Gold Chart Analysis Today: Key Support Levels Based on Elliott Wave Analysis
The video delivers a detailed Elliott Wave and technical analysis of gold, pinpointing current price structure, key support around $1,950 and resistance near $2,050. It outlines short‑term setups, mid‑term wave‑5 completion scenarios, and longer‑term structural risks. The presenter also references...
Gold Chart Analysis Today: Key Support Levels Based on Elliott Wave Analysis
The video delivers a professional Elliott Wave and technical analysis of gold, pinpointing current price structure, key support around $1,950 and resistance near $2,050. It outlines short‑term setups, mid‑term corrective wave possibilities, and longer‑term bullish impulse scenarios. The analyst also...

Gold Chart Analysis Today: Key Support Levels Based on Elliott Wave Analysis
The video delivers a detailed Elliott Wave and technical analysis of gold, pinpointing current support around $1,950 and resistance near $2,050 per ounce. It outlines short‑term setups, mid‑term bullish scenarios, and a longer‑term corrective wave that could last through 2025....

Gold Chart Analysis Today: Key Support Levels Based on Elliott Wave Analysis
The video delivers a detailed Elliott Wave and technical breakdown of gold, pinpointing current price structure, key support around $1,950 and resistance near $2,050. It outlines short‑term setups and mid‑to‑long‑term scenarios, suggesting a potential bullish impulse if the market clears...

Gold Chart Analysis Today: Key Support Levels Based on Elliott Wave Analysis
The video delivers an Elliott Wave‑based technical analysis of gold, outlining the current wave structure and identifying key support around $1,950 and resistance near $2,050‑$2,080. It evaluates short‑term setups while projecting mid‑term bullish scenarios if wave five completes, and warns...

Palladium Market Update – Can Bulls Defend Support Here?
The latest video from MCO Global delivers a detailed Elliott Wave and technical breakdown of palladium, pinpointing key support around $2,300 and resistance near $2,600. It outlines both bullish and bearish scenarios, explaining how wave counts could allow the metal...

Copper Elliott Wave Analysis: Big Picture Structure Through 2026
The video presents a detailed Elliott Wave and technical analysis of copper, outlining the current price structure, key support and resistance zones, and projected scenarios through 2026. It positions copper within broader market cycles, highlighting potential corrective waves and bullish...

Silver Long-Term Roadmap | Elliott Wave Analysis Weekly Chart
The video delivers a professional Elliott Wave and technical analysis of the gold market, outlining the current price structure, key support and resistance zones, and potential mid- to long‑term scenarios. It explains how gold is positioned within a corrective wave...