
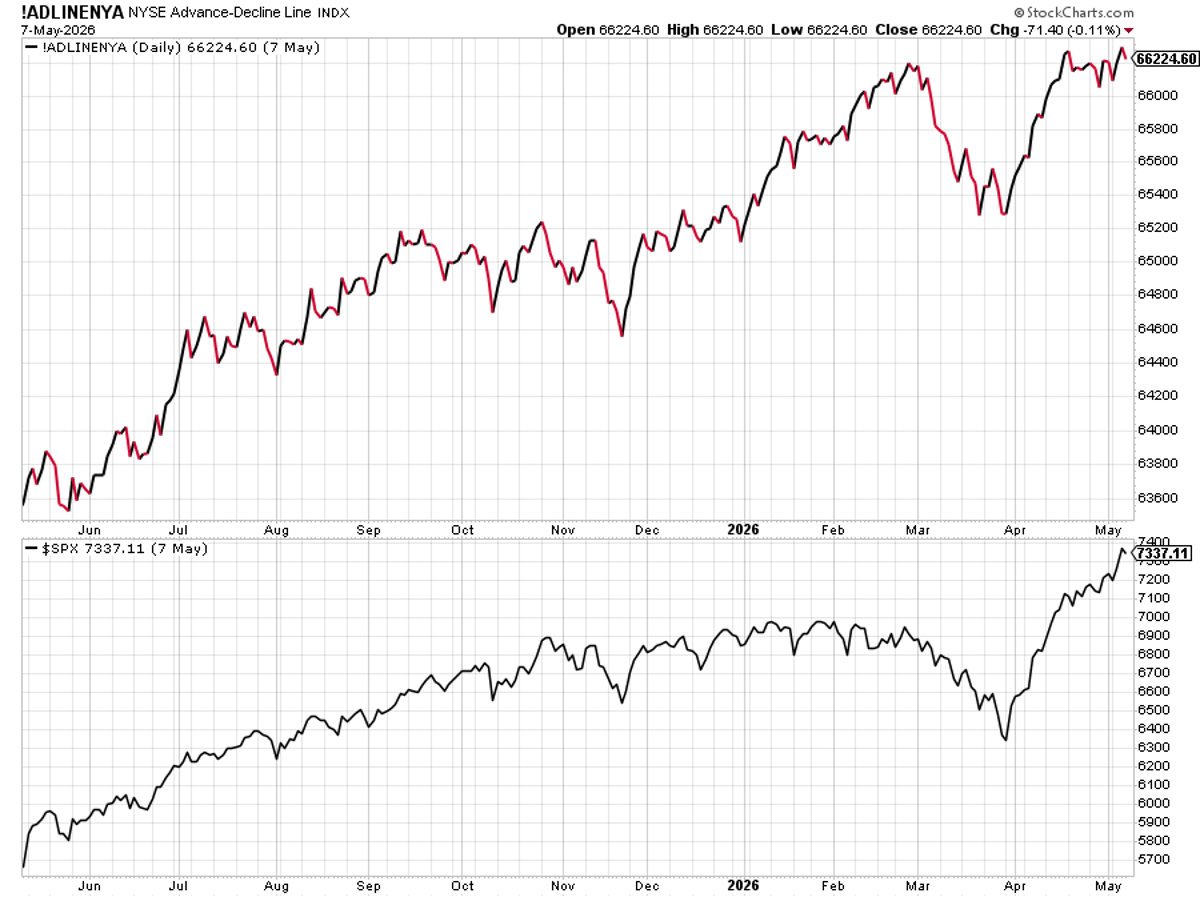
NYSE A/D Line Hits Record, Proving Broad Market Gains
A lot of talk again how only a few stocks are going up. This isn't true, much like it hasn't been true for years. NYSE A/D line hit a new ATH on Wednesday. Hard to think this happens if only a couple stocks were going up. https://t.co/uInygnh16F
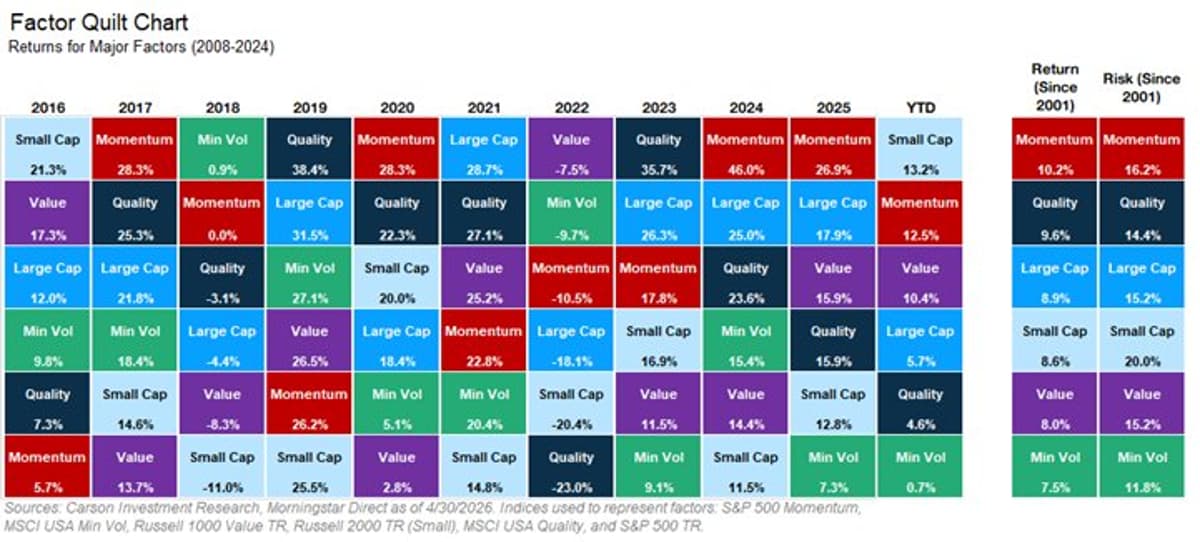
Momentum Persists as Small Caps Join the Rally
Here's an updated version of our @CarsonResearch Quilt Chart. Momentum doing what it does, but nice to see smalls join the party. https://t.co/T9KO9Uho9R
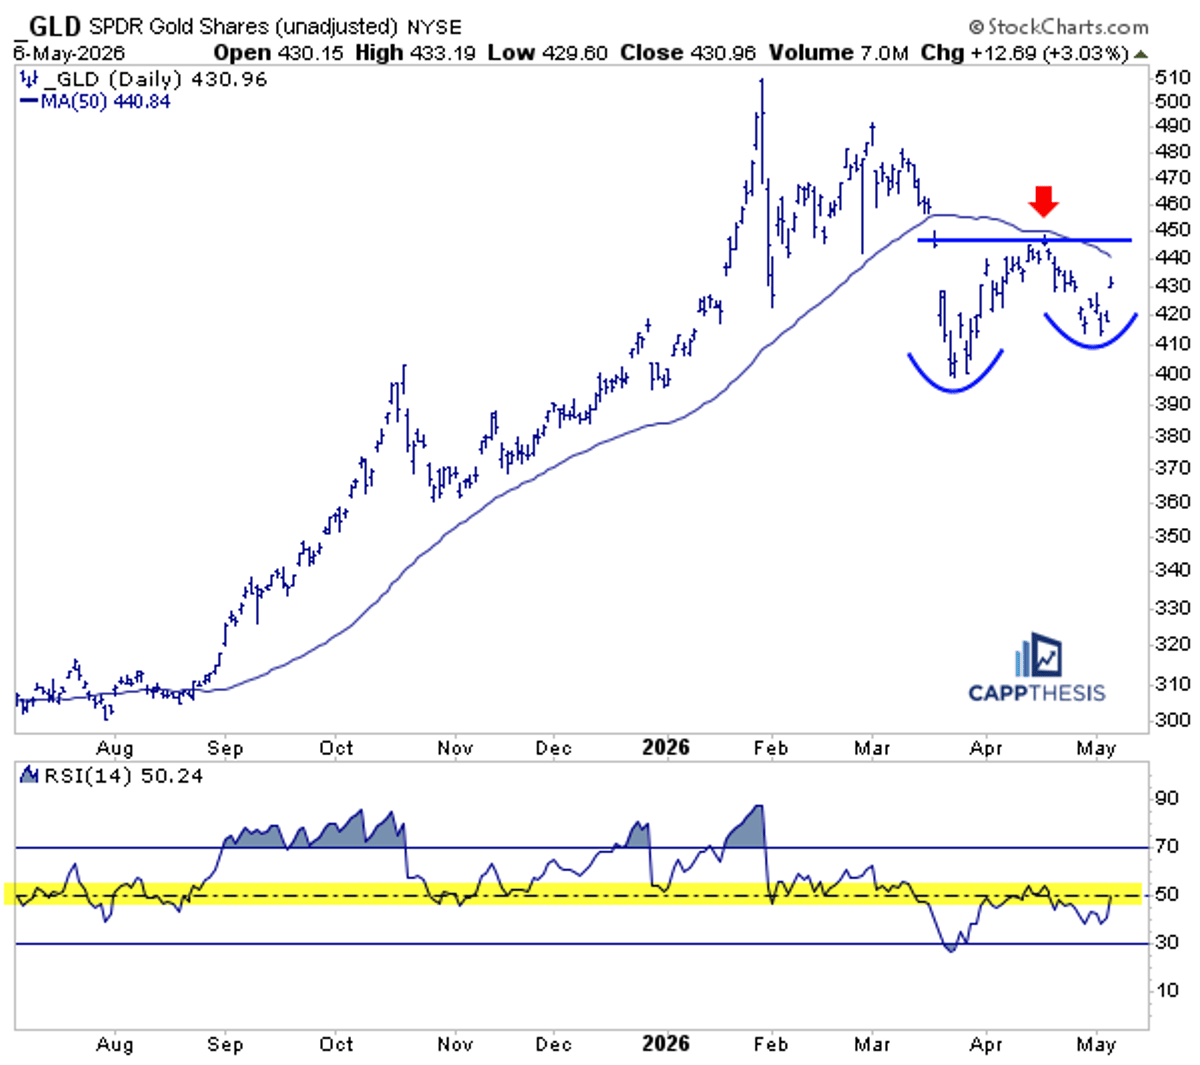
Gold Bears Beware: Emerging Positive Pattern Highlighted
A lot of bears on gold it feels like, but @FrankCappelleri noted a potential positive pattern in his note this morning. 🥇 https://t.co/UXOaAOz64J
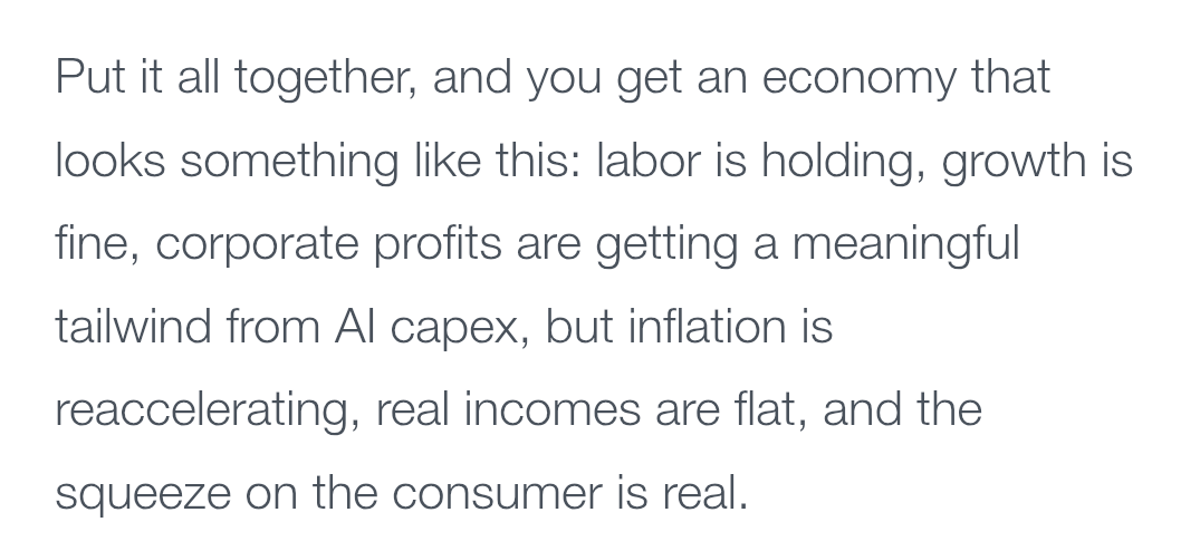
US Economy: Mixed Signals Highlight Strengths and Weaknesses
Great look at the good and the bad of the overall US economy from @sonusvarghese of @CarsonResearch right here. https://t.co/dRBQaZ4h4O https://t.co/r75iTg6qRz

Sell in May: Fresh Perspective From Yahoo Finance
A nice look at Sell in May from @SPYJared of @YahooFinance. Thanks for including me!

Oil Spikes After Satirical Trump Cover Fuels Market Frenzy
Crude oil had 6-sigma move higher (supposed to happen once in 4 million years) after we saw a magazine cover with so much oil out there it was coming out of President Trump's nose. Last week we had a...
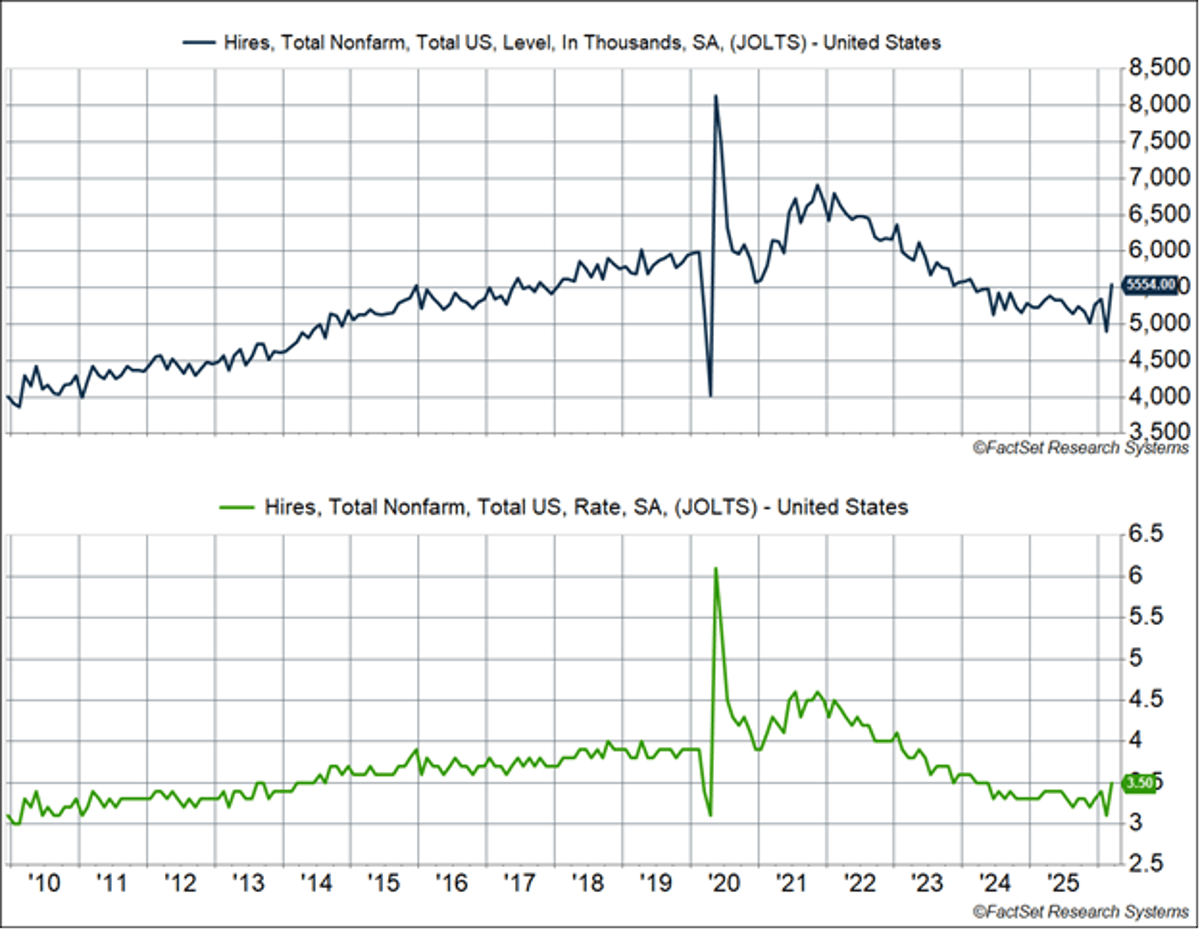
Labor Market Outperforms Expectations with Hiring Surge
We've been in the camp the labor market was stronger than what most thought. Big jump in hiring last month and a tick up in quits. We don't think people would be quitting if they didn't have better options. A big...
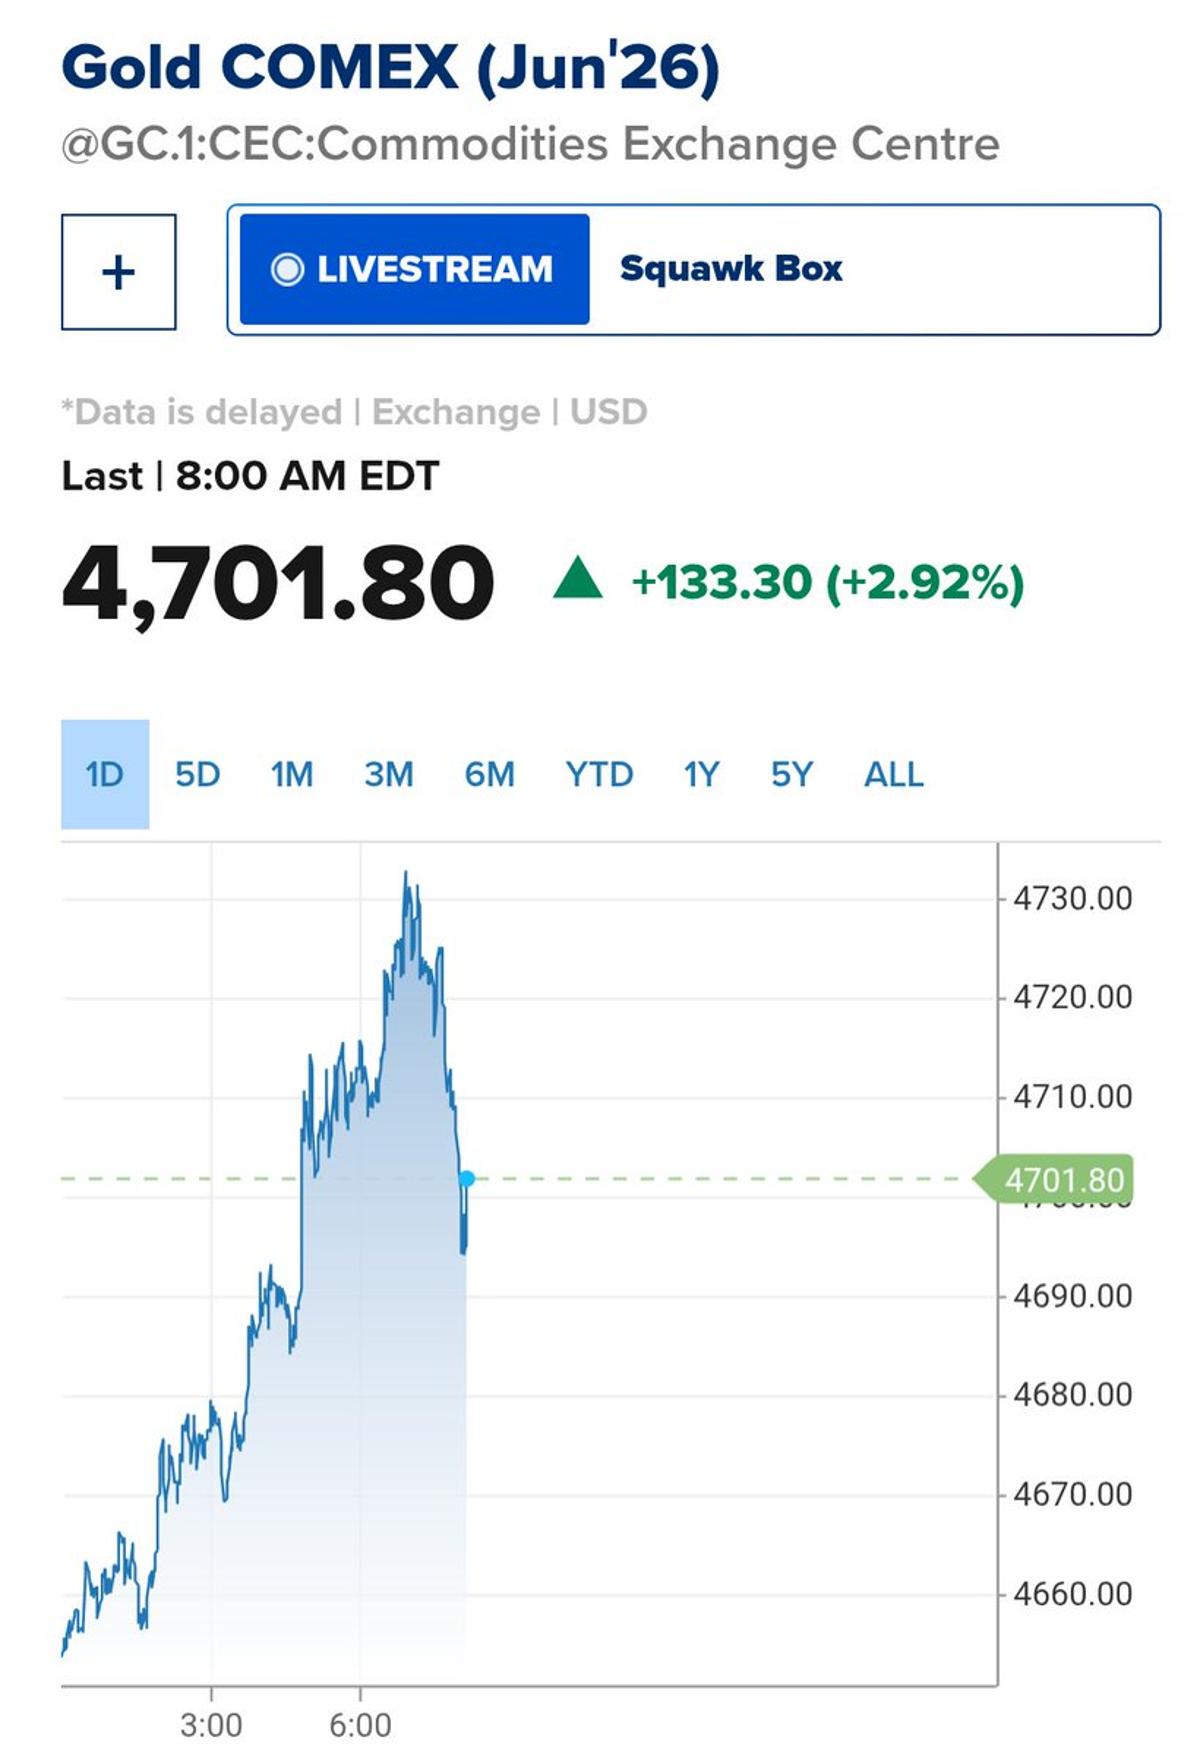
Gold Climbs 3% on War Hopes and Bull Market Momentum
Gold up 3% on hopes of an end to the war. 🤔 Or gold up 3% as it is still in a secular bull market (and working off the January blow off top) and those tend to go higher....
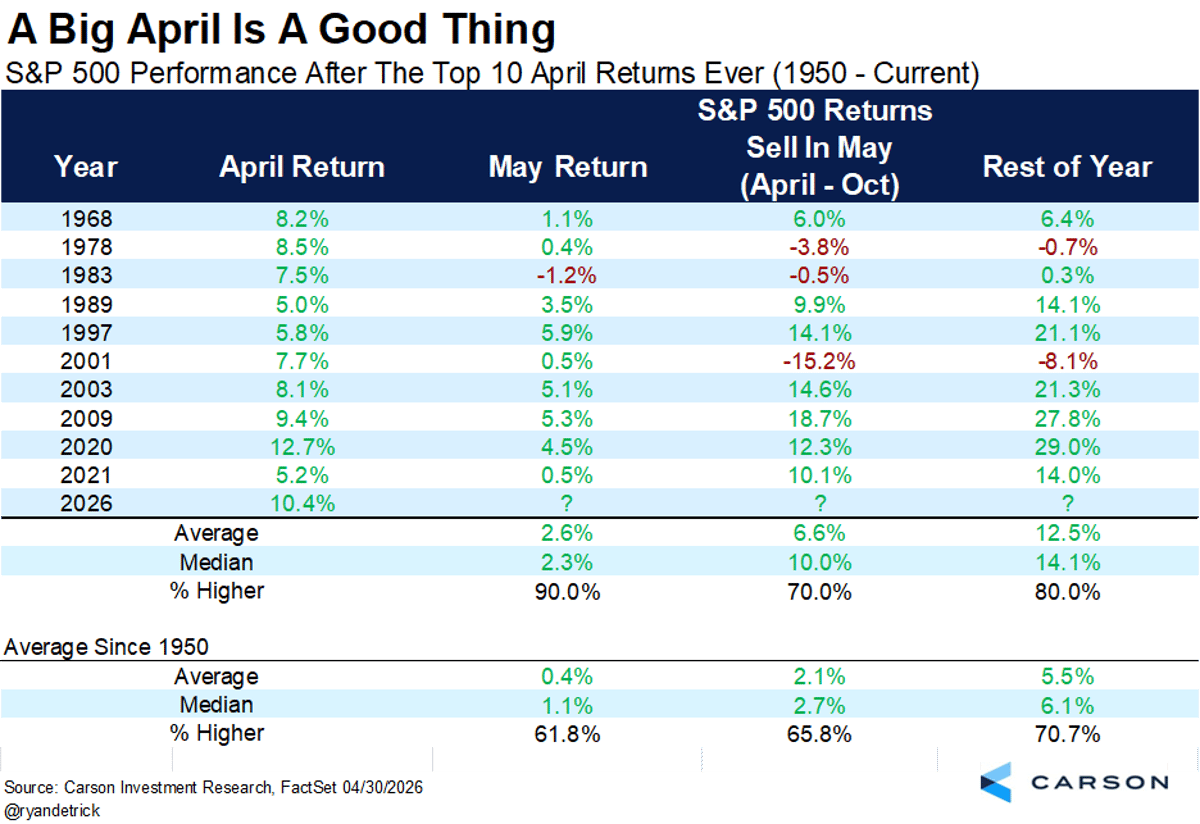
May Gains Expected After Record‑breaking April Rally
Stocks are up in May, but this is normal after a big April. May was higher after 9 of the top 10 April returns ever. https://t.co/EPWRajjU3I
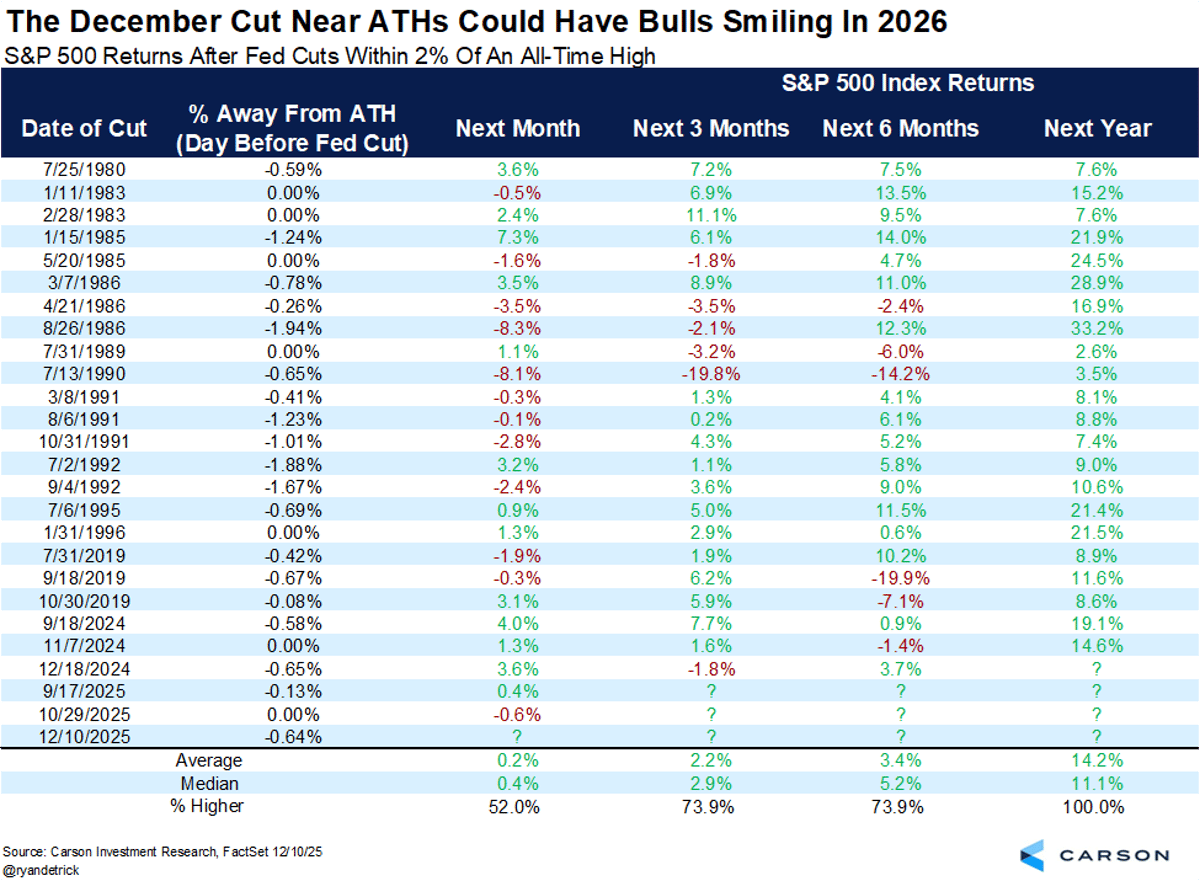
Fed Rate Cut Near S&P Peak Predicts Future Decline
In December, the Fed cut rates within 2% of an all-time high for the S&P 500. We shared this table back then and noted that stocks had never been lower a year later. https://t.co/ujCQTFGTz6
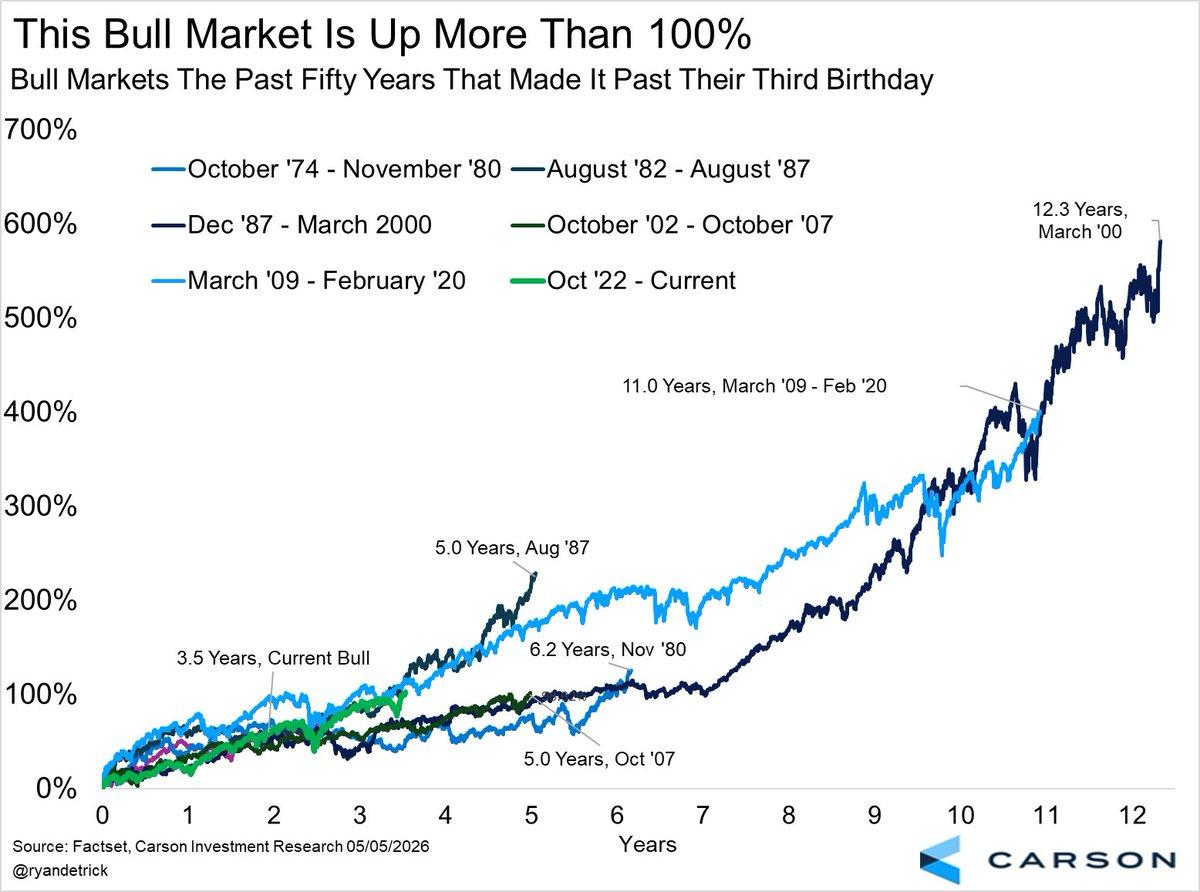
S&P’s 103% Rise Mirrors Past Bull Market Patterns
From the Oct '22 lows, the S&P 500 is up nearly 103% after today. Here's what the previous five bull markets that made it this far looked like. The bottom line? Years more of gains would be perfectly normal. https://t.co/FTzh4IWKYf
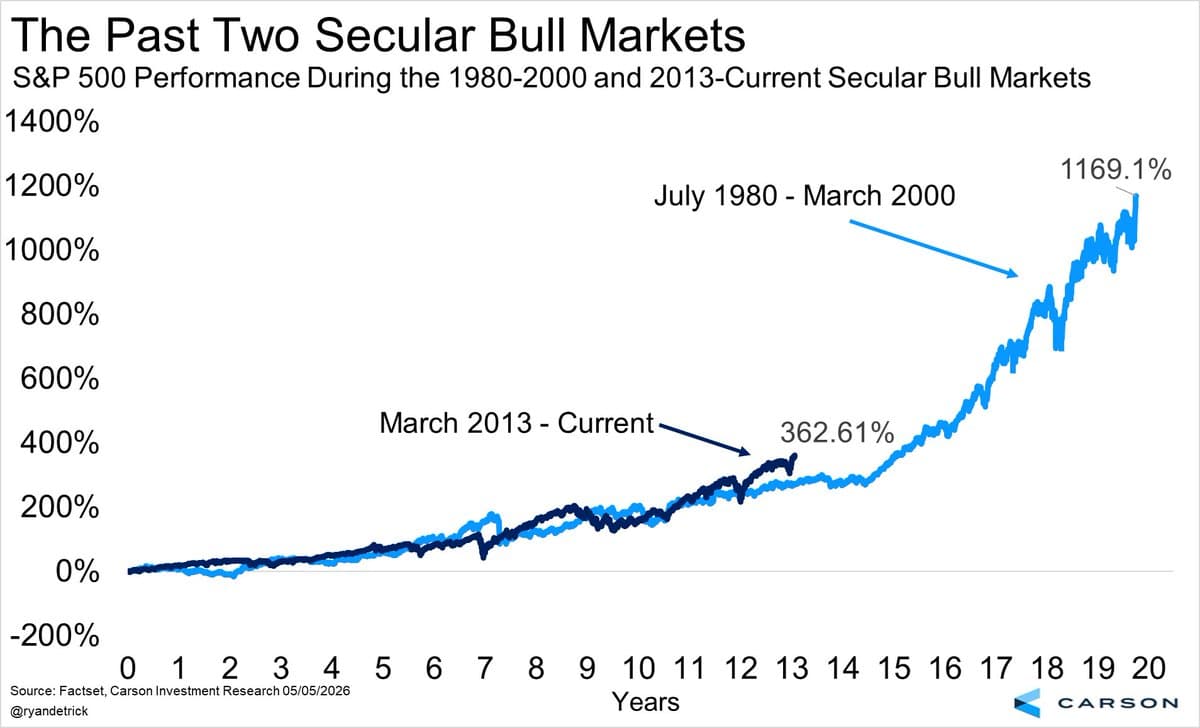
13-Year Bull Market Surpasses 80s/90s Gains
This secular bull market started in March 2013 and after today's latest new high is up 362.61% in just over 13 years. This one is now running above the '80s/'90s secular bull, but that one had a lot left. Will this...

Secular Bull Market Likely Continues for Years
We are in a secular bull market that could have many years left. I've been saying this since 2013 and don't think it is over yet. I discussed it all in our latest @CarsonResearch blog. https://t.co/NZH0IouJr4
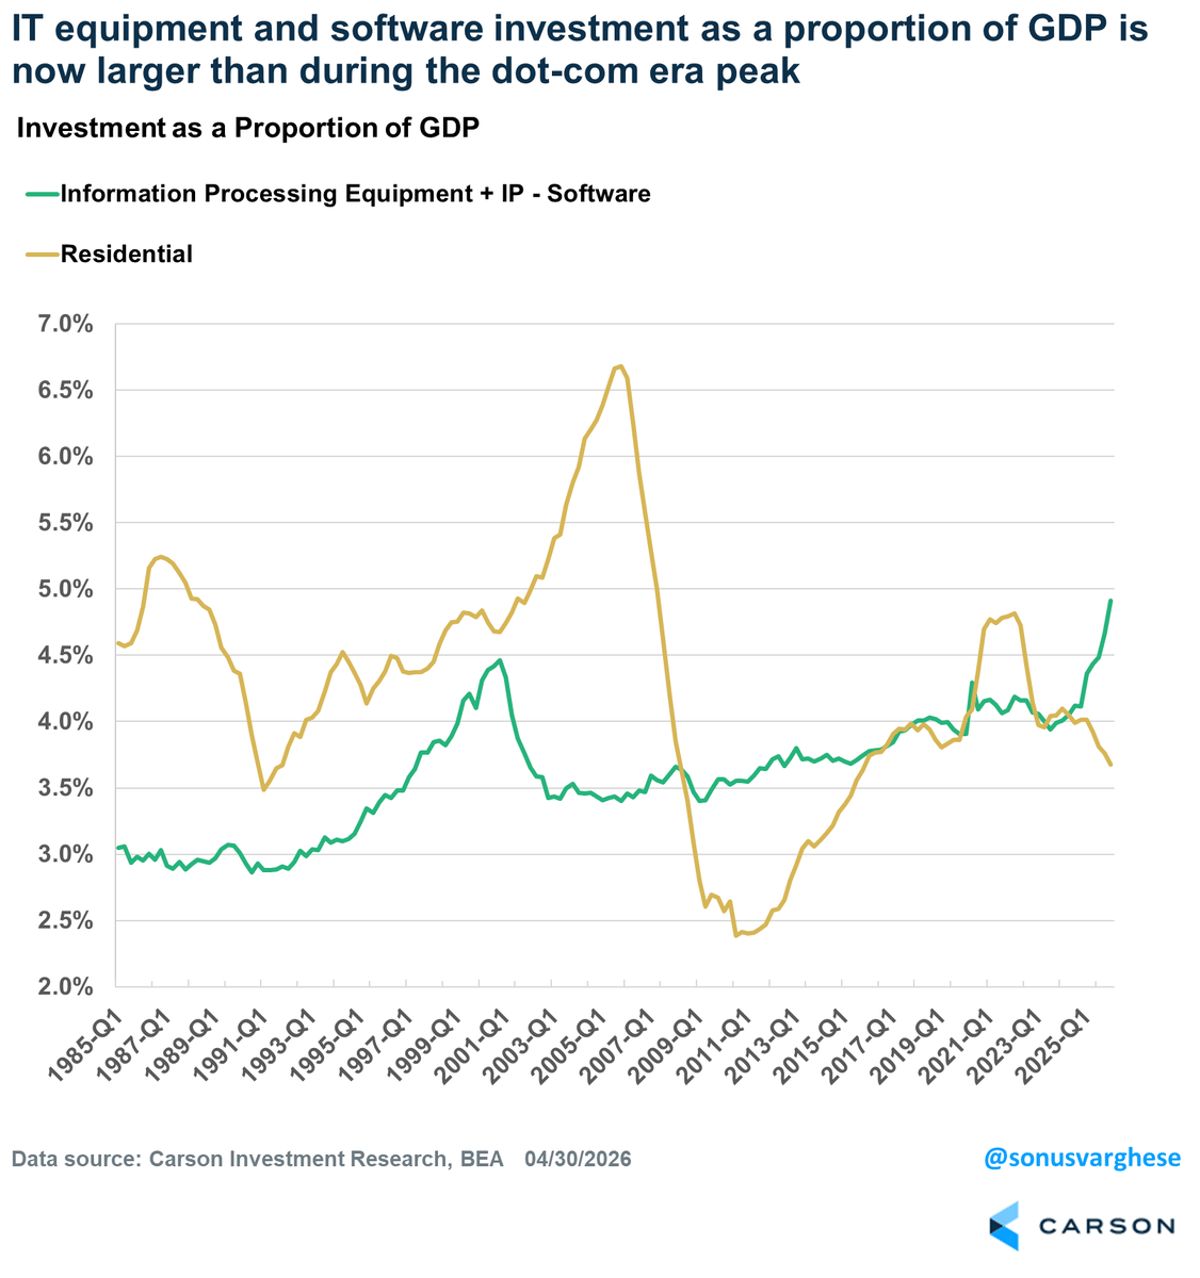
AI Investment Now Outpaces Dot‑Com Era Share
AI hardware and software investment is a larger part of our economy now than it was during the dot-com peak. https://t.co/PctEUUESxq
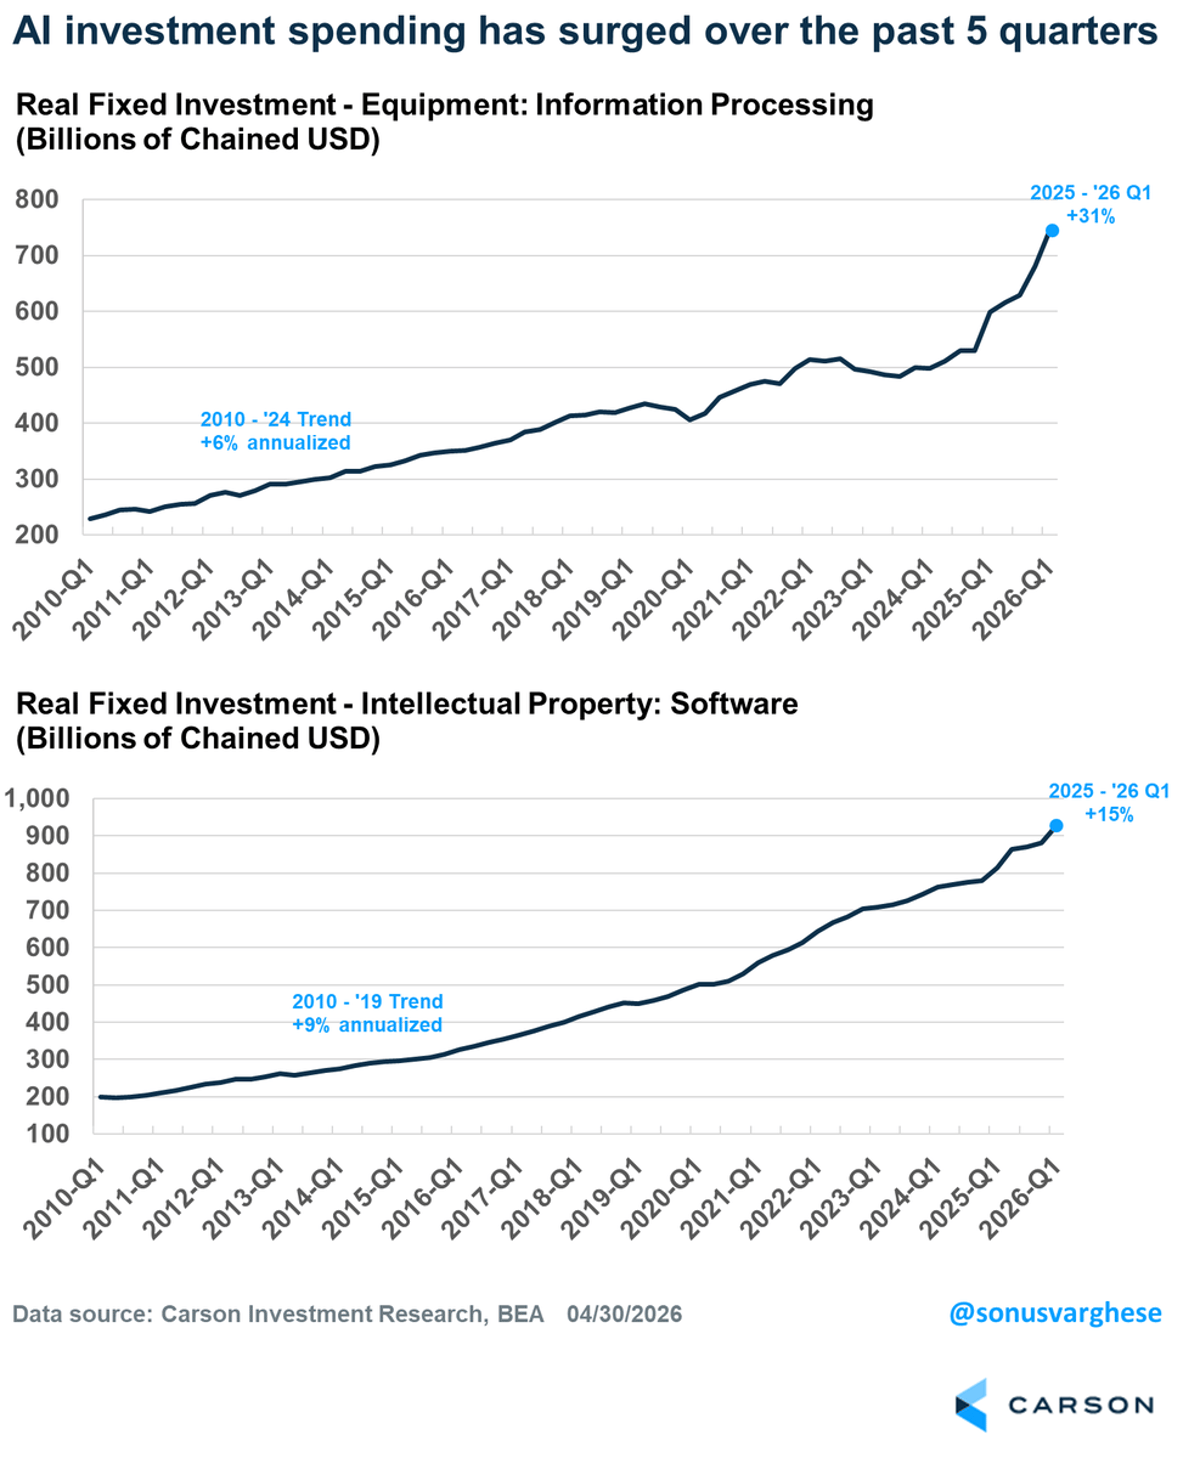
AI Hardware Spending Surges 31%, Software 15%
AI spending on hardware is running at an annualized clip of 31% the past five quarters, while software is 15%. Both are well above longer trends. https://t.co/jpzfvBjcKR
Investors Fear Downturn Despite Record Stock Levels
How's sentiment? Latest Barron's Big Money Poll said stocks lower the rest of the year A recent Gallup poll said 80% see the economy as fair or poor AAII 🐻>🐂 with stocks at ATHs Gary Shilling and Harry Dent are in the headlines...
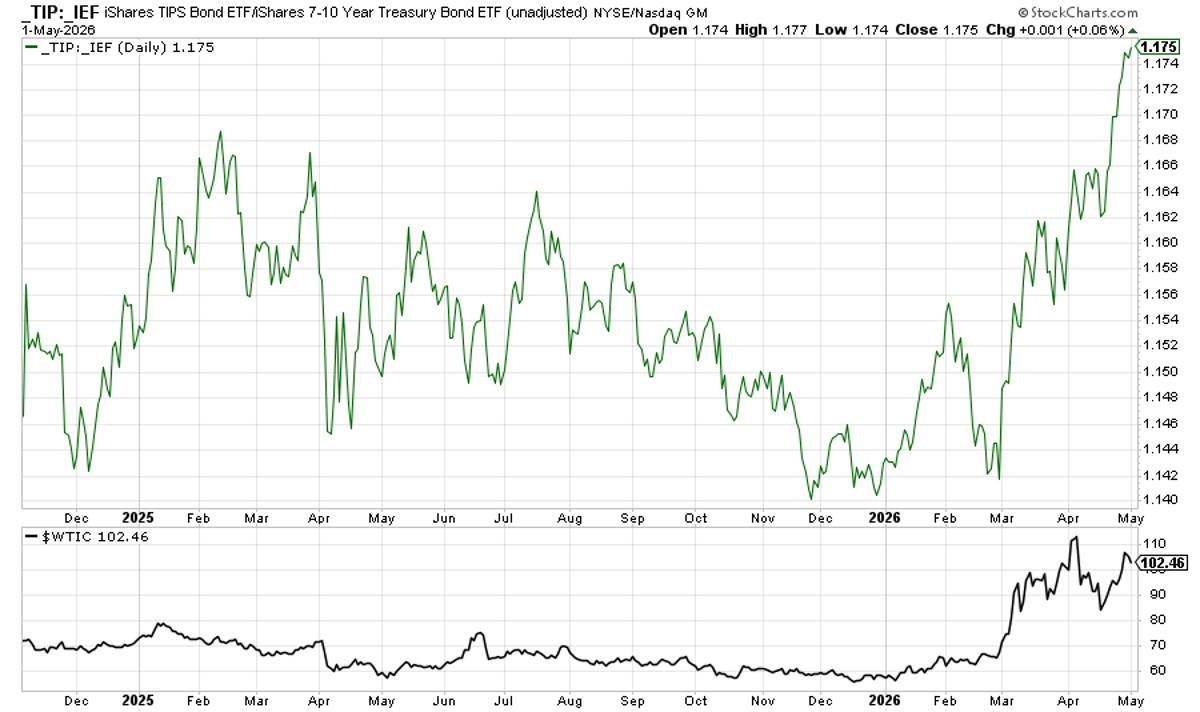
TIPS‑Bond Spread Signals Inflation, Boosting Oil Prices
TIPS relative to bonds are suggesting a higher inflationary world, which it turns out means higher oil. https://t.co/7lvC0M2pIk

Positioning Models for Inflationary Growth Benefits Advisors
For a few years now we've been in the camp that we'd see inflationary growth. Nice job by @gilbert3142 on our team on exactly what that means and how we've positioned the models we run to benefit our Advisors and...

Secular Bull Markets Begin at Breakout, Not Bottom
When do secular bull markets start? I say on the breakout, meaning April 2013 (or Oct '80) not March 2009 (or Aug '82). What do you think? This seems to really get people fired up. 🐂 🐻 https://t.co/X24CfOzK8b
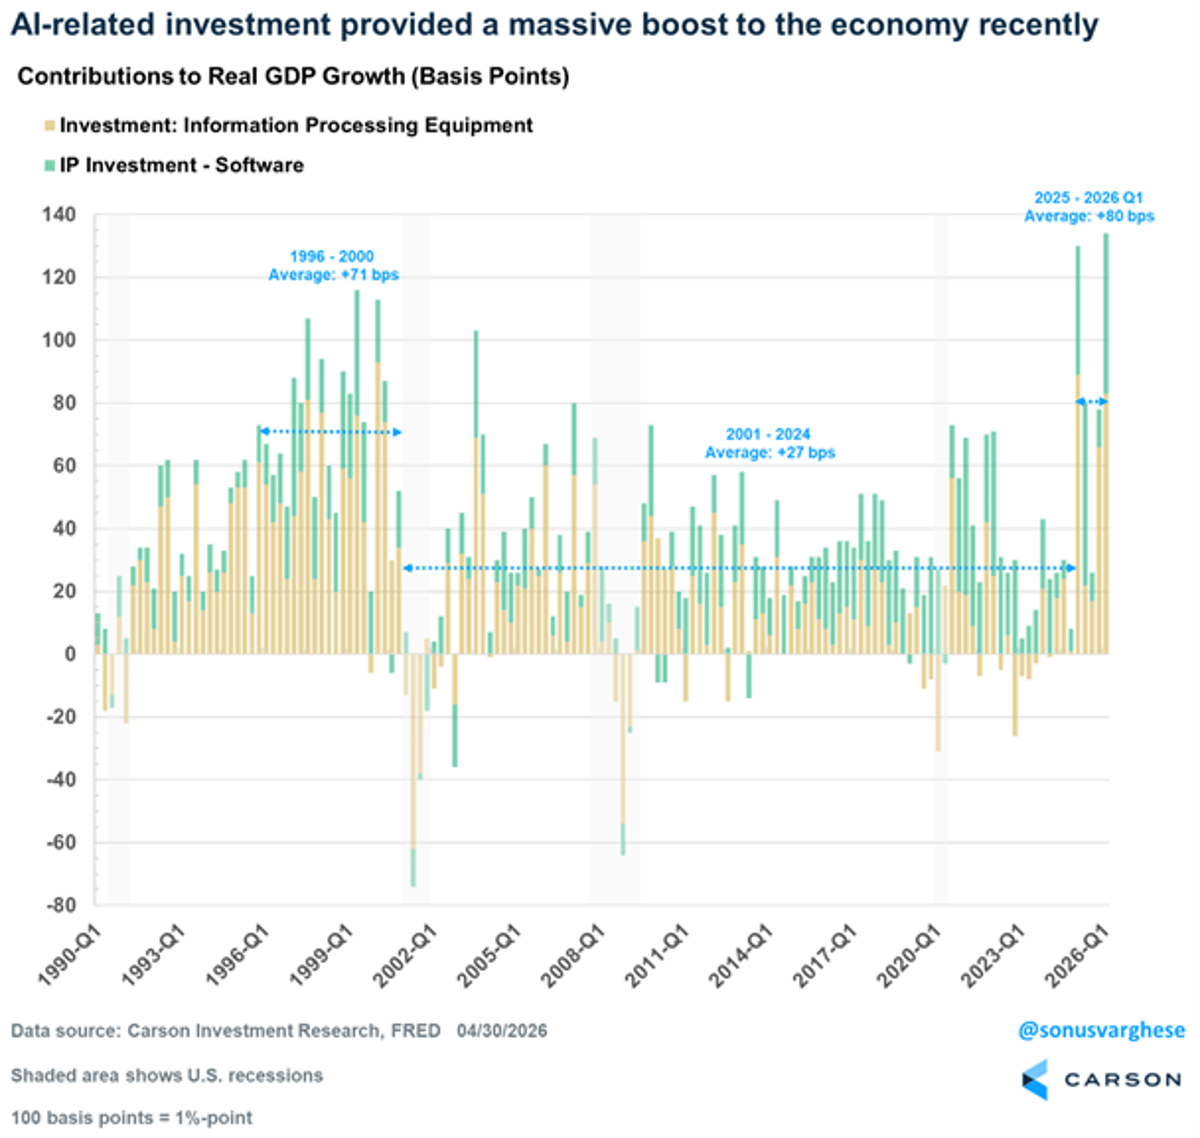
AI Drives Nearly Half of Recent GDP Growth
Per @sonusvarghese, over the past 5 quarters GDP has averaged 2.0%. 0.90% of that (so 45%) has come from AI hardware/software spending. Wow. https://t.co/aiia8rSNZ2
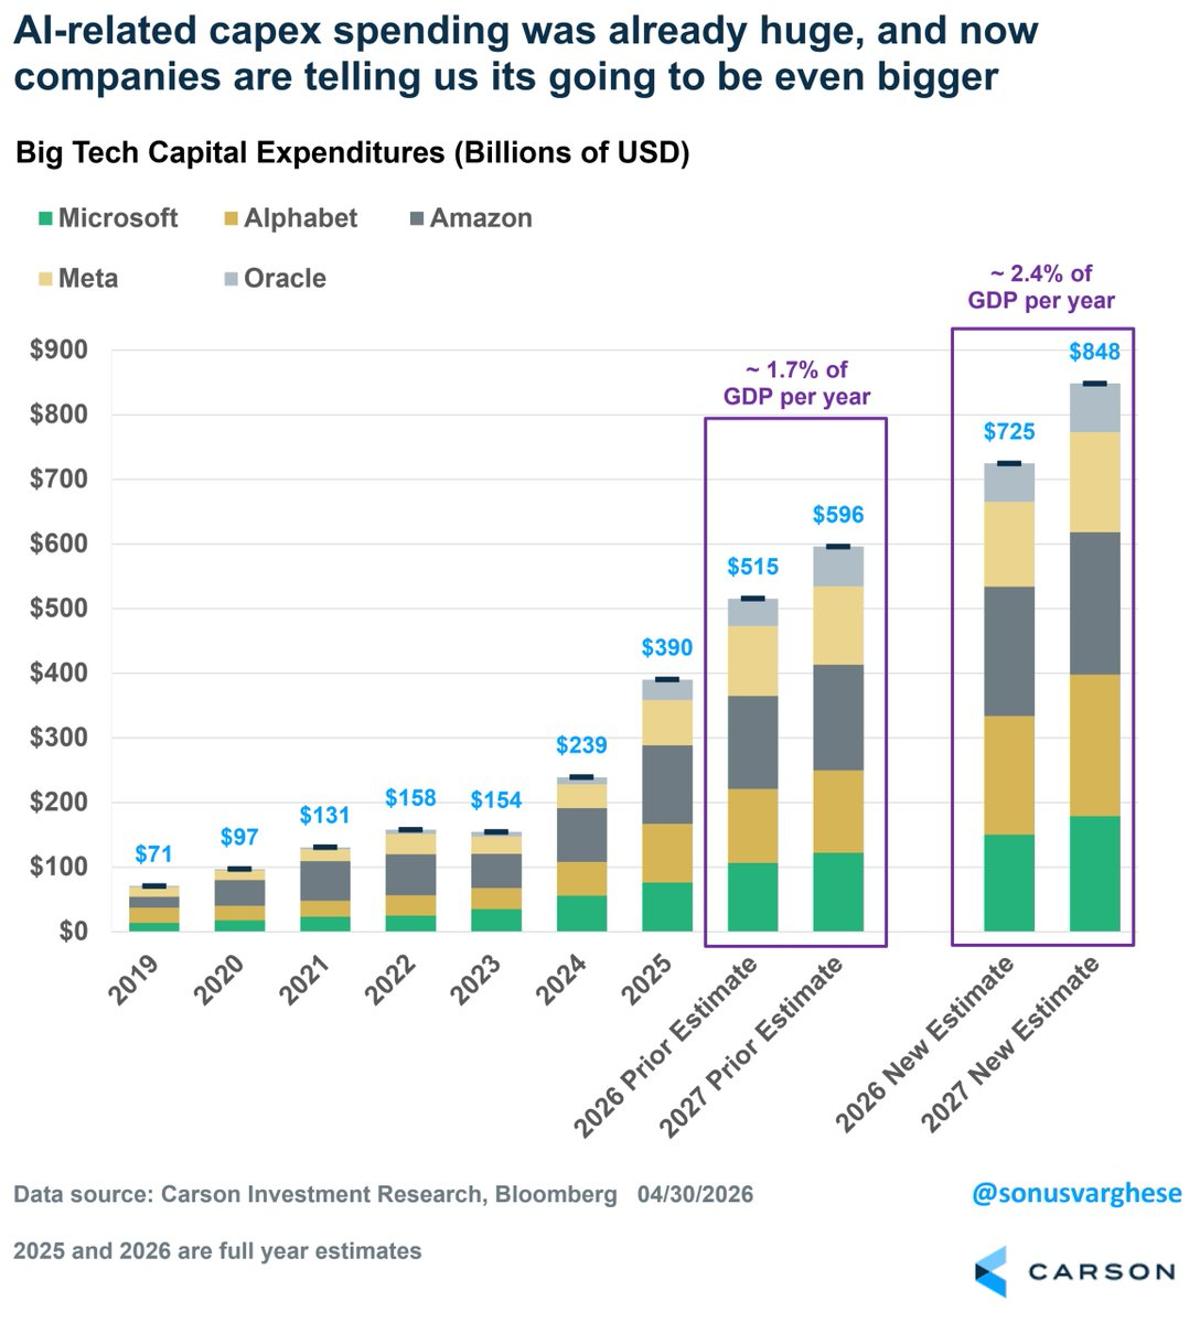
Larry Page Vows Bankruptcy over Losing AI Race
"I'm willing to go bankrupt rather than lose this race." Google co-founder Larry Page on the AI spending race. Looks like he wasn't kidding. https://t.co/MfAbbLZ69h
Earnings and Margins Set New Records, Fuel Bull Market
We've called these the dual tailwinds to this bull market for going on three years now. Higher earnings and profit margins always suggested this bull market wasn't over back in late March. Both are at new records again. https://t.co/8aMsnSwKYN

Managed Futures Boosted Our Model Alpha This Year
Two words that have really added some alpha to our models this year Managed Futures

Tune in Tomorrow 5:45 Am ET for CNBC Morning Call
I'm scheduled to join @MorganLBrennan on @CNBCMorningCall tomorrow at 5:45am ET! Get up early and join us ☕⏰ https://t.co/c8yuMyI6kW
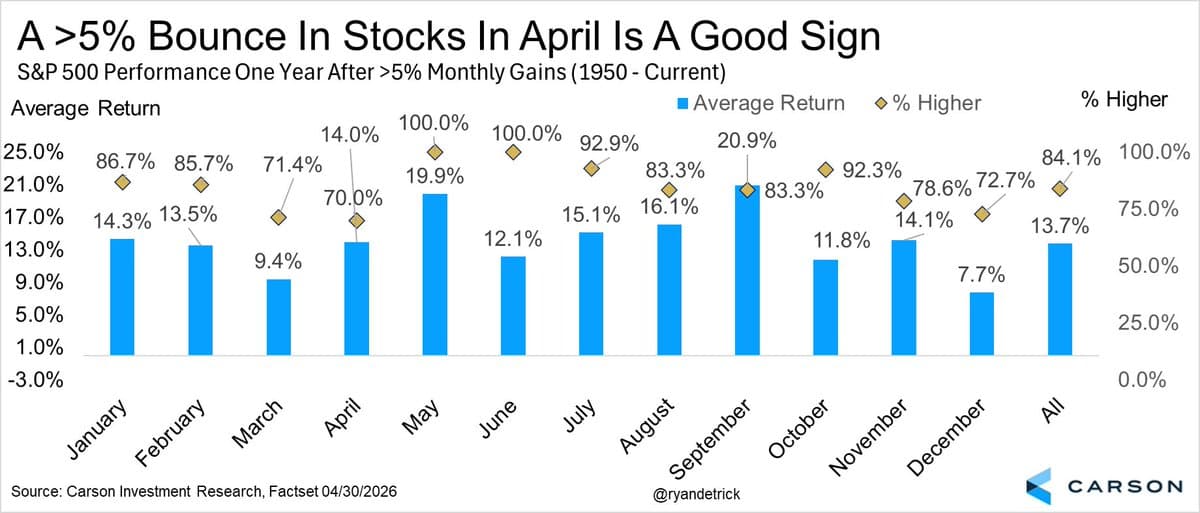
5% Monthly Gains Forecast 84% Chance of Strong Year
>5% monthly returns tend to suggest the following year will be stronger than average. Up 13.7% on average and higher a year later more than 84% of the time. Here's how all 12 months do, with April clocking in about average. https://t.co/QP9xVmJcoD
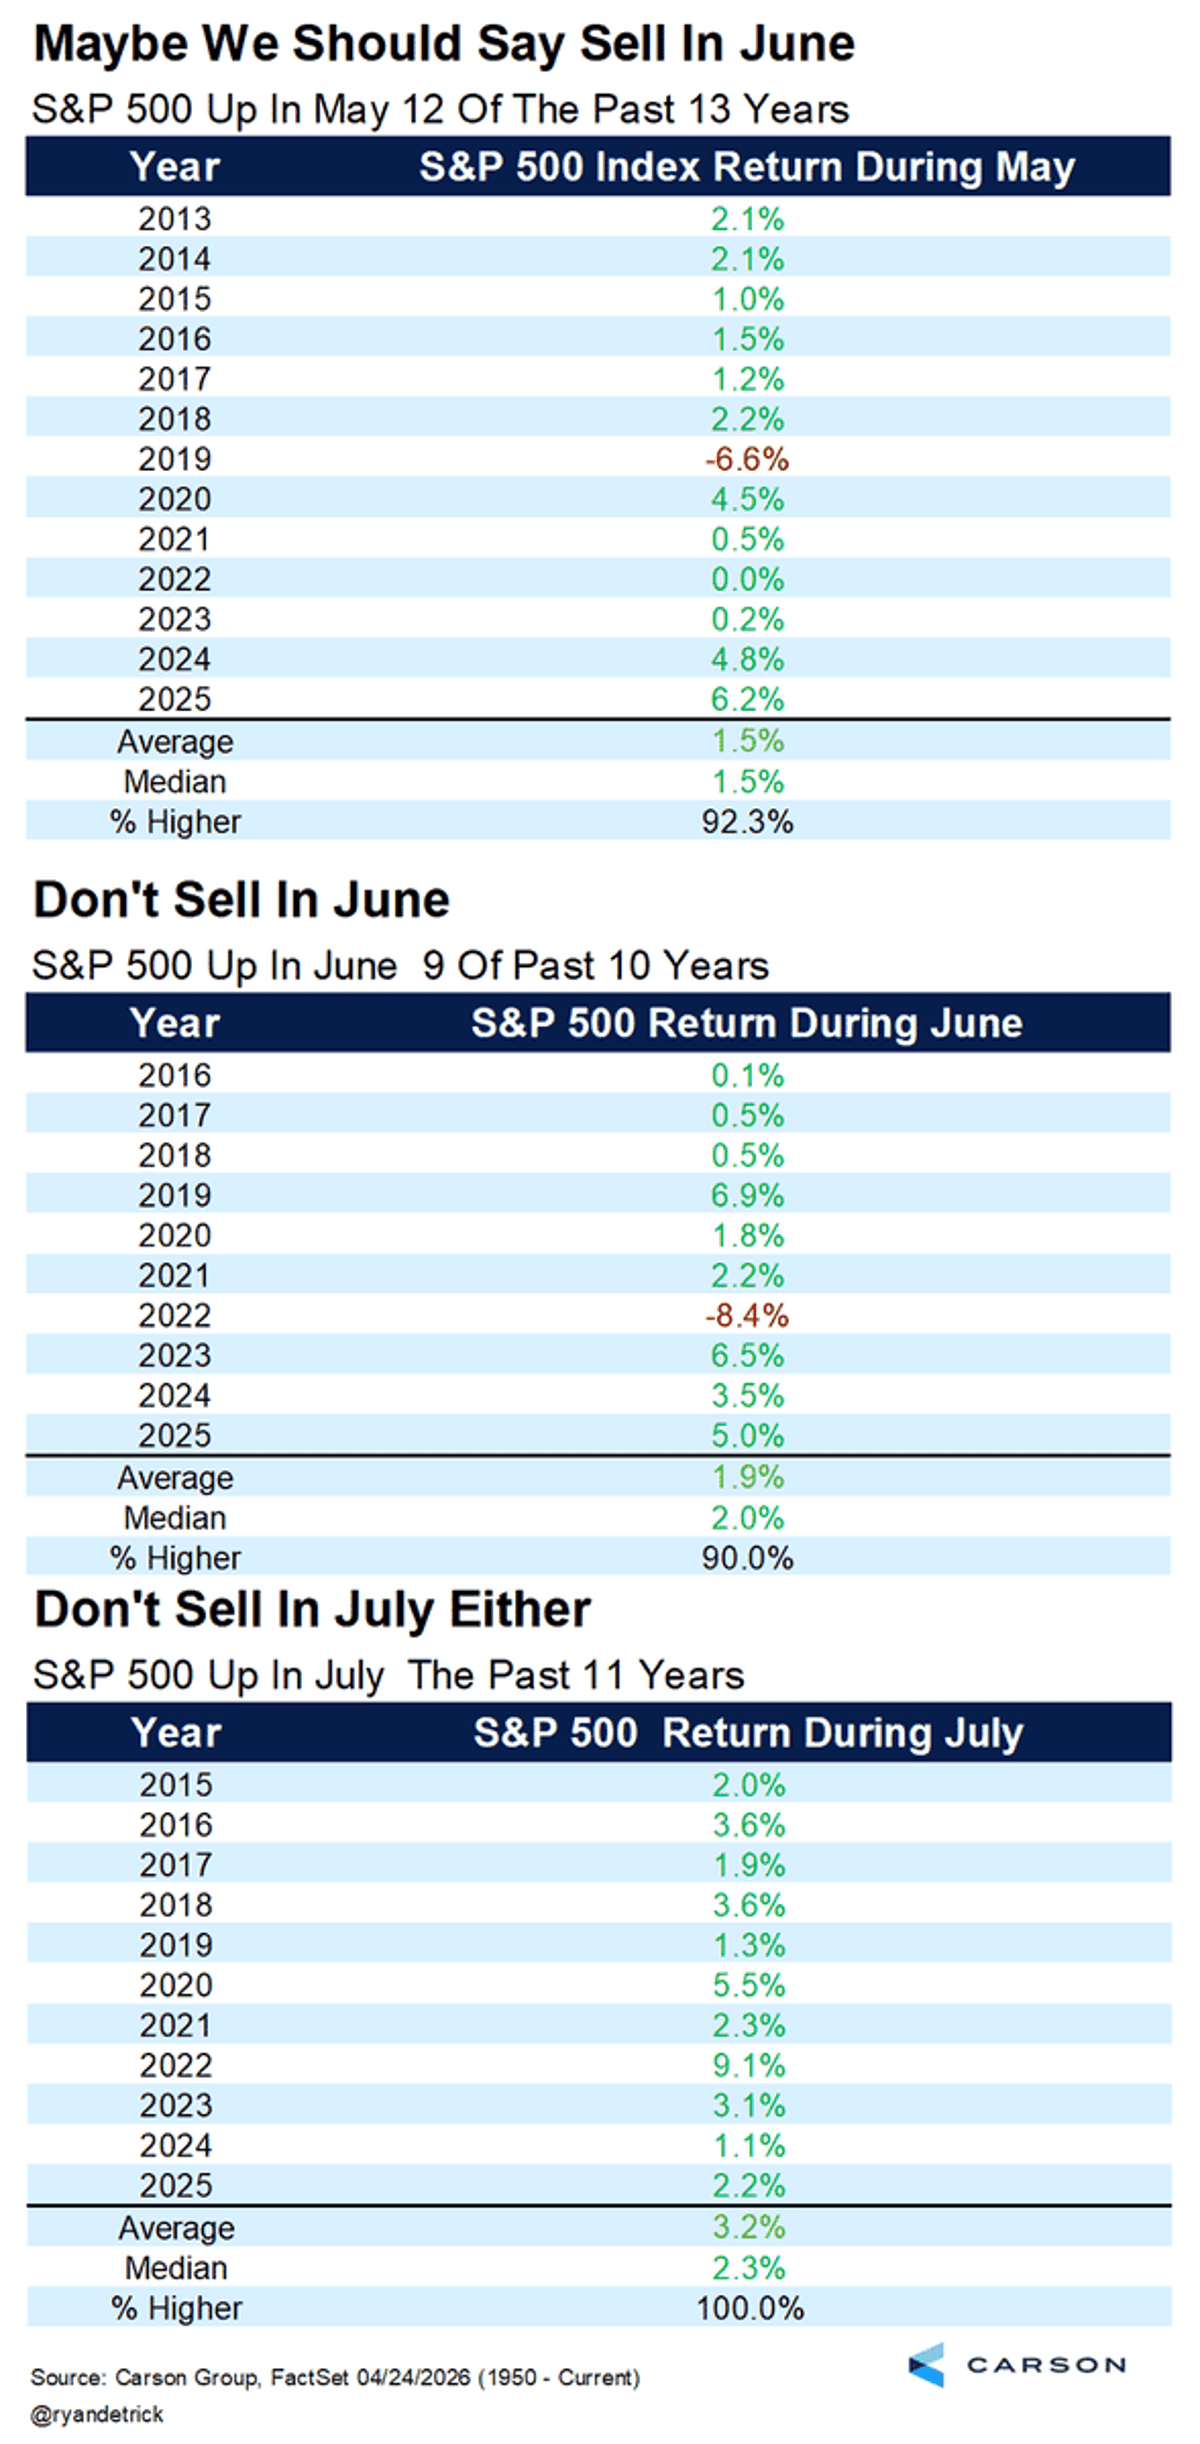
S&P 500 Historically Rallies in May, June, July
Love reading @dailychartbook each day, but even more when I realize I'm in there ;) 28. SPX seasonality. "The S&P 500 has been up 12 of the past 13 Mays. The S&P 500 has been up 9...

Models Predicted Higher Inflation, No Cuts Pre‑War
We've positioned our models for a world with a little higher inflation and probably no cuts. We were saying this even before the war started. This chart from @sam_gatlin is quite interesting.
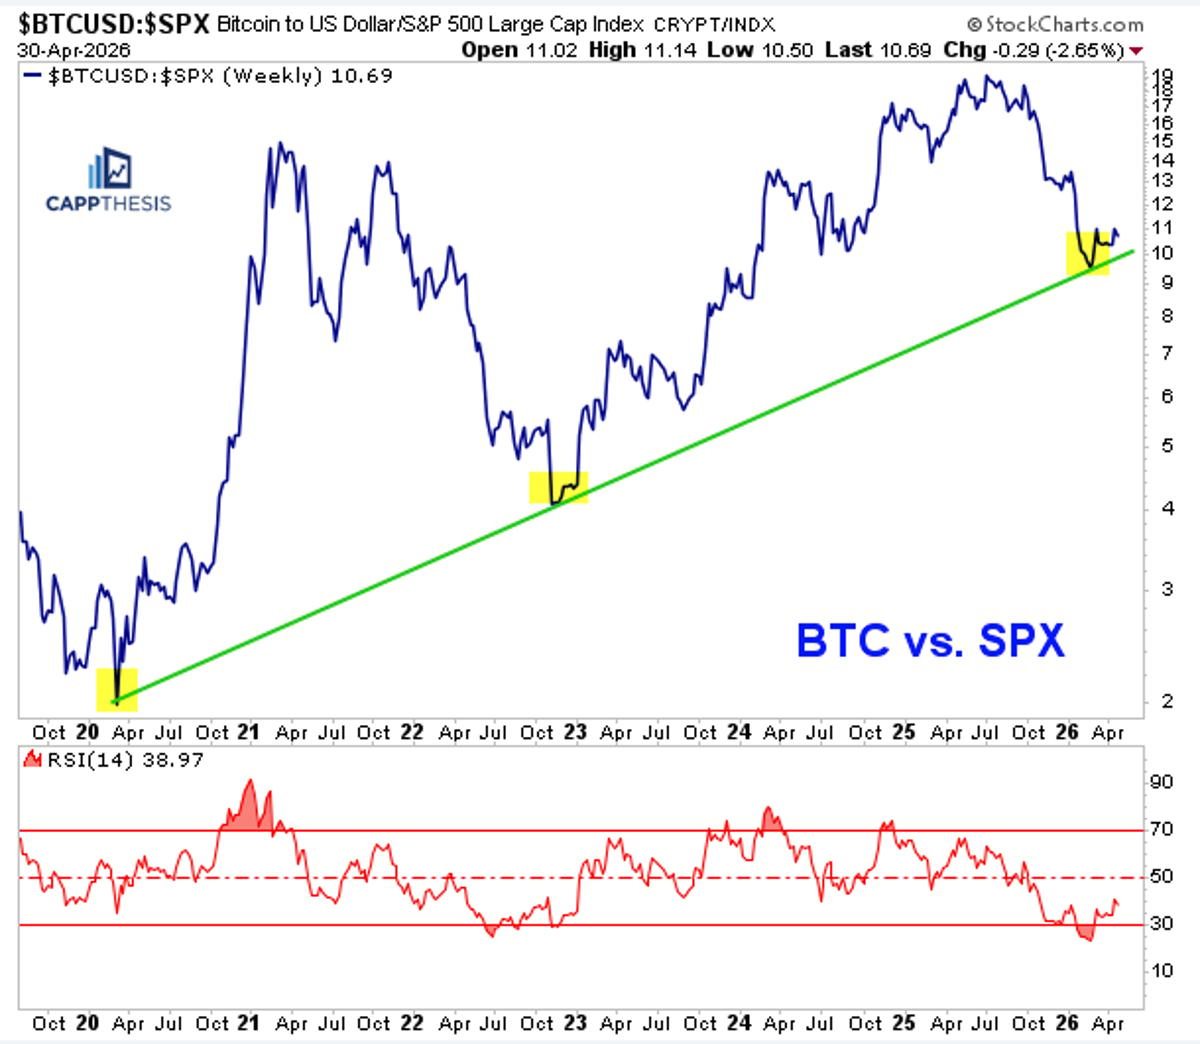
Bitcoin Vs. S&P 500 Near Critical Support Level
Bitcoin relative to the S&P 500 is down near potential support. Very interesting one from @FrankCappelleri in his note this AM. https://t.co/Qas4p5Pchb

Gold vs Fed: Facts Over Feelings
Talking about gold and the Fed with @sonusvarghese on our latest Facts vs Feelings. 🪙 🥇 https://t.co/0u5OIKvnbL
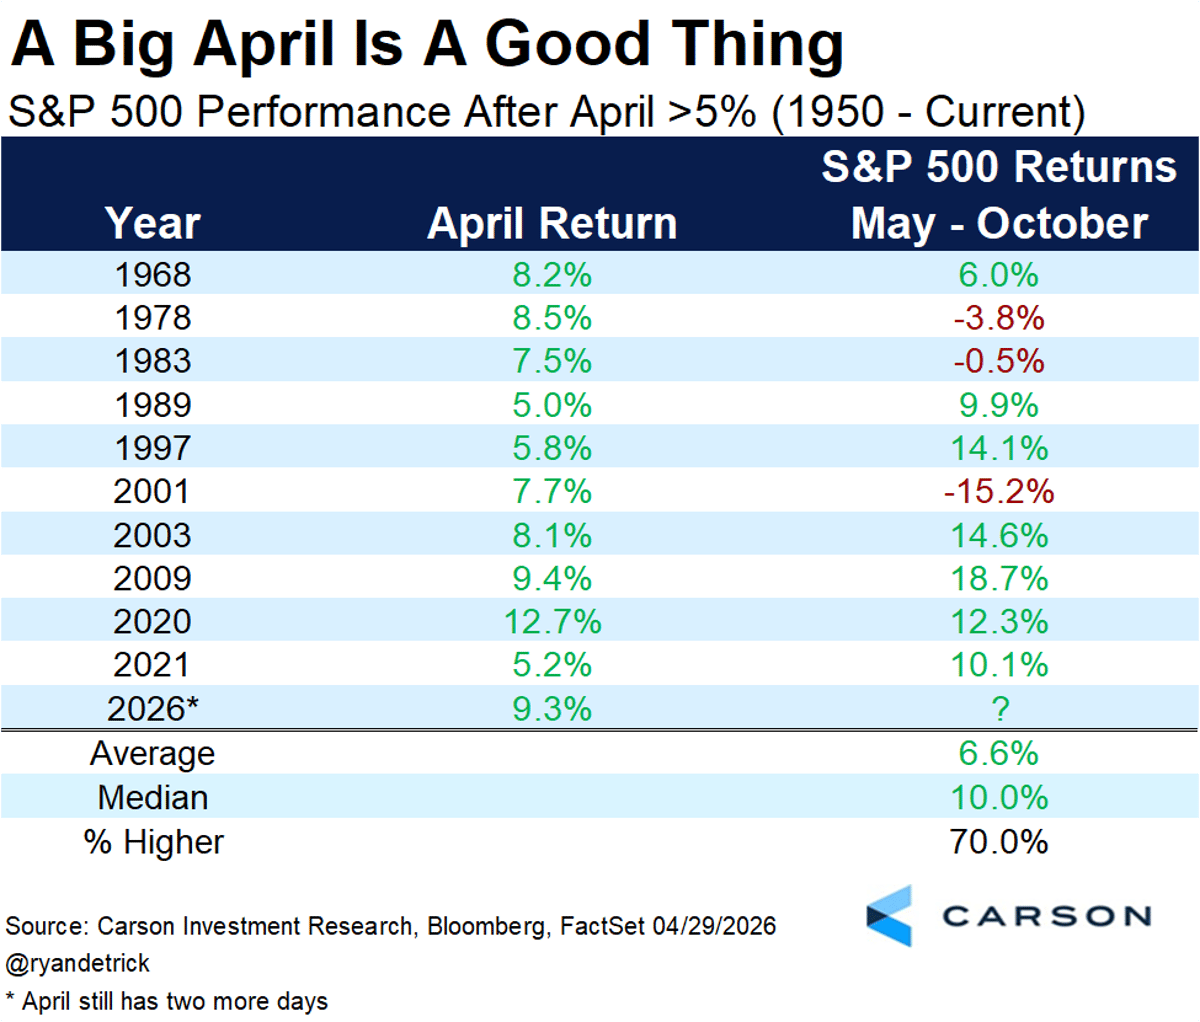
April Gains >5% Boost Six‑Month S&P Returns
These next six months average only 2.1% for the S&P 500, which is the lowest out of all 6-month combos. But when April is up >5%, it jumps to an average of 6.6% and a median of 10%. https://t.co/KsET0NcwKJ
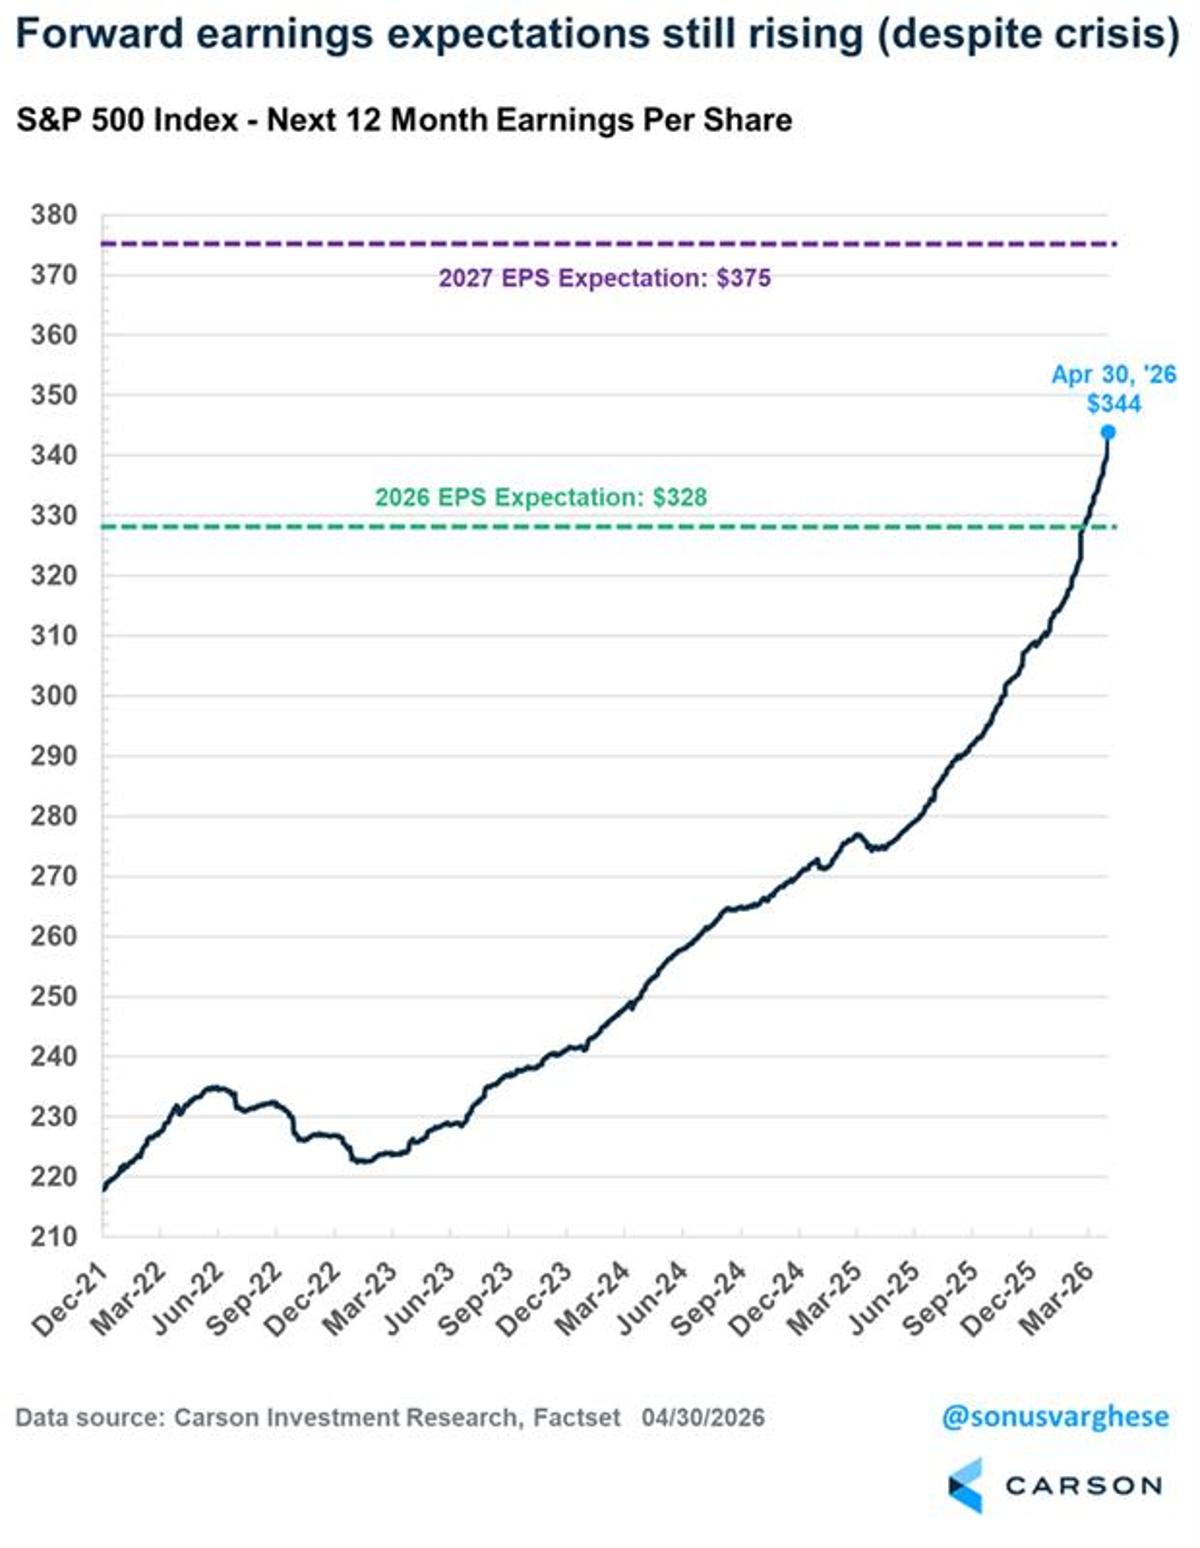
S&P Earnings Surge, Margins Hit Record, Stocks Cheaper
12-month S&P 500 earnings estimates are up an incredible 10% YTD, with 6.5% coming since the war started. Also, profit margins hit a new high of 15.2%. Lastly, stocks are up more than 5% YTD (total return), but they are...
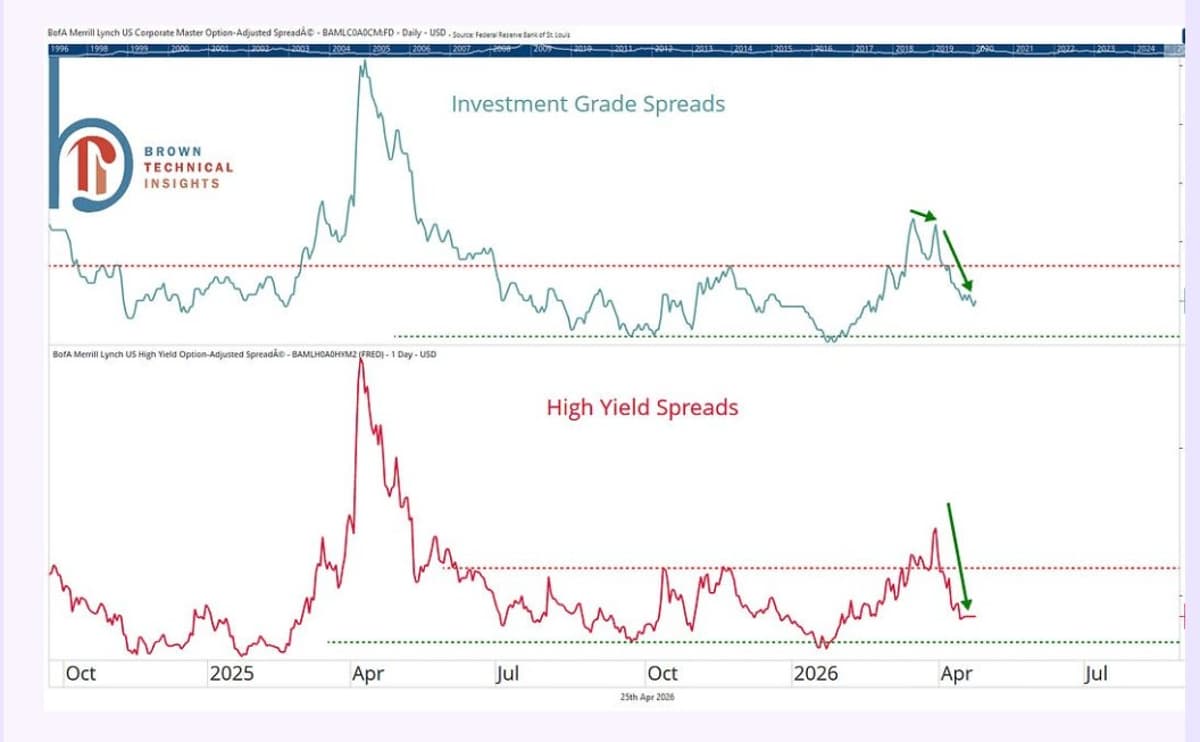
Credit Spreads Rebound, Easing Crash Concerns
Nice report from @scottcharts this morning. This one stood out, as credit spreads have quickly recovered. Even four weeks ago, one of the reasons we didn't expect a major crash like so many was spreads were still relatively calm. Follow credit...
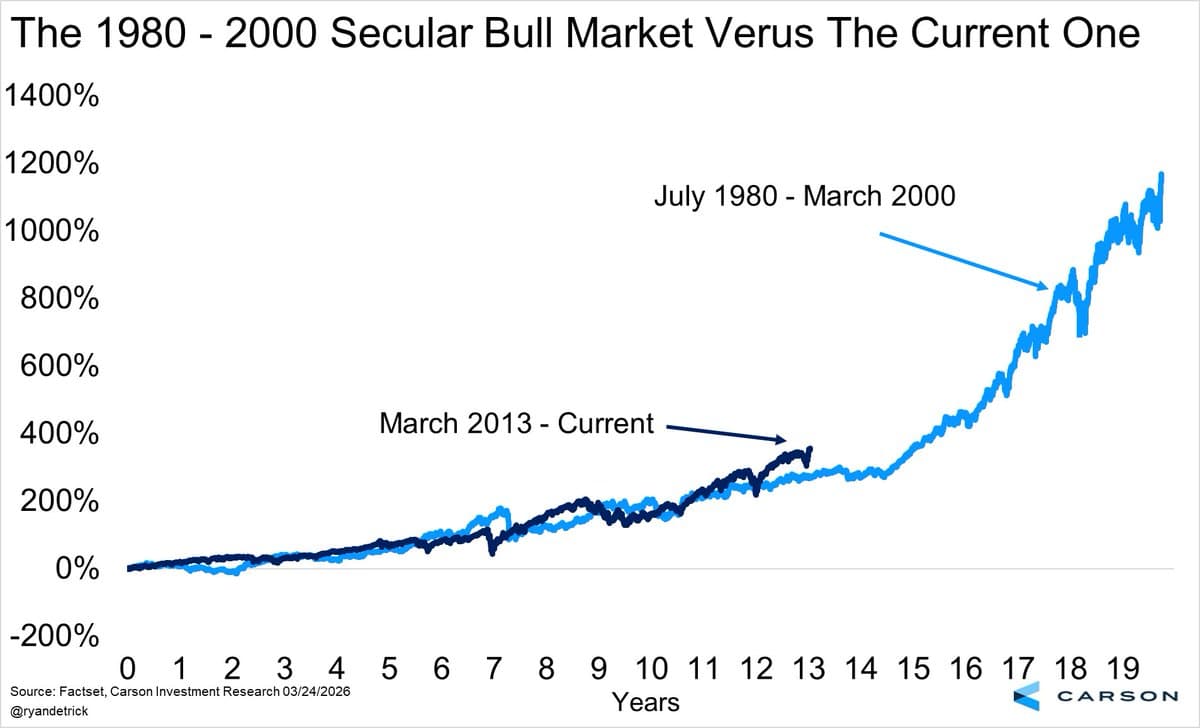
Current Bull Market May Outlast Expectations
The last secular bull market lasted nearly 20 years. This one is just over 13 years. Be aware this could still keep going much longer than most think. https://t.co/PuugiQYYsR
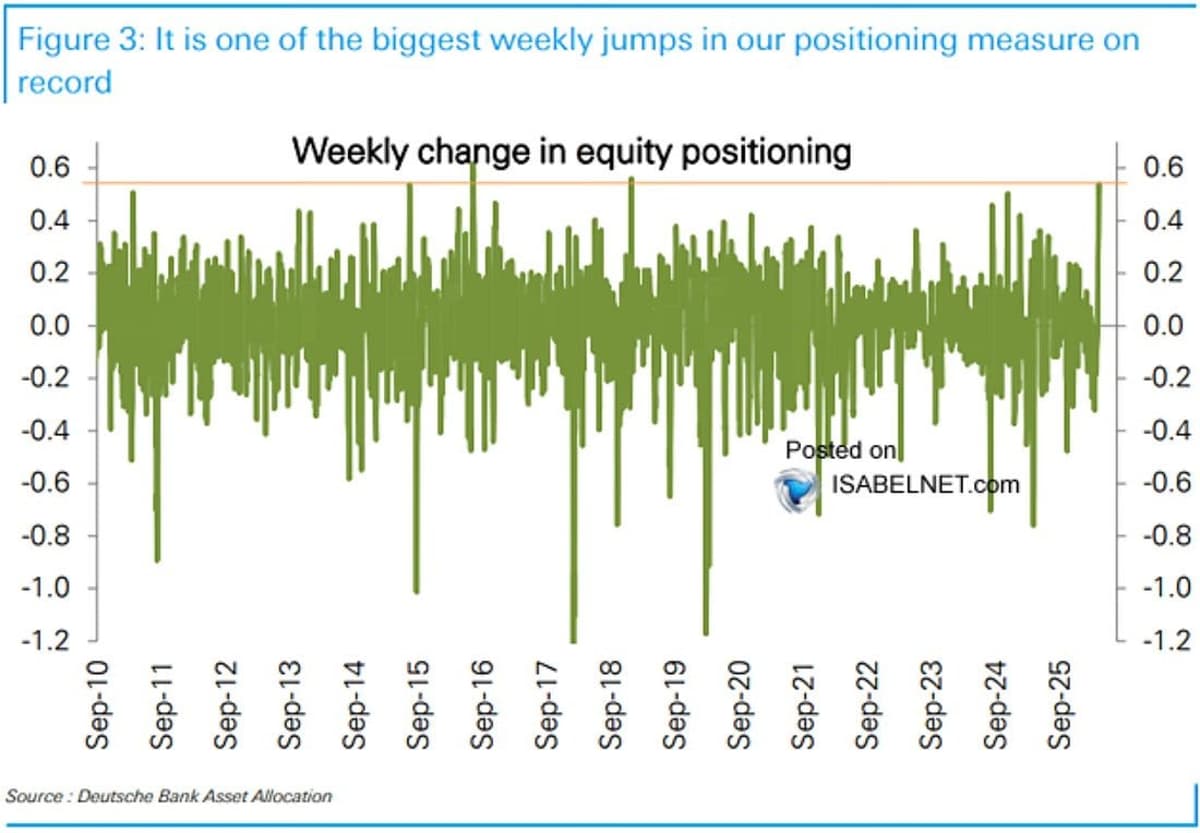
Record Money‑Market Outflows Spur Historic Equity Surge
Back in the pool? Record money market outflows and historic single-week jump in equity positioning. Also, AAII bulls largest weekly jump since Jan '25. Thanks @EricSoda for sharing these in your note today. https://t.co/WL1QFkNGnx
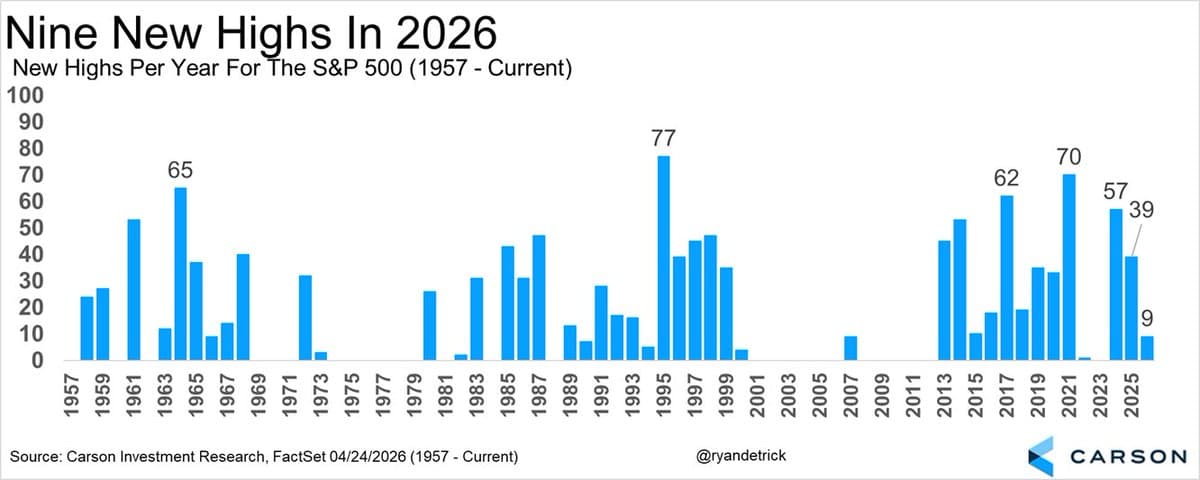
2026 Ties 2007, 1966 with Nine S&P Highs
That is nine new all-time highs for the S&P 500 in 2026. 2007 peaked at nine, so did 1966. https://t.co/M0iY2xMTgy
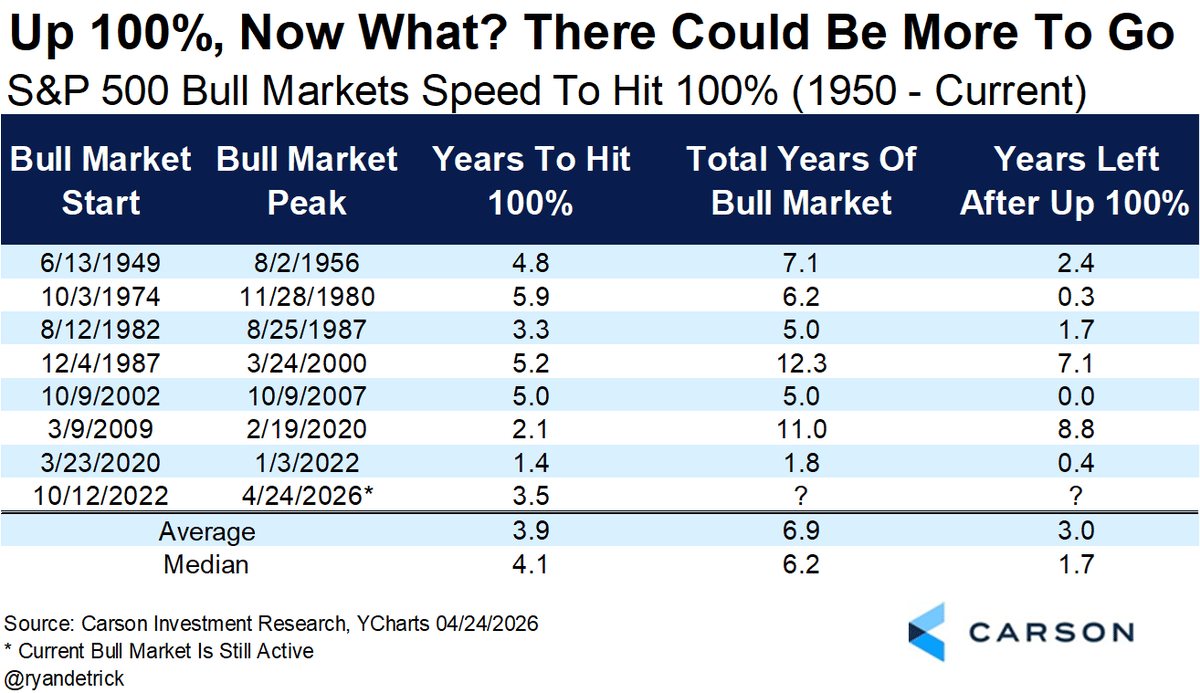
Bull Markets Double in ~3.5 Years, Then Linger Another Three Years
It took 3.5 years for this bull market to double, a tad faster than normal. Did you know after previous bull markets doubled they had another three years on average left? https://t.co/0yTMAlZpem
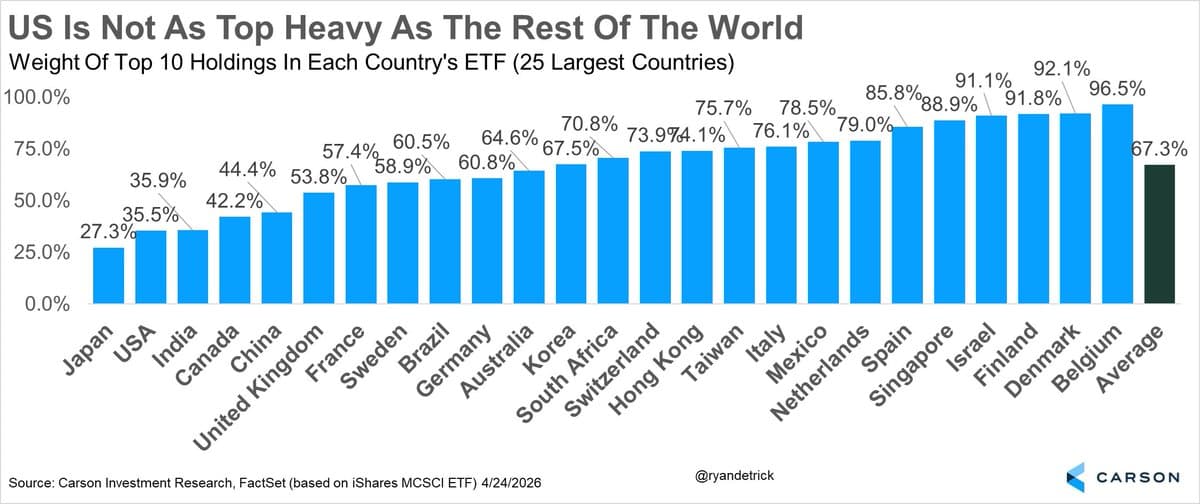
US Market Not Top‑Heavy; Dollar Still Reserve Power
Two myths that aren't true 1.) The US stock market is top heavy 2.) The US Dollar is losing reserve status Neither are remotely true, yet we hear them all the time https://t.co/ONyZtCOXpe
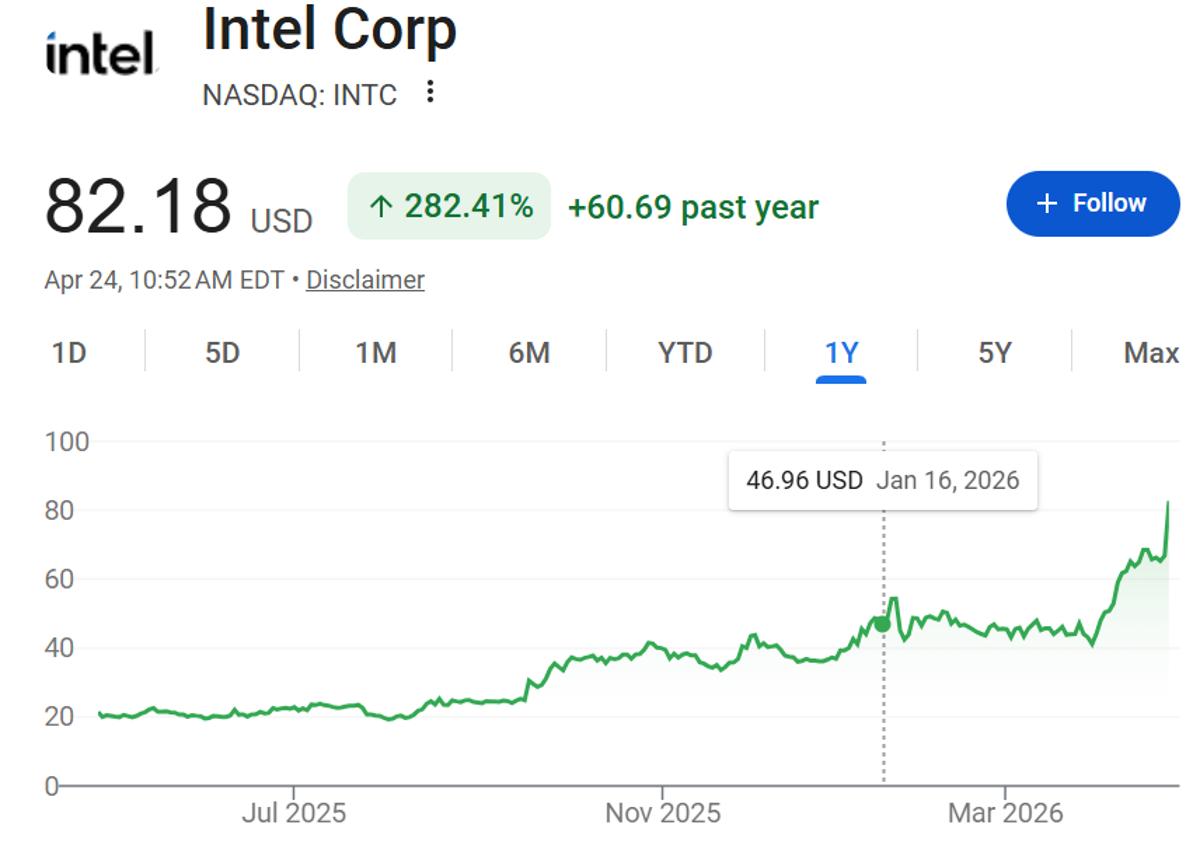
US Government
The US government owns 9.8% of Intel and NVIDA owns another 4.5%. Not bad. https://t.co/UZRPnEpE5H
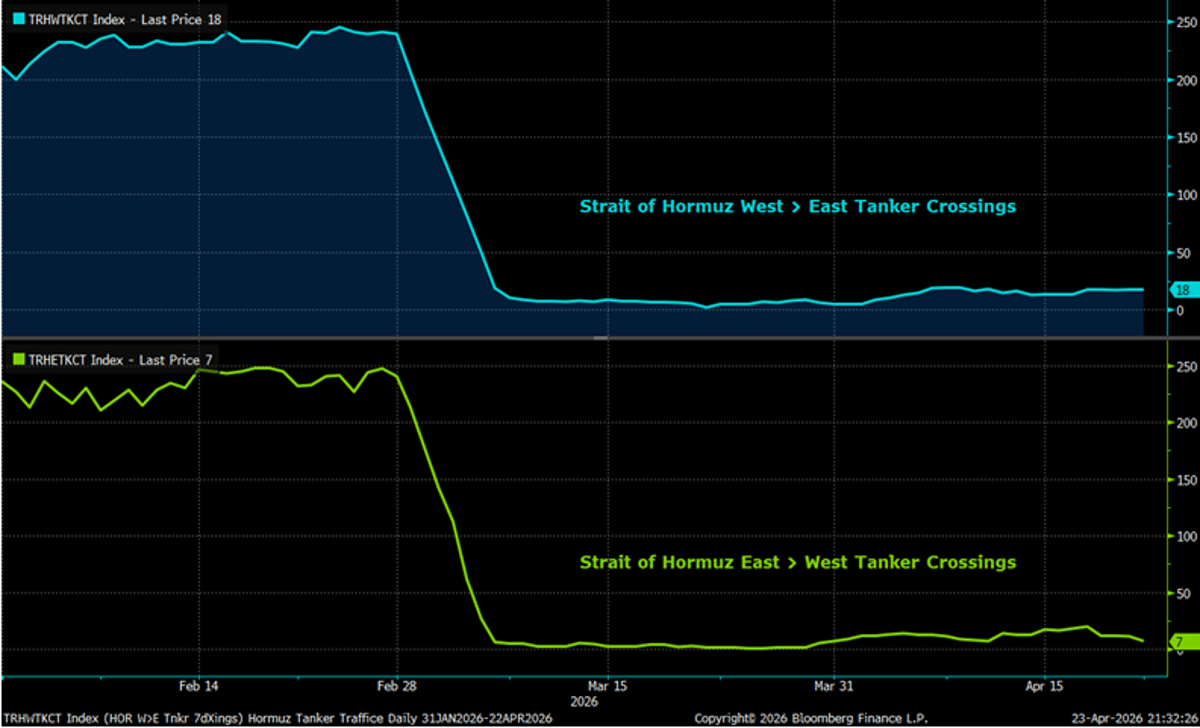
Strait of Hormuz Declared Open, yet Traffic Declines
He might still be in X jail, but interesting note from @sonusvarghese here. Last Friday (April 17th), President Trump and Iran’s foreign minister declared that the Strait of Hormuz was open. Over the past week, tanker crossings across the Strait have...
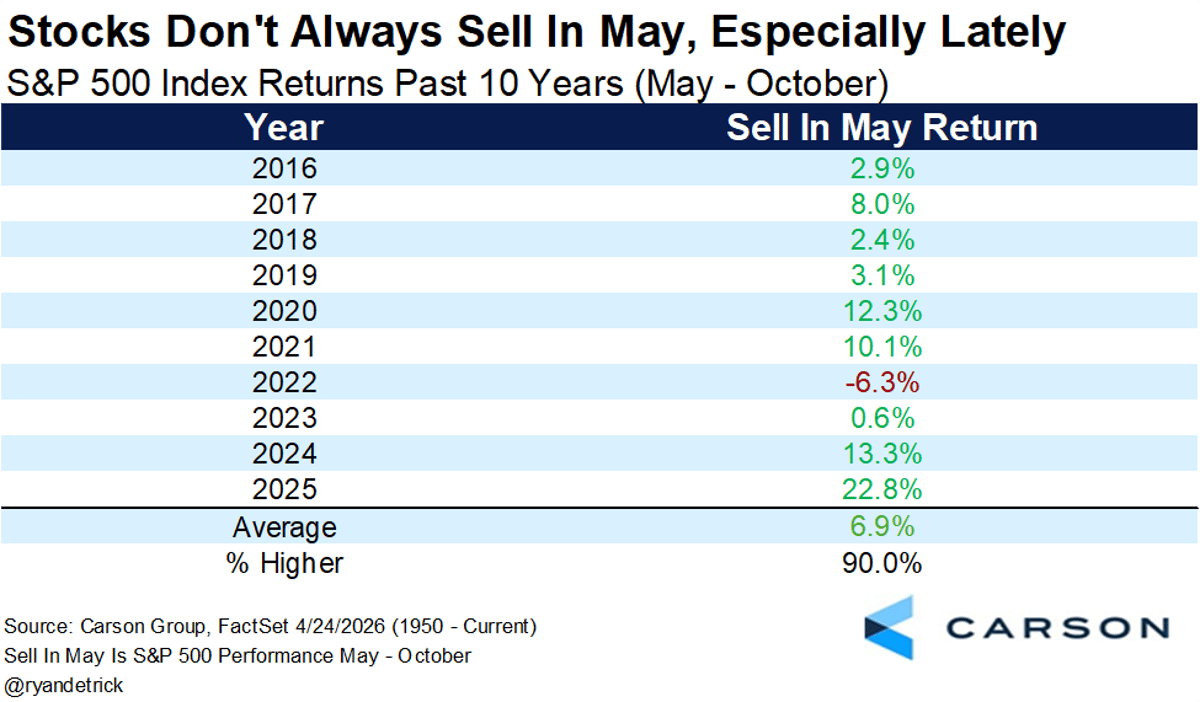
Sell‑in‑May Returns Surge Again After Historic 2023
Yes, the worst six months are coming up soon (May - October). But these six months have been lower only once the past decade and last year was the greatest Sell in May return ever (+22.8%). We are expecting another strong...
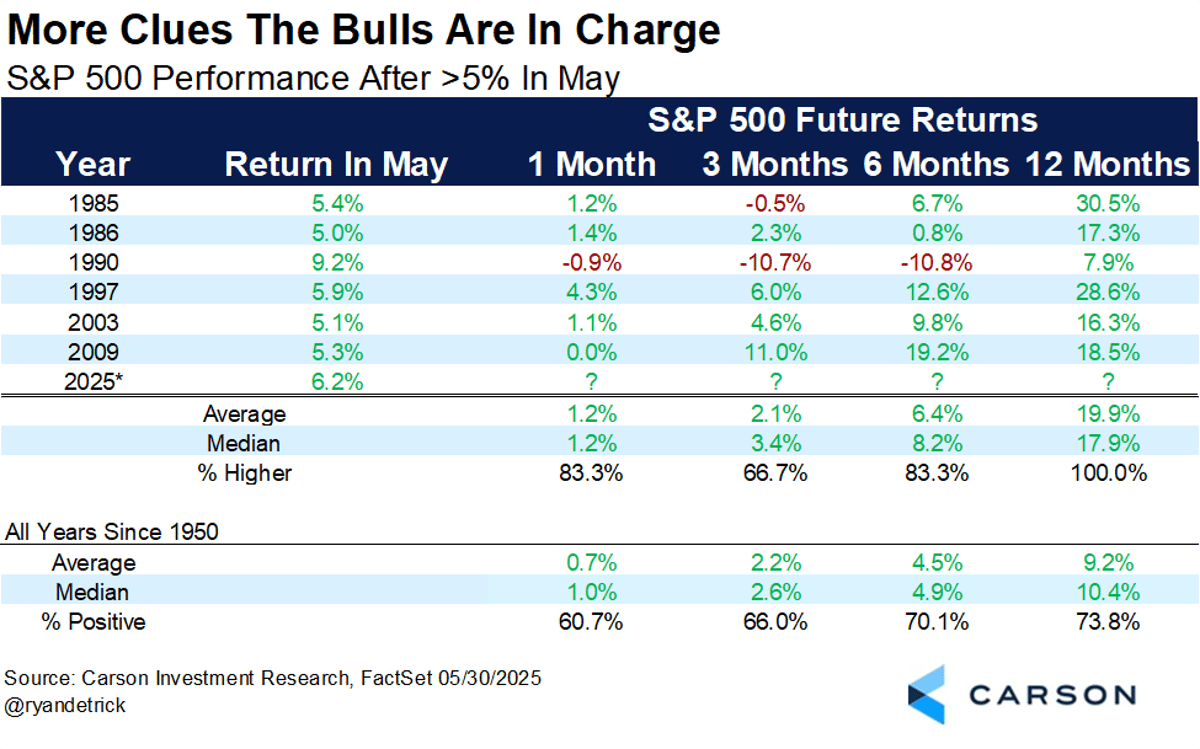
May Gains >5% Signal Strong Year-Long Returns
We shared this last year, but amazing how well it played out. Historically, no month sees better future returns when it is up >5% than May. Up 19.9% a year later and never lower. https://t.co/HxIeQFLYDa

Building AI Models Like Real-World Construction
Stuff is getting built in the real world and this is how we've built the models we run. @sonusvarghese and I discussed it on our latest Facts vs Feelings. https://t.co/5VhJA4WK7A
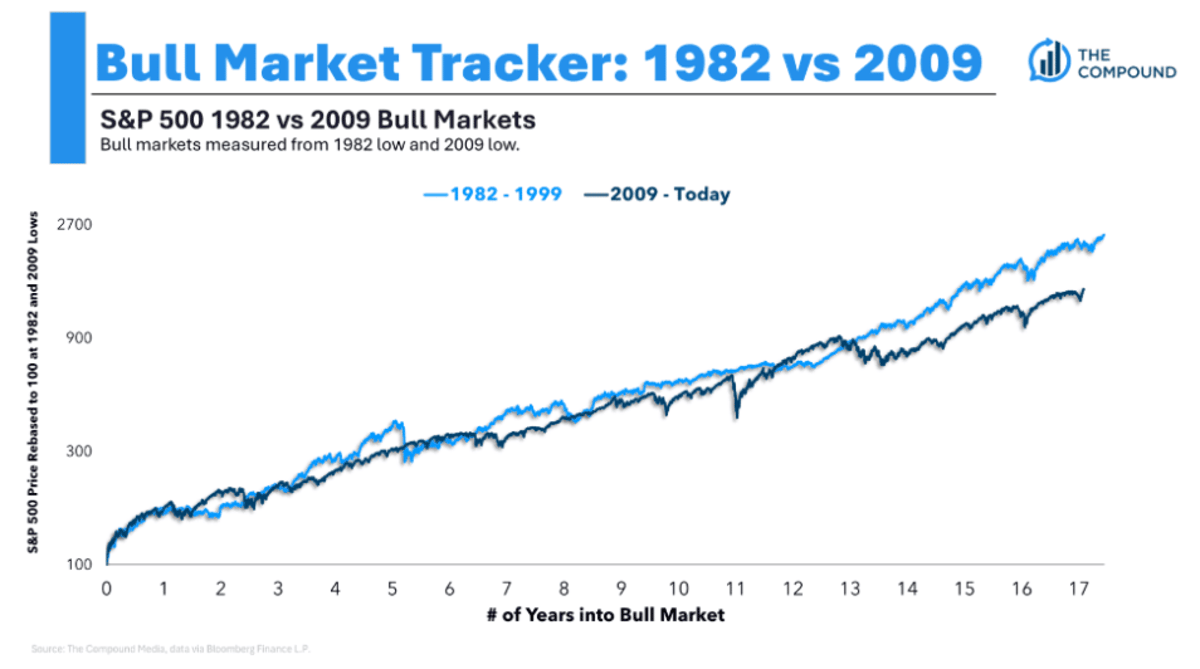
Secular Bull Markets Can Endure Far Longer than Expected
Wild chart on Animal Spirits this week with @michaelbatnick and @awealthofcs. I'm more of a 'this secular bull started in 2013 on the beakout' guy, but this hammers home how these secular bulls can last much longer than most could ever...
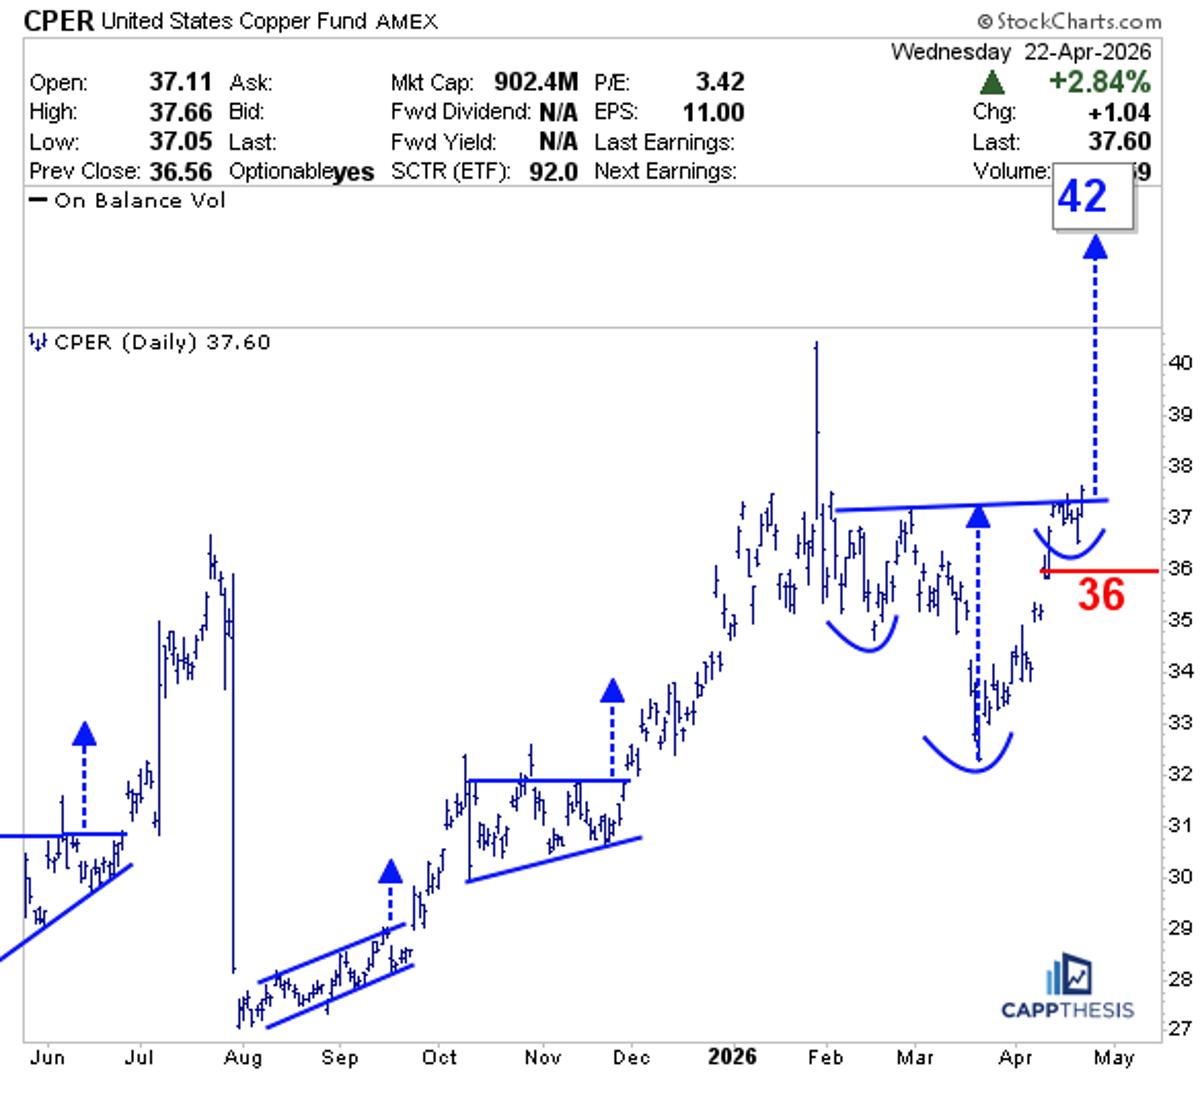
Copper's Bullish Surge: Few Portfolios Ready to Profit
Quite the bullish outlook for copper from @FrankCappelleri in his note yesterday. Should this happen, how many portfolios are built to benefit from it you think? I'm guessing not many. https://t.co/3Hio1we0O0
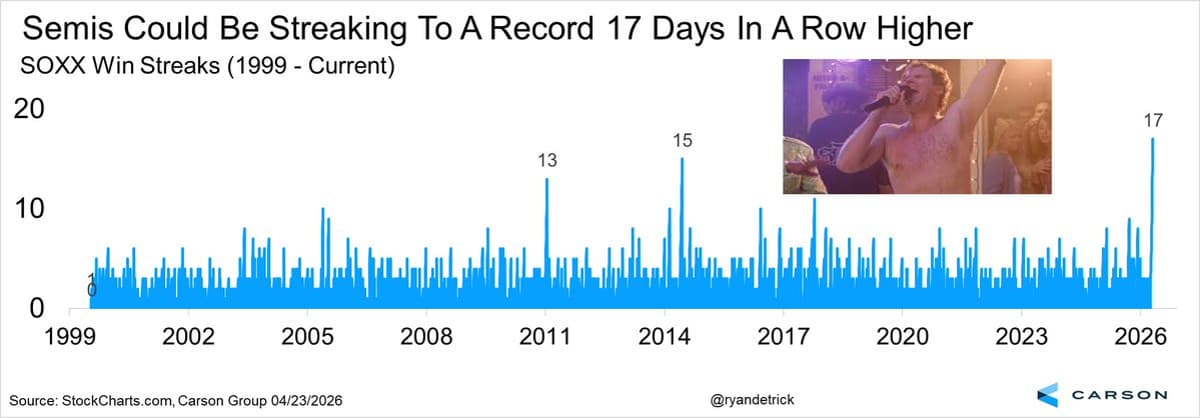
Semis Enjoy Record 17‑day Green Streak
It is green right now, which would be a record shattering 17 days in a row higher for semis. That is quite the streak. Frank the Tank is smiling at this type of streak. https://t.co/Dd3L75talj
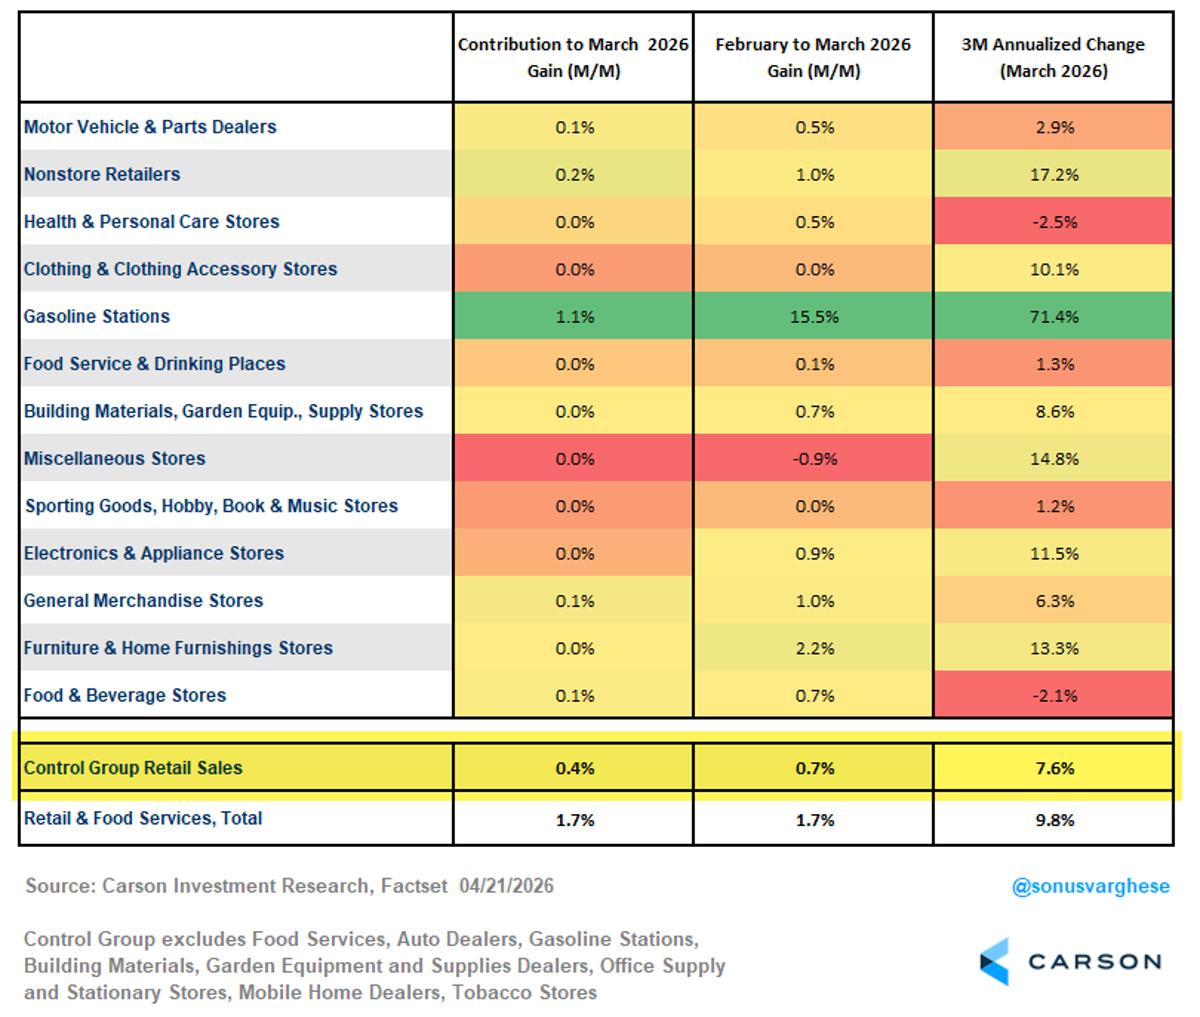
Retail Control Group Surges 7.6% Annualized, Excluding Gas Stations
Diving into yesterday's retail sales, the control group is up a very impressive 7.6% annualized the past 3 months. Yes, gas station sales are up a lot, but remember, they aren't included in the control group. https://t.co/PLg5UQX8Ah
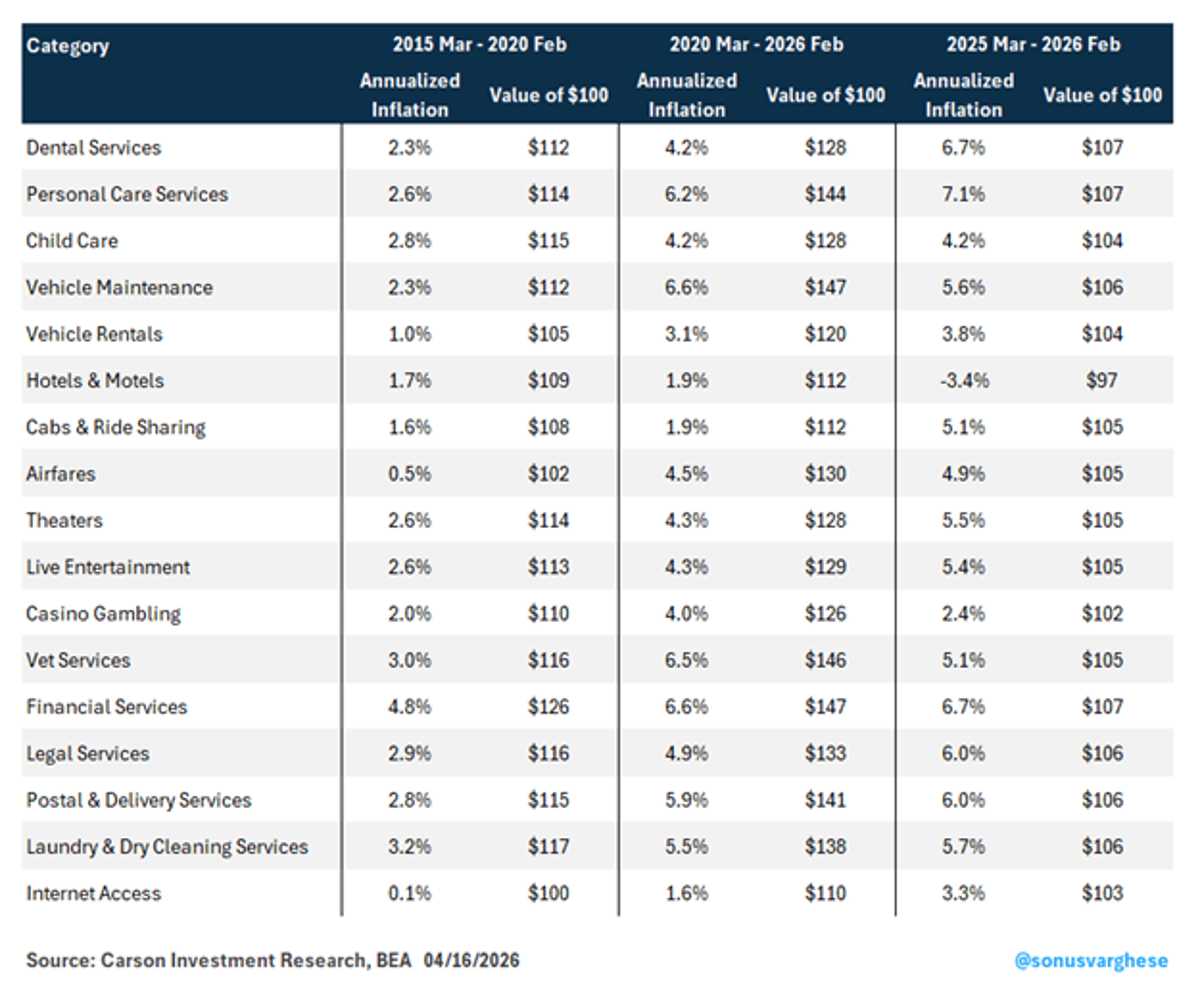
Inflation Surges Across Everyday Items, War Not Sole Cause
Even before the war, we were in the camp that inflation was a bigger issue than most realized. Really neat table from @sonusvarghese that shows various common goods and services we all use, but broken down by annualized inflation over certain...
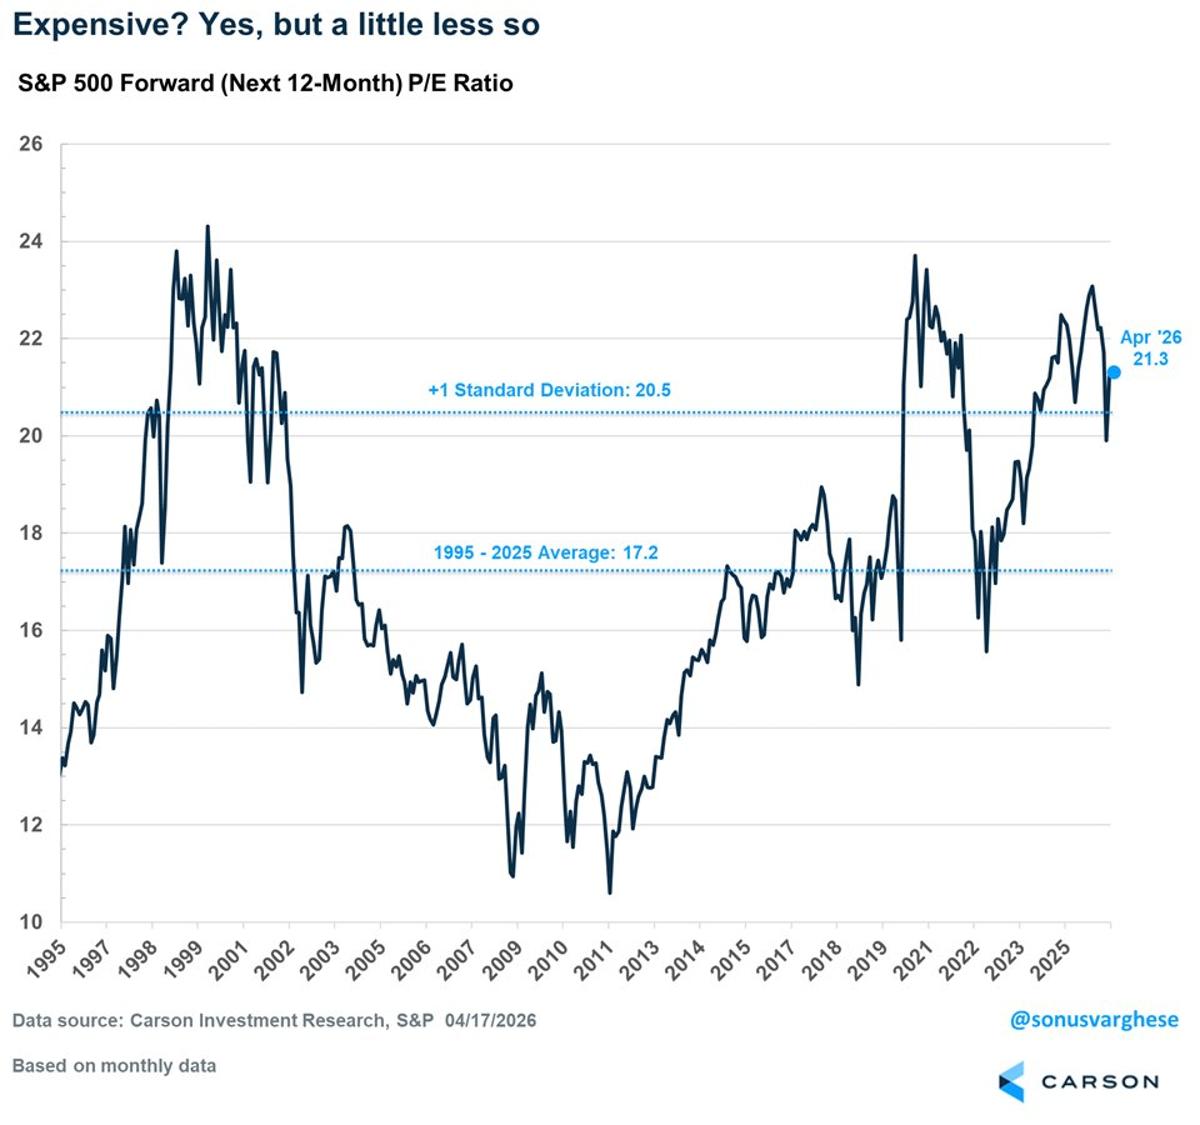
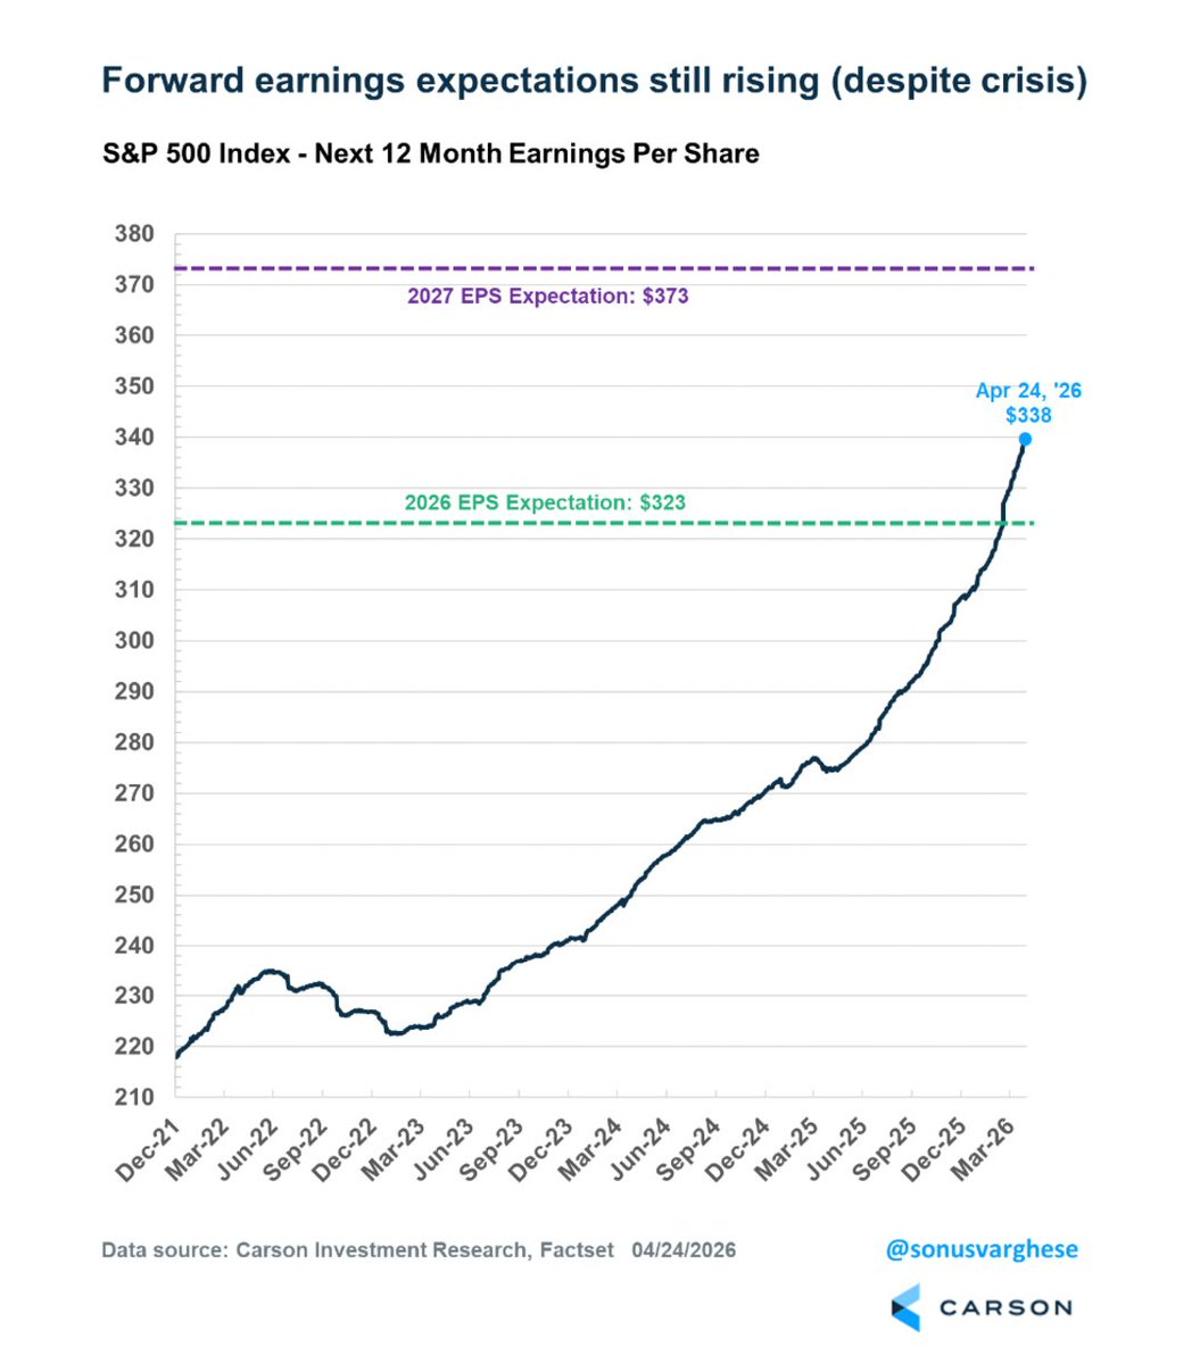
Rising EPS Forecasts Lift Stocks Despite High Valuations
Stocks are somewhat pricey based on history, but not as much as they were at the start of the year. Oh, and EPS and profit margin 12-month estimates have gone vertical. That is why stocks are back to new highs....
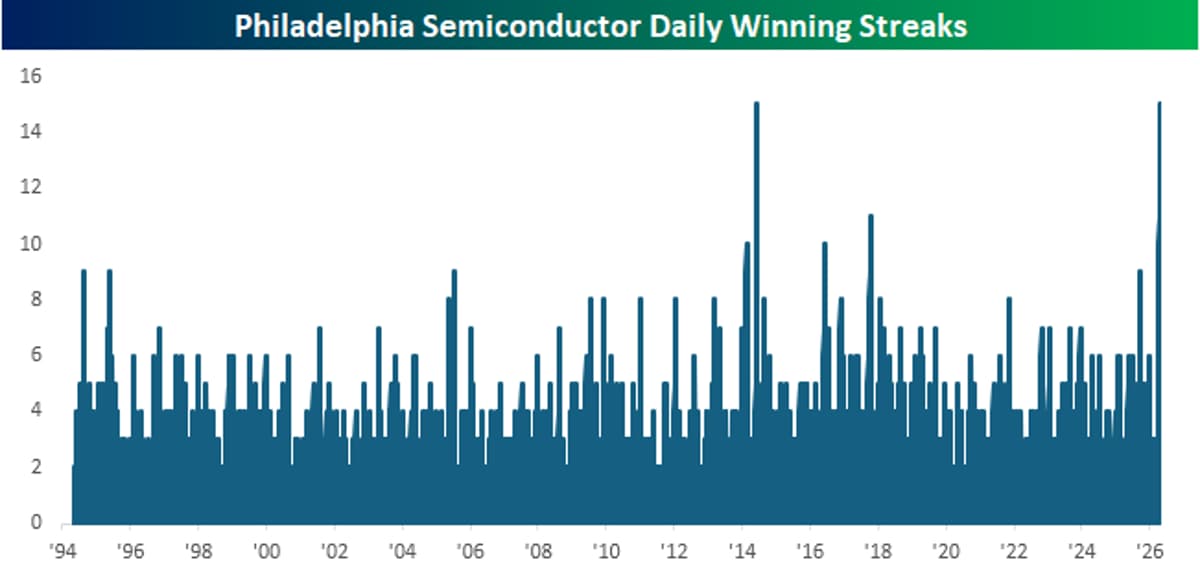
Semiconductor Index Sets Record 15-Day Streak, Eyes 16
Incredible chart from @bespokeinvest in their always must read note this AM. Semis are up a record tying 15 days in a row and looking at futures, we might hit sweet 16. https://t.co/Odd0mVjdX5

Muni Bonds: Underrated Gem for Savvy Investors
Muni bonds don't get discussed all that often, but for the right investor, they make a ton of sense. Great look at it all from @gilbert3142 on our team. https://t.co/3RC2usnSOx