

Top Value Investing Updates and Conference Highlights 2026
This week in value: VALUExBRK 2026 | Bill Ackman, Mohnish Pabrai, Tom Gayner, Chris Bloomstran & More (Guy Spier) 2026 Value Investing Conference | Keynote Speaker: Dr. Stephen Penman (Ivey) First Eagle Global Value Team Commentary Q1 2026 (FEIM) Third Avenue Value Fund Q1 2026 Commentary (TA)

Spot Rare Market
Matthew Tuttle @TuttleCapital on: * Inverse ETFs Explained (SARK & Shorting ARK) * Can There Ever Be Another Warren Buffett? * The HEAT Investment Framework * Retail Investors vs Institutions * Why ARK Invest’s Performance Reversed * How to Launch a Successful ETF (Timing, Themes &...

Costs Surge, Firms Pass some, Growth Remains Modest
Costs are rising fast again. Companies are trying to pass it through, but not fully. Activity is expanding modestly.
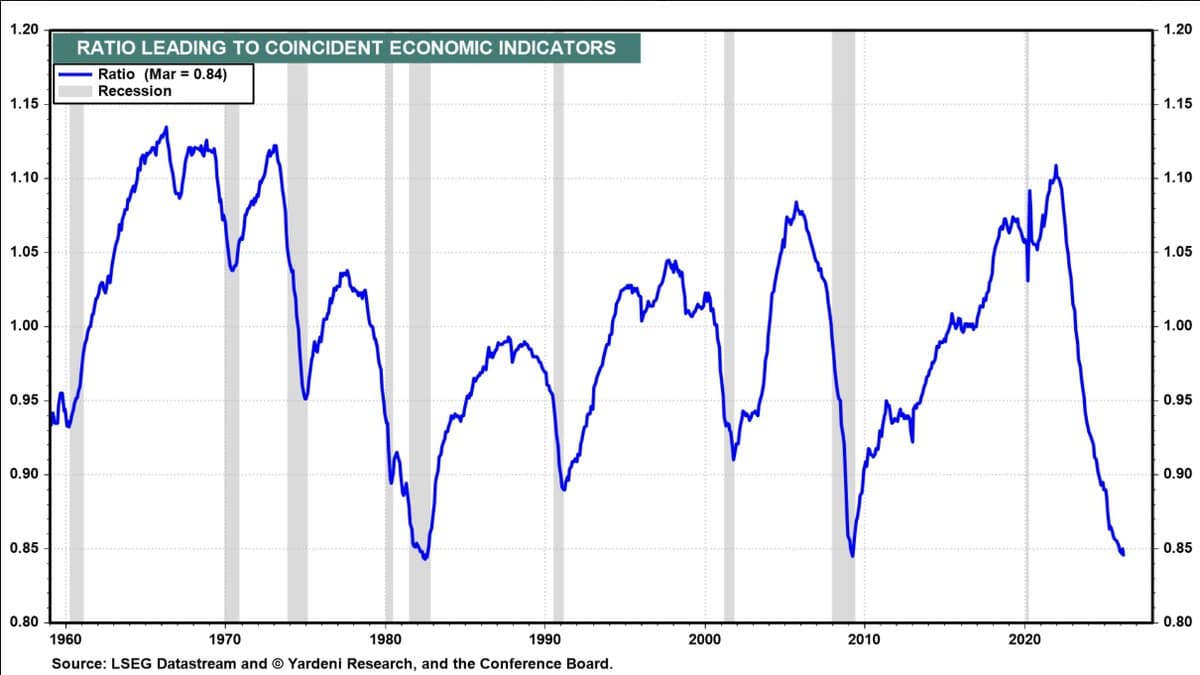
Historic LEI/CEI Low Signals Recession, Cyclicals Set to Crash
The ratio of Leading Economic Indicators (LEI) to Coincident Economic Indicators (CEI) showing the steepest decline in the entire history of the metric and now at a level typically seen during or just before recessions. Small/mid + cyclicals rip hard once...

Value Investing Outperforms: Owner Earnings Explained in Q1 Webcast
This week in value: Why value investing usually outperforms (LiveWire) Causeway International Value Q1 2026 Webcast (Causeway) What is Owner Earnings? (The Warren Buffett Guide) (OSV)
Consumer Spending Remains Resilient, No Recession Signal
The consumer is not collapsing. There's no recession signal here. Spending is resilient. Explains why earnings haven’t cracked and markets remain supported.
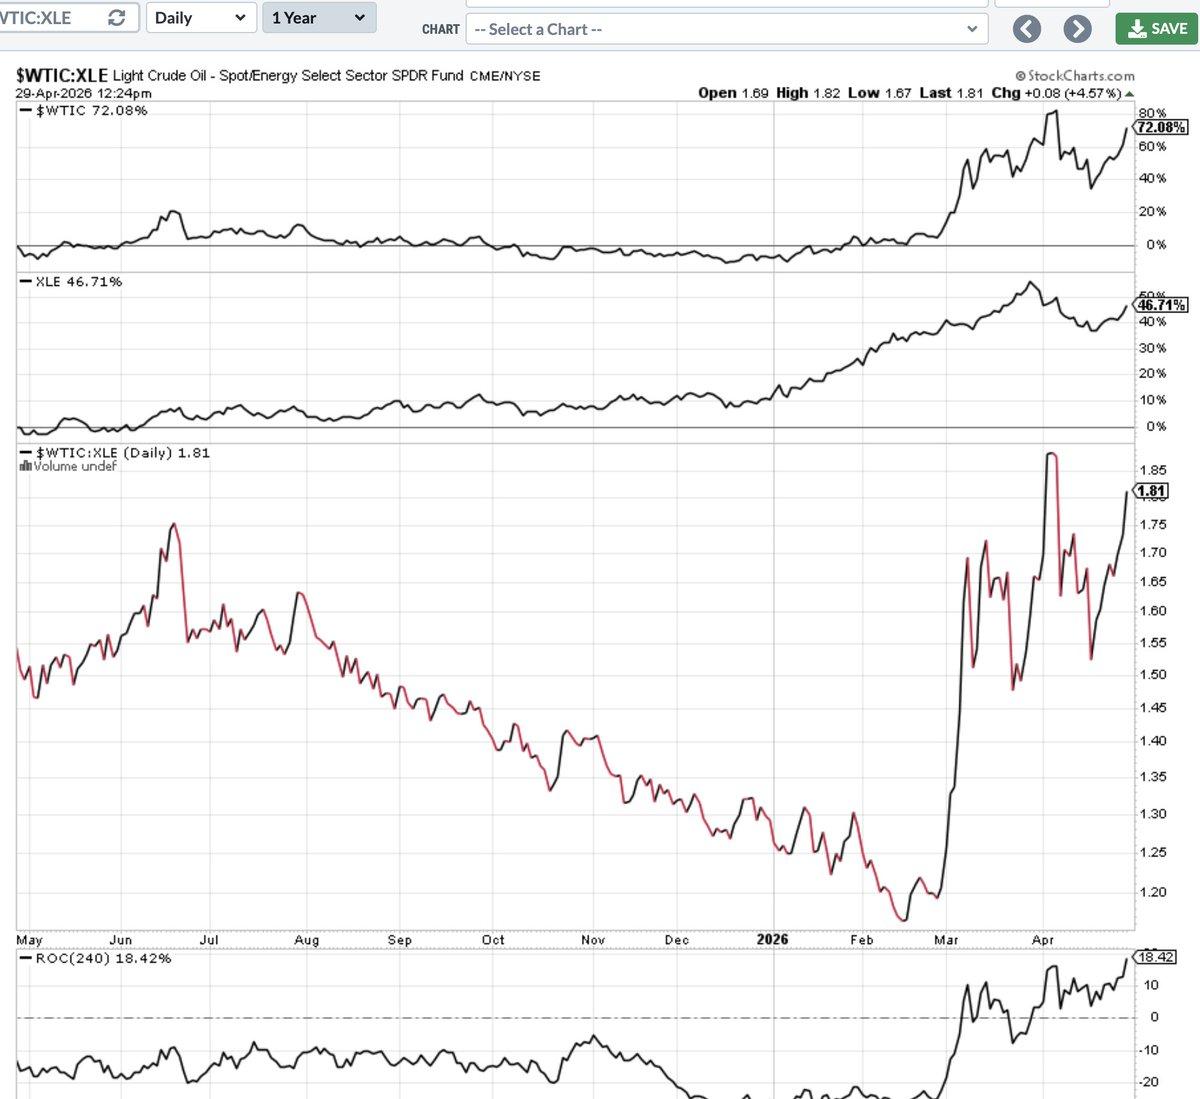
Rising WTI/XLE Ratio Signals Oil‑Led Market Shift
WTI crude 72% y-o-y vs XLE (energy equities) 47% y-o-y. * Rising ratio = oil outperforming energy stocks * Falling ratio = energy stocks outperforming oil The WTI/XLE ratio turning up is the signal. It suggests a shift from energy as mature, low...
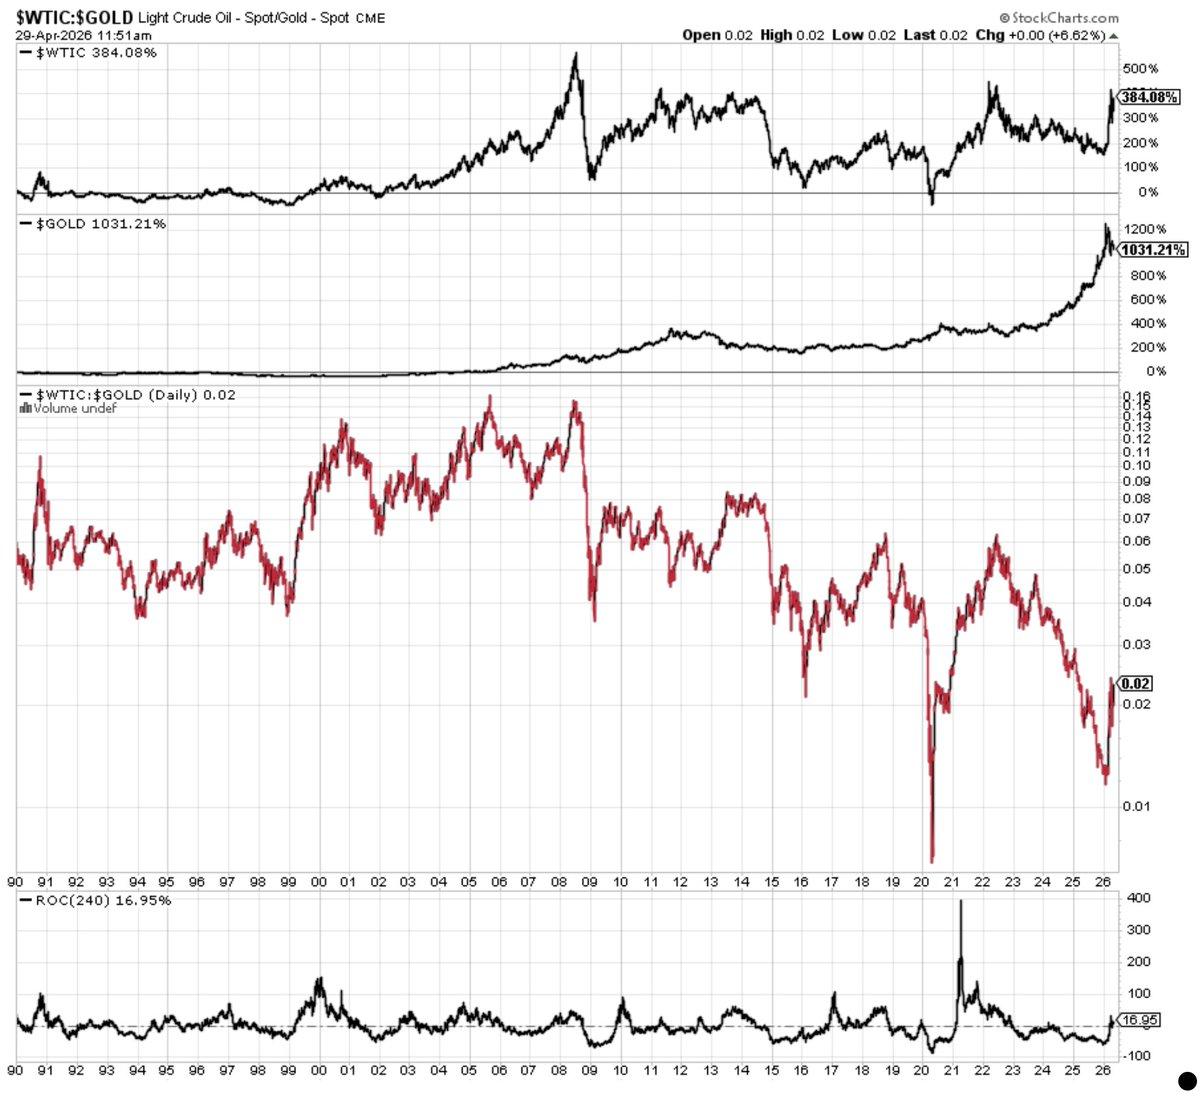
Oil's 70% YoY Rise Still Lags Gold Benchmarks
Oil is up 70% year-on-year but still not a particularly impressive run in hard-money gold terms. Only back to the 2016 low. https://t.co/O03mkZeW1S
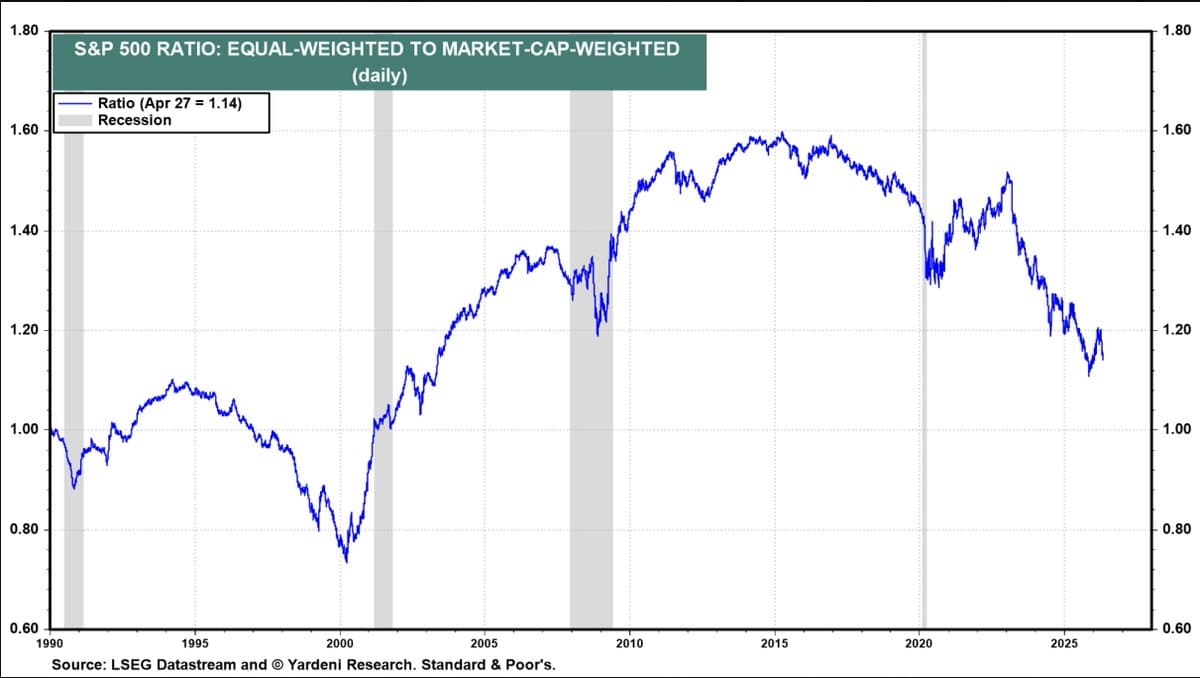
Mega Caps Dominate Again, Narrowing Market Breadth
We have seen a violent return to concentrated, large cap dominance since the start of this month (the little tick down at the end of the series). The chart is equal weight vs market cap: Rising ratio → the average...
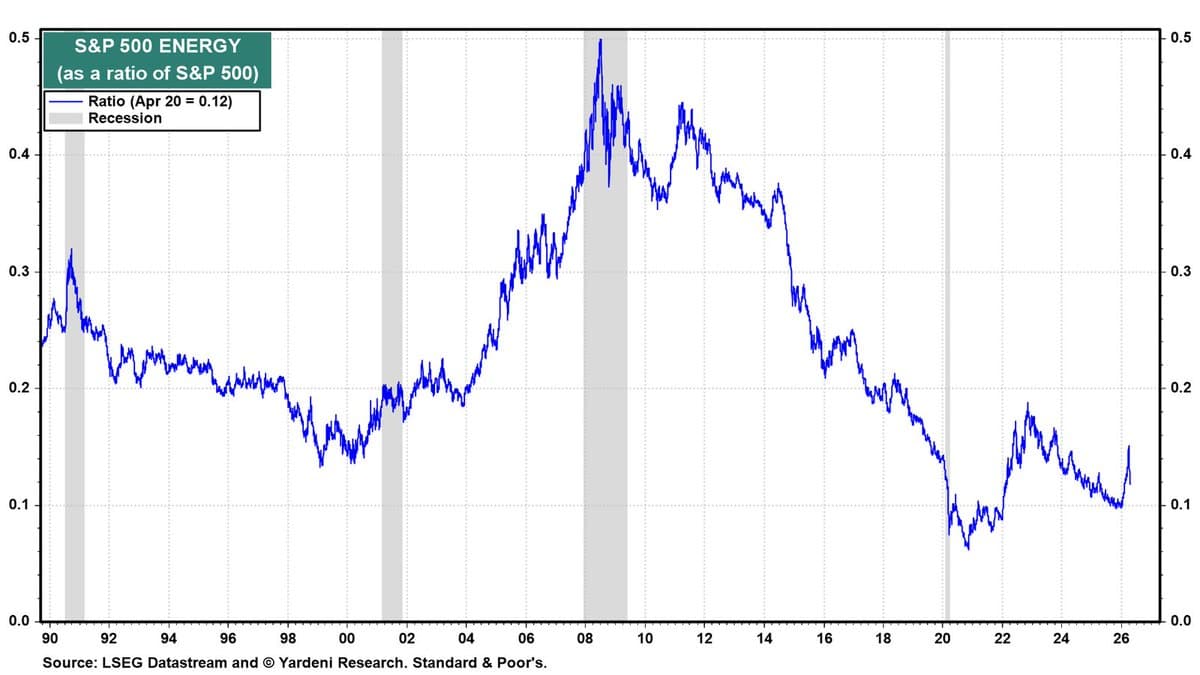
Energy Remains Structurally Under‑Owned in S&P 500
S&P 500 Energy as a share of the total S&P 500. Energy is still structurally under-owned https://t.co/d3AFCGEo9G

Geopolitical Tensions Revive Value Investing, Future Uncertain
This week in value: The Iran War Has Fired Up Value Investing. But What Next? (Bloomberg) A century of value investing (IFA) Why Value Investing Works (And Why It Has to Stop Working First) (Safal) Third Avenue Management: Small-Cap Value Strategy Overview and Insights...
Small‑mid Caps Poised to Reclaim Premium over Large Caps
Smalls and mids still trading at a big discount to large. Recovered a some of the discount but traded at a premium to large for most of the decade. Got to this level in 2022 before falling back. Question is...
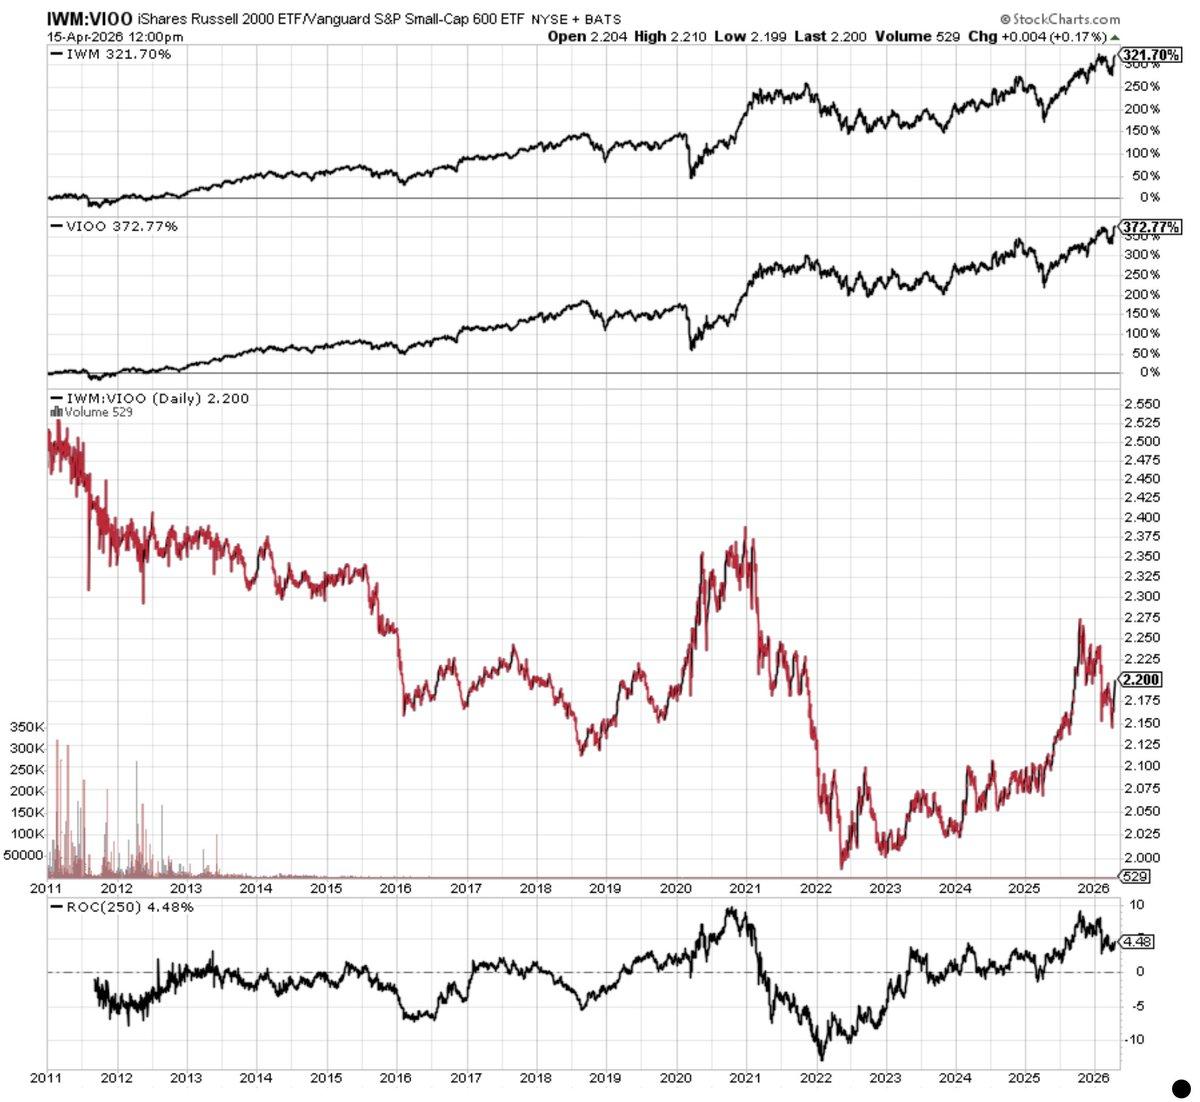
Quality Small Caps Win Long-Term, Junk Rallies Occasionally
We're in a late-cycle regime where quality still dominates—but with intermittent speculative rallies. Chart shows ratio of $IWM (Russell 2000, broader, lower-quality small caps) v $VIOO (S&P 600, higher-quality, profitable small caps). → When it falls, quality small caps outperform junky small...

Housing Market Shifts to Demand Destruction, Setting up Snapback
The housing market has flipped from scarcity → demand destruction. Prices likely soften, but the bigger story is collapsed activity. This is a rate-driven cyclical slowdown, not a balance-sheet crisis. It sets up a future snapback trade once affordability improves.
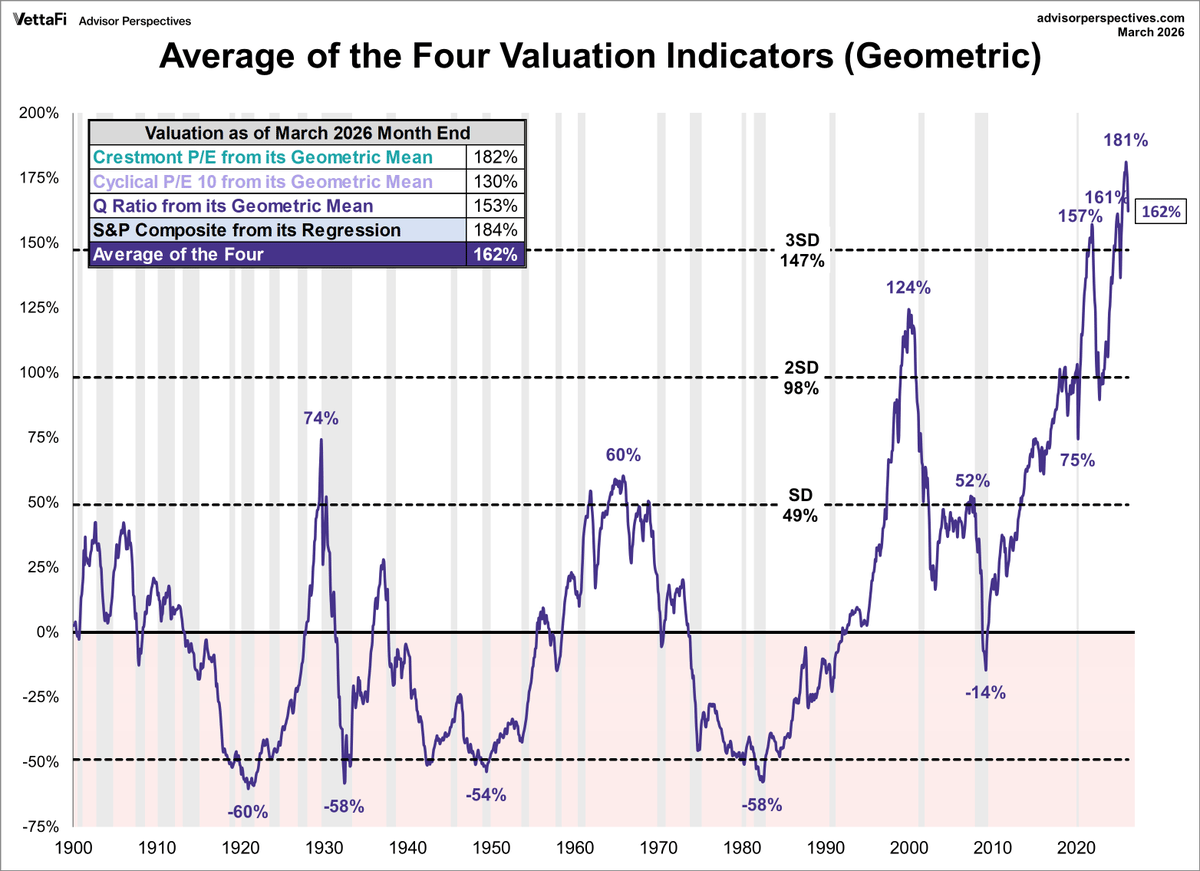
S&P Valuations Near Historic Peaks; Quality Value Outshines
Where are we in the valuation cycle? * Current reading: ~+162% * That is above 3 standard deviations * Only comparable levels: late 1990s / 2021 peak * Base case (5–10 yrs): low single-digit real returns for the index * Bear case: major drawdown (-40–60%) *...

Global Small‑Cap Value Set to Outpace the S&P
Global small cap investor Mark Cooper on: * Why Global Small Cap Value Could Outperform the S&P by 25% Per Year * The Most Overvalued Stocks Since the Dot-Com Bubble? A Data-Driven Warning * Why Value Investing Still Works: The Case for Quality...
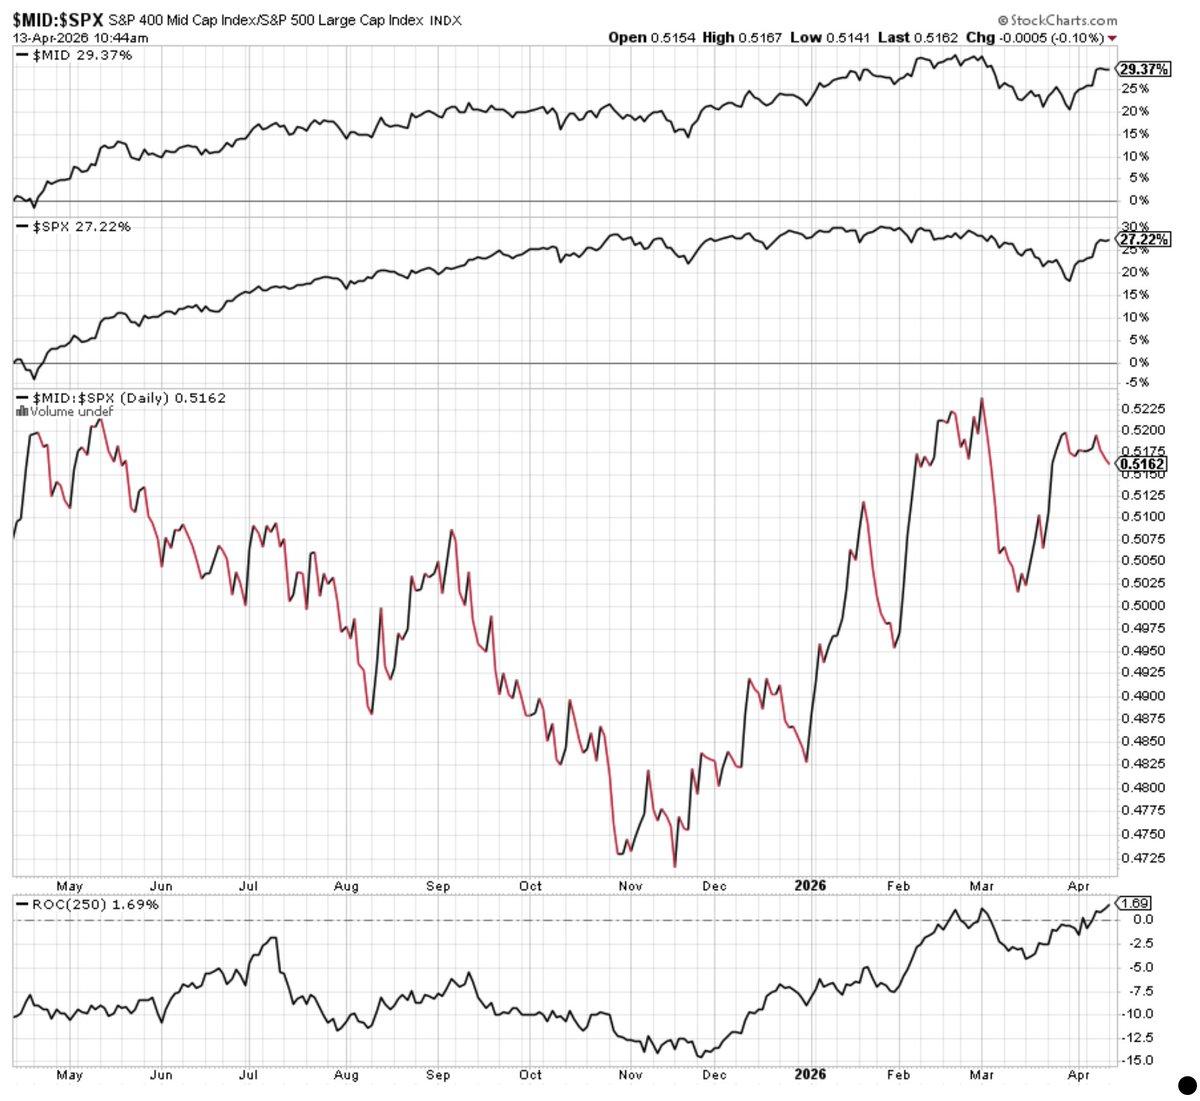
Mid‑Cap Stocks Surge, Outperform SPY Since Nov 2025
Mid caps outperformed $SPY over the last twelve months. A big recovery after the November 2025 relative low. https://t.co/258f75ybSl

Copper Cheap vs Gold; Need Eight New Escondidas by 2030
Copper is up over the last decade but trading at an almost four-decade relative low against hard money gold. Chile's Escondida mine in the Atacama desert is the world's biggest copper mine. The world needs eight new Escondidas by 2030. https://t.co/ogTy5RdE0y

WTI Oil Beats Gold Over Past Year
Wild. WTI oil now outperforming gold over the last twelve months. $oil : $gold ratio https://t.co/45PLa8stic
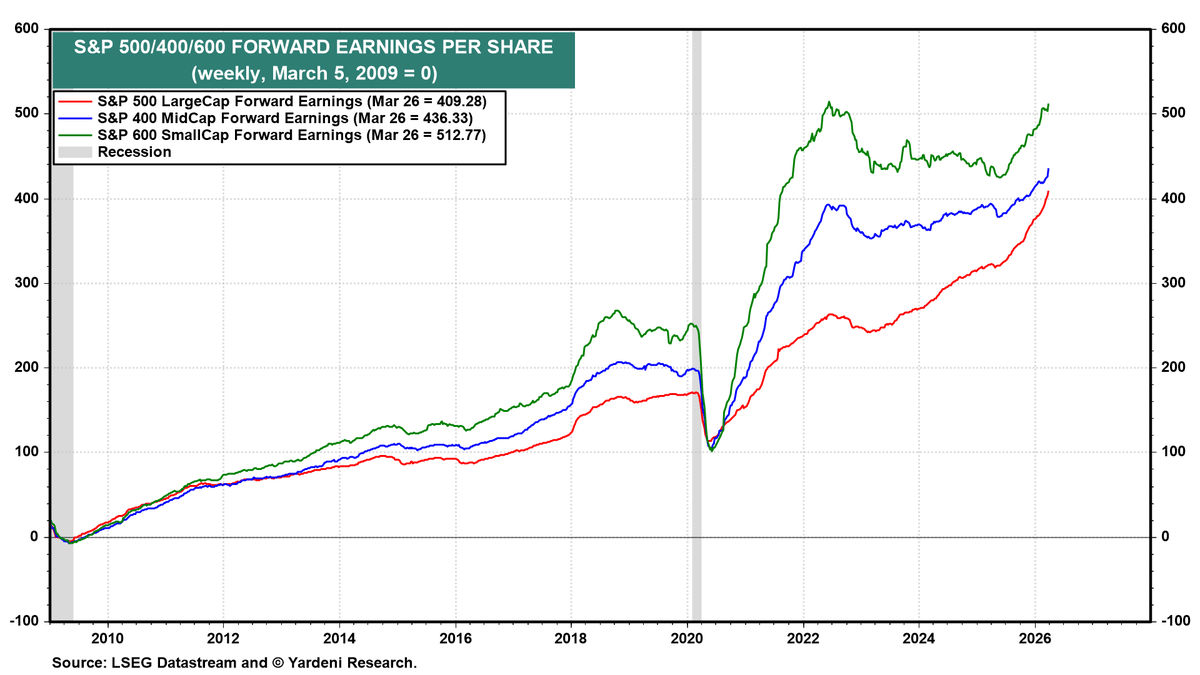
Small‑mid Caps Hit Cheapest 30‑year Forward Multiples
Earnings for small and mid value are inflecting up into the cheapest forward multiples over the last 30 years. https://t.co/CrYWv1Fnns
Value Investing Remains Strong Amid Market Turmoil
This week in value: Warren Buffett in Omaha – 03/31/26 | Audio Only (Squawk Pod) Bill Ackman says it’s one of the best times in a long time to buy quality stocks (CNBC) When Everything Feels Out Of Control, Value Investing Doesn’t (Forbes) Relevance...

Small Caps Reclaim Long‑Term Edge Over S&P
Small cap stocks outperformed the S&P 500 over the last 12 months (first chart). After bottoming against the S&P 500 mid-November 2025, small caps have staged a sharp recovery. This is in line with the long-term regime of smalls > bigs (second...

Quality Small Caps Outperform Junk Over Four Decades
Over the last ~40 years we've seen a structural outperformance of S&P 600 (profitable small caps) vs Russell 2000 (junky small caps) There are three cyclical peaks: * 1999: Dot Com bubble * 2021: Meme Stock bubble * 2025: AI bubble Speculative junk outperforms late...
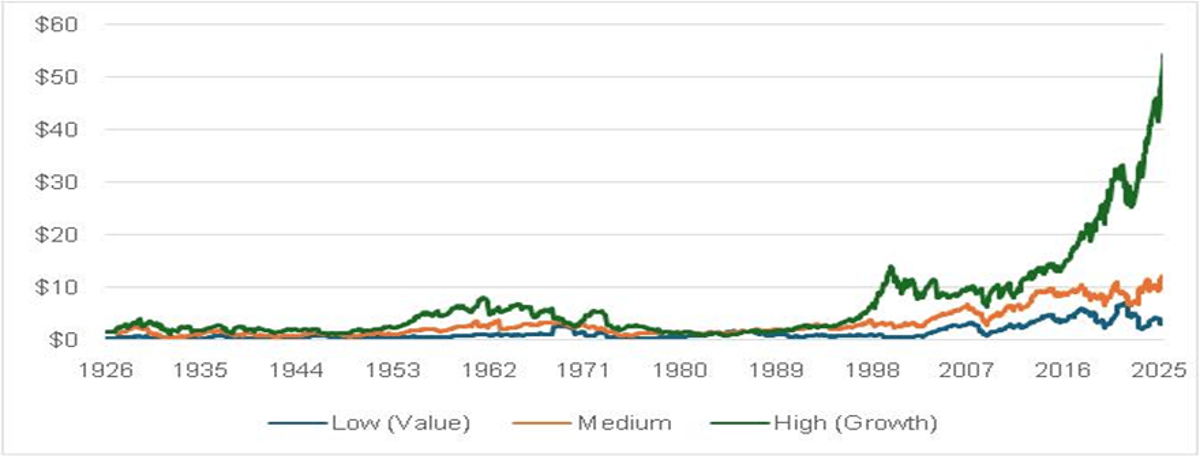
Growth Stocks' Market Caps Five Times Value's
Market Caps of Listed Companies by Price to Book, July 1926-December 2025 Since July 1926, the caps of the companies in the low price-to-book (value) portfolio have averaged $1.3 billion, those in the medium portfolio $3.0 billion and those in the...

2‑Year Yield Surpasses Fed Funds, Signals No Cuts
The 2-year Treasury yield (blue) is now > the Federal Funds Effective Rate (red) and CPI (green). If you believe the 2-Year leads the FFER, there's less likelihood of a rate cut anytime soon. https://t.co/73ZCycQNlj
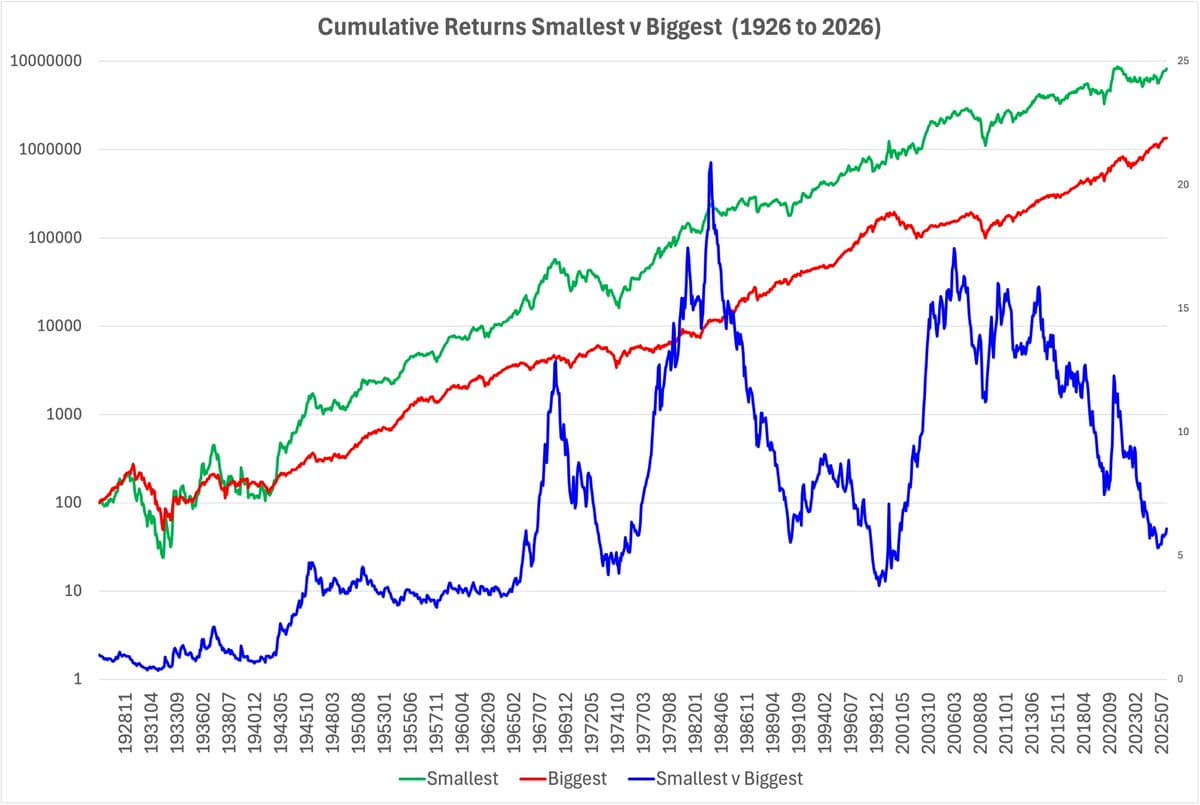
Small Caps Outperform Big, Ratio Hits Century‑High
Over the last century the smallest stocks (green, LHS) have beaten the biggest stocks (red, LHS) by six times (blue, RHS). But not in a straight line. The market has cycled. And the cycles were long. The blue line shows the...

Undervalued Gems:
Tim Travis @TimTravisValue on: * Blue Owl $OWL and $OBDC: Hidden Value in Private Credit Stocks? $MSDL * Why Asset Managers Like Blackstone, $KKR, and Blue Owl Are So Cheap * Energy Stocks Rally: $DVN, $OXY, and $EPD Breakdown * Assured Guaranty $AGO:...

Steepening 10‑3 Curve Signals Shift to Cyclical Value Rally
The 10-3 Treasury Yield Curve is as steep as it has been since July 2022 after the 10-year spiked over the weekend. Historical playbook Every cycle: * Curve inverts → tightening / late cycle * Growth slows / recession risk builds * Fed pivots →...

Top Value Investing Insights and Leaders Spotlighted
This week in value: Year-End Letter for 2025: Deep Value (GMO) PzenaPerspectives – The Value Stocks to Watch (Pzena) How Value Investing Adds Value (VIS) Co-Founder and CEO Sarah Ketterer reflects on 25 years of value investing at Causeway Capital (Causeway)

Value Stocks Shine After Tech Bubbles Burst
"Conclusion Overall, the results suggest that the most reliable approach is to hold a long position in value stocks relative to growth stocks. Attempts to systematically trying to predict periods when large growth stocks outperform small value stocks are difficult, but...

2‑Year Yield Above Fed Funds Signals No Rate Cuts
2-Year Treasury yield (blue line, market expectations of Fed policy) > Federal Funds Rate (red line, actual policy) suggests Fed is unlikely to cut. https://t.co/7odcQloUt0

Physical Economy Surge Fuels Small‑cap, Cyclical Rally
Taking the pulse of the physical economy. Growth is accelerating. Bullish for small-caps, cyclicals and value.

Value Stocks at Historic Discount, Poised for Outperformance
Valuation spreads (how cheaply value stocks trade relative to growth stocks) measured as the Price/Book ratio of value stocks divided by growth stocks in the US. "On average, US value stocks have traded at a 78% discount (i.e., 22 cents on...

Stable BDI Masks Looming Freight Spike From Ship Shortage
The long-term history of the Baltic Dry Index (BDI), the benchmark measure of global dry bulk freight rates. It tracks what it costs to ship commodities like: * Iron ore * Coal * Grain * Bauxite * Steel inputs Because these commodities sit at the very beginning...

High ROIC and Strong Interest Coverage Drive Stock Returns
ROIC, and ROA and ROE are the strongest predictors of stock performance. Each measures how efficiently a company converts capital into profits. Interest Coverage (EBIT / interest expense) captures financial strength and ability to service debt. Markets reward companies that: • generate high...

Capital Gains Outpace Labor, Concentrating Wealth and Power
Take a look at these two charts together. One is income concentration (Top 10% share of consumption v Bottom 80%), the other is equity market concentration (S&P 500 Growth vs Value weight). In the last 15 years, surplus flowed to capital,...

Mid‑Cap Value Gems Thrive Outside Tech, Guided by Gentle Activism
Our chat with "gentleman activist" Alexander Roepers on: * Alexander Roepers’ Value Investing Strategy * Why Alexander Roepers Avoids Tech, Biotech, and Financial Stocks * Why Europe and Japan Offer Hidden Value Investing Opportunities * Three Catalysts That Unlock Value in Mid-Cap Stocks * The...

Extreme Fear Signals Imminent Short‑Term Market Bounce
Fear and Greed in Extreme Fear. Historically signals we're getting close to a short-term bounce. https://t.co/tN4YpIHB0E

Karat Packaging Posts Record Q4 Sales, Boosts Profit
Solid report from small/micro Karat Packaging $KRT, a specialty distributor and manufacturer of environmentally friendly, disposable foodservice products. A way to play the growth in food delivery businesses like Grubhub, Uber Eats, DoorDash etc and take-out. Has a small ongoing buyback. Fourth Quarter...

Our Portfolios Cheapened, Outperformed as Market Overvalued
"We’ve been operating in what we see as an anomalous market environment for the past two years; specifically, the momentum-driven U.S. market has been one of the most extreme in history. [This] has also created compelling company-specific opportunities moving forward. [O]ur portfolios’...

Record Hedge Levels Signal Potential Upside Rally
This chart, which has been doing the rounds, shows one of the most hedged equity markets in years. That usually means fear is already priced in, and the risk asymmetry increasingly favors upside surprises rather than further panic selling. This chart...

Long‑term Unemployment Spikes Early, Now Cooling, No Recession Yet
Long-duration unemployment is one of the most cyclical and recession-sensitive labor indicators. Every recession produces a sharp surge in long-term unemployment: * 1954 recession: ~+550% spike * 1974–75 recession: ~+300% * 1982 recession: ~+100%+ * 2008–09 recession: ~+150% * 2020 COVID recession: ~+330% Historically, YoY long-term unemployment...

Micro‑PE Activity Spikes as Papa John’s Gets Bid
Nice to see small cap Papa John's $PZZA catch a bid. Small and micro private equity is getting much more active. Discl. Long. https://t.co/jxtCUCCgCr

Small and Mid Caps Ultra‑cheap, Primed for Multi‑year Rally
Valuation dispersion is extreme. Small and mid caps are producing strong earnings but trading at crisis-like valuation discounts. This is still one of the largest valuation gaps in decades. * Mid caps trade 21% cheaper than large caps * Small caps trade 26%...

Oil Demand to 2050 Drives Petrochemical Price Surge
Oil is deeply embedded in the economy. Whatever happens in the short term, demand contonies to grow through 2050.

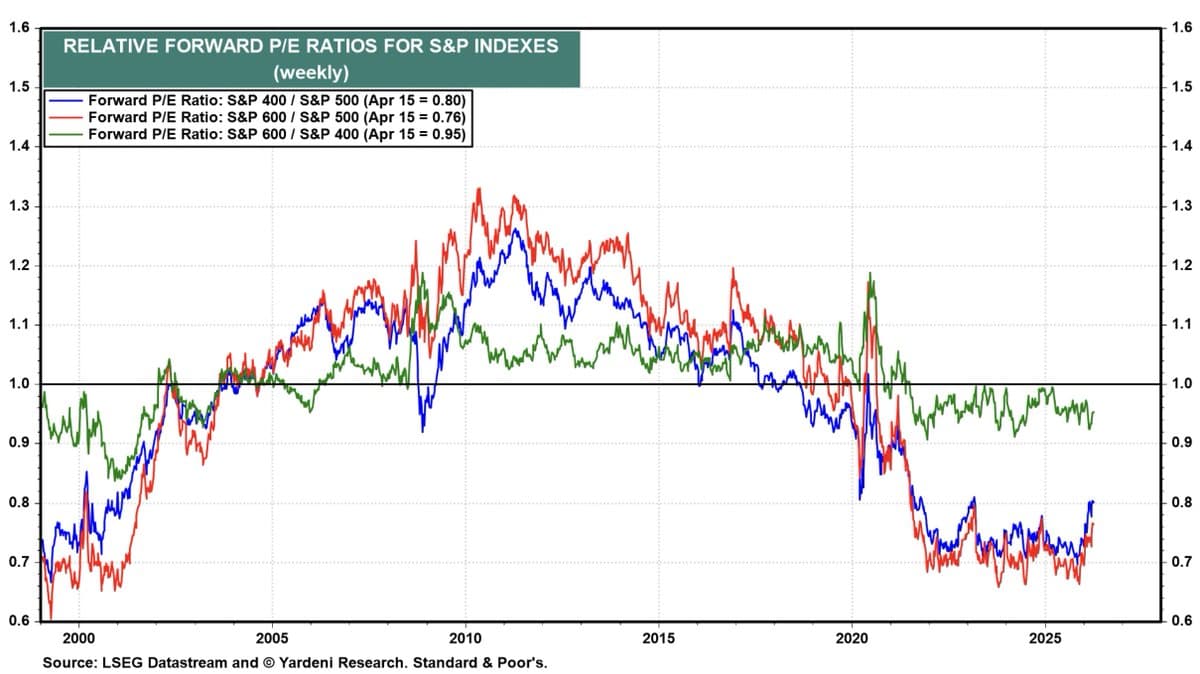
Large‑Cap Valuations at Historic Premium Over Small‑Mid Caps
The large-cap valuation premium is still near historical extremes. Large caps are trading at a ~28–36% premium to small and mid caps. That’s historically wide outside of the late-1990s tech bubble. The chart tracks forward P/E ratios for three indices: * Red: S&P 500...

Oil Flips to Technical Bear After Weekend $115 Surge
Oil closed Friday in a bull market at $91 but will close today in a technical bear market around $95 because it went to $115 over the weekend. https://t.co/kG1QReBbAy

Small‑Cap Banks Undervalued, Big Banks Overpriced, Deep Value Wins
Long/short financials investor Derek Pilecki of @gatorcapital on: * Why Small Cap Banks Are So Cheap Right Now * Why the U.S. Has Thousands of Banks * His Deep Value Strategy in Financial Stocks * Why Big Banks Are Expensive and Small Banks Are...

Value Investing Gains Momentum Amid AI Market Rout
This week in value: Berkshire Hathaway 2025 Annual Report (BH) Tom Gayner – 2025 Letter (Markel) GMO – Year End Letters 2025 (GMO) Icahn Enterprises L.P. 2025 Q4 (Icahn) Berkshire Hathaway CEO Greg Abel on resuming buyback program: I absolutely talked to Warren (CNBC) Could Value...

Dollar Rises, Treasuries Fall: Safety Flight Redefined
"The US Dollar may still have moved up after the war started, but the price of US Treasuries went down. Flight-to-safety and flight-to-quality aren’t what they used to be."