
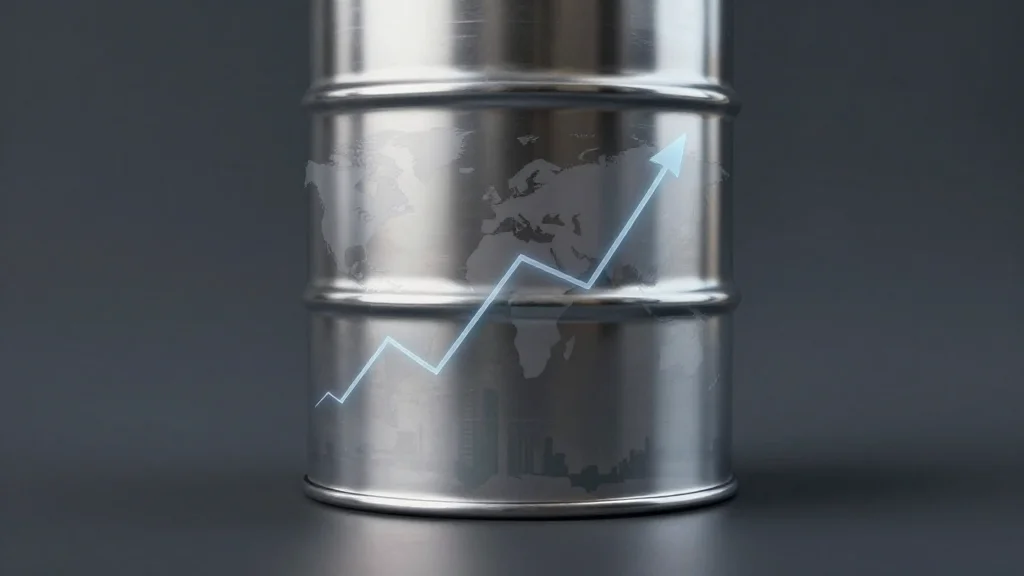
Why Are Oil Prices So Low?
Brent crude settled near $111 per barrel in early July, far below levels suggested by the near‑certain closure of the Strait of Hormuz. A simple regression linking Brent to the closure odds and the Caldara Geopolitical Risk‑Action index explains only a fraction of the price movement, under‑predicting by about $10. Despite President Trump’s forceful remarks urging a rapid reopening, market odds on Kalshi barely shifted. Overnight, July Brent nudged up $2.40 before ending the session with a modest $1.90 gain.

Why Shouldn’t Yields Rise?
U.S. 10‑year Treasury yields jumped 10 basis points on Friday, pushing the rate close to the 5% threshold that has rattled investors. The rise coincides with a continued climb in debt held by the public, now surpassing 100% of GDP...

Nowcasts of GDP Diverge
The Atlanta Fed’s GDPNow model now projects a 4% quarterly‑annualized increase for Q2 2026, while the St. Louis Fed’s nowcast sits at just 0.8%. A parallel “core GDP” measure—final sales to private domestic purchasers—shows a 3.1% q/q annualized rise, outpacing the...

Ten Year Nominal and Real Yields Jump
Ten-year nominal and real Treasury yields surged in early May, lifting the benchmark 30‑year mortgage rate by 38 basis points from its February low. The rise reflects heightened market expectations of tighter monetary policy and stronger inflation pressures. Mortgage rates...

Business Cycle Indicators as of Mid-May
The latest macro data show monthly GDP growth through March, while April’s CPI‑deflated retail sales slipped. Real retail sales excluding gasoline stations fell, reflecting the recent gasoline price surge. Employment remains robust, with NFP and civilian job metrics holding steady....

How Big of a Cost-Push Shock? WTI at $91.38 in March
WTI crude settled at $91.38 per barrel in March and climbed above $100 in April, marking a pronounced cost‑push shock for the U.S. economy. The author measures the shock by the change in oil‑to‑GDP ratio, which now exceeds the 2022...
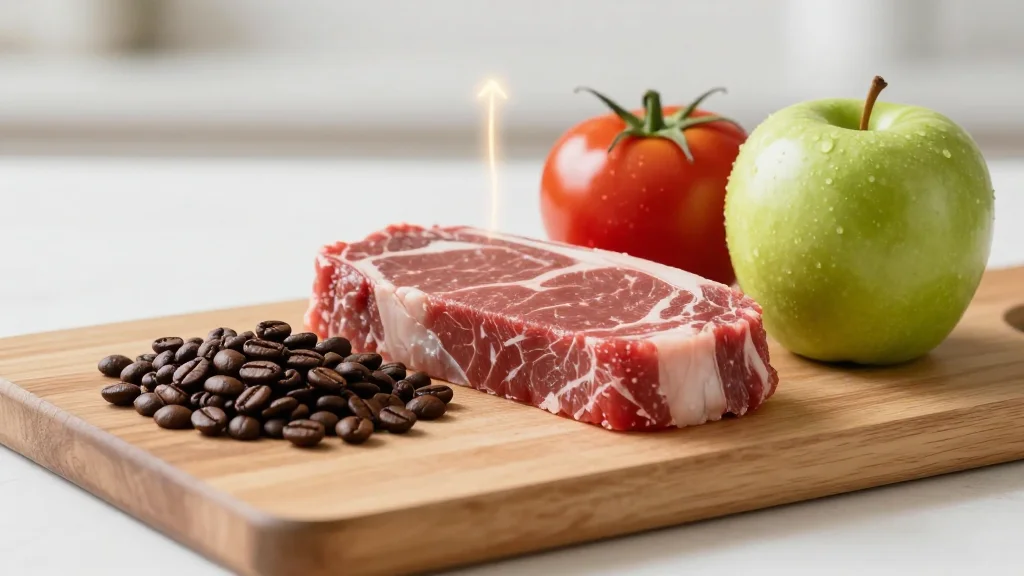
Grocery Prices (and Forecasts)
The April 2026 CPI release shows food‑at‑home prices climbing faster than expected, leaving 2025 grocery inflation 0.9 percentage points above the January 2025 ERS forecast. Visual data reveal that staple commodities such as coffee, steak, tomatoes and fruit‑vegetable baskets have followed divergent paths...

Price Levels Relative to January 2025
The AIER Everyday Price Index (EPI) is climbing faster than traditional CPI measures, with April nowcasted via a gasoline‑price regression that explains 87% of its variance. Core CPI inflation has also picked up, except for the supercore index that excludes...
Anticipating Real Hourly Wages for April
Analysts are projecting April’s real hourly wages using two price deflators: the traditional CPI and the AIER Everyday Price Index (EPI). The EPI is derived from a regression linking monthly gas price changes to the index, yielding an adjusted R²...
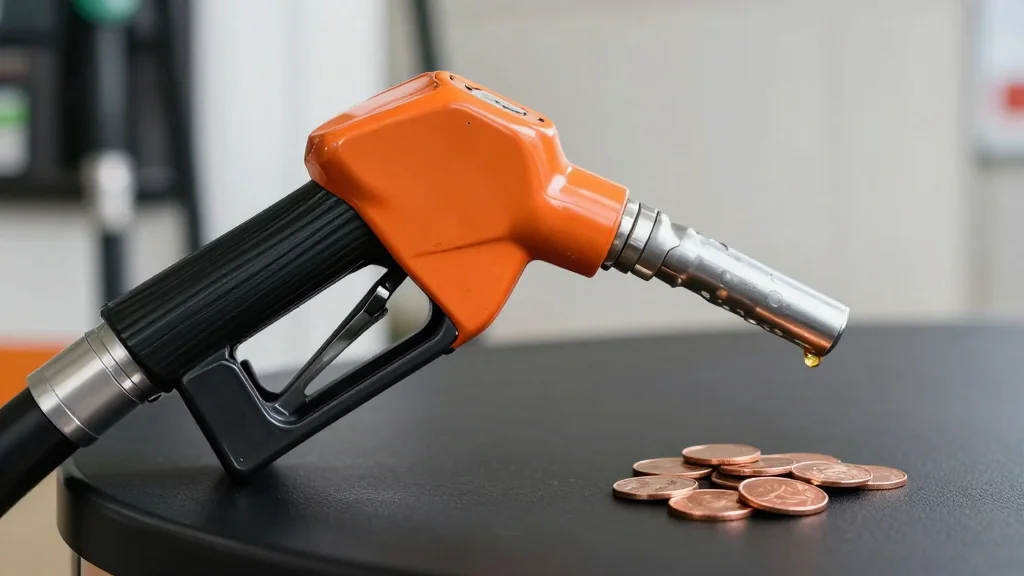
Real Gasoline Prices Are (Relatively) Low; Gas Prices Are Rising Sharply
Real gasoline prices are low in inflation‑adjusted terms, yet they have surged sharply, rising about 23% from February to April 2024. This jump exceeds the month‑on‑month growth seen after the 2022 Russian‑invasion price spike and the pre‑Great Recession surge. Retail...
![Hassett: GDP Growth “North of Four, North of Five, North of Even Six [Percent]”](https://hixhlmpcokxhartfkpyi.supabase.co/storage/v1/object/public/images/thumbnails/90da7d420c755d515e52241cf2cc7f53.webp)
Hassett: GDP Growth “North of Four, North of Five, North of Even Six [Percent]”
National Economic Council Director Kevin Hassett told "Sunday Morning Futures" that U.S. GDP could accelerate to "north of four, north of five, north of even six percent" as a capital‑spending boom gathers pace, especially if the Iran conflict de‑escalates. He...

Strait of Hormuz Reopening Odds: Down Again
Kalshi’s prediction market shows the probability of normal traffic through the Strait of Hormuz swinging dramatically over the past week. Analysts link the volatility to Iran’s strategic leverage and the lingering uncertainty surrounding U.S. diplomatic moves. Brent crude hovers around...

Guest Contribution: “Does the Yield Curve Still Predict Recessions? U.S. and OECD Evidence”
Academic Mufan Chen revisits the yield curve’s recession‑predictive power across the United States and seven OECD economies using monthly data from 1995‑2025. Probit models forecast recession risk 12 months ahead, comparing a spread‑only specification, one adding short‑term rates, and another...

Trump’s Age of Uncertainty
Kevin Hassett, former White House Council of Economic Advisers chief, publicly blamed Federal Reserve Chair Jay Powell for creating political conflicts that diverge from the Fed’s mandate. He also defended the Fed’s independence by citing an Inspector General investigation into a...

Business Cycle Indicators – Employment and Coincident Index
The latest data show non‑farm payrolls (NFP) increasing, while household‑survey‑based employment measures remain below their January peaks. Civilian employment adjusted for population growth also lags, indicating a divergence between employer‑reported and survey‑based job counts. The coincident index, which aggregates industrial...

U. Michigan Consumer Sentiment at Record Low (Since 1952)
The University of Michigan’s preliminary May 2026 Consumer Sentiment Index fell to its lowest level since 1952, slipping below the 50‑point recession threshold. The decline follows a three‑year period of volatility heightened by geopolitical events and domestic political uncertainty. Compared...

One Day in Trump’s Iran War
President Trump’s administration faced a fresh legal defeat as a federal trade court declared his latest global tariff illegal, marking the second broad‑based tariff overturned this year. The ruling comes as Trump threatens the European Union with steep new duties...

Farmer Sentiment in a Time of War, Both Trade and Kinetic
The Purdue/CME Ag Econ Barometer shows farmer sentiment staying higher than end‑2024 levels despite a year‑long trade war and two months of kinetic conflict with Iran. A regression linking the index to the Trump administration dummy, agricultural commodity prices and...
Hamilton’s Net Oil Price (WTI) Variable
Hamilton’s Net Oil Price (NOP) metric applies a three‑year rolling average of WTI crude to smooth short‑term volatility. The chart, covering 1970‑2025, highlights recession periods in gray and shows how NOP has behaved across multiple business cycles. While the pre‑2010...

How’s That Trade War Going for Wisconsin?
Wisconsin's goods exports have slipped both nominally and in real terms since the onset of the Trump‑era trade policies, according to seasonally adjusted data. Manufacturing employment in the state continues to decline, directly contradicting the administration’s promise that tariffs would...

EIA Gasoline and Diesel Fuel Update, 5 May 2026
On May 5, 2026 the U.S. Energy Information Administration released its latest gasoline and diesel price update, presenting regional price data for April 20, April 27 and May 4. Nationally, regular gasoline hovered around $3.98 per gallon, while on‑highway diesel climbed to roughly $4.45, marking...

Four Measures of Aggregate Economic Activity
The latest release of the SPGMI monthly GDP index shows a 2.1% month‑over‑month annualized increase, indicating that aggregate output continues to rise sharply. This growth aligns with the Brave‑Butters‑Kelley coincident index and the Philadelphia Fed’s coincident index, all of which...
Why Focus on Final Sales to Private Domestic Purchasers?
Preliminary U.S. GDP rose 2 % SAAR after a 0.5 % gain in Q4, while final sales to private domestic purchasers—often called “core GDP”—jumped to a 2.5 % SAAR, up from 1.8 % previously. Historically, core GDP was slightly more volatile than headline GDP,...

Consumer Vibes Two Months Into the War
Consumer confidence has deteriorated sharply two months into the war, with Gallup's poll falling to its lowest level since early 2020. The University of Michigan and Conference Board indices also dropped sharply before stabilizing, mirroring the NBER‑defined recession troughs shown...

GDP, Personal Income and Other Business Cycle Indicators as of May Day
U.S. real GDP expanded at a 2% annual rate in the Q1 2026 advance estimate, outpacing many forecasts. Real personal income, excluding government transfers, held steady, indicating limited wage‑driven demand. Meanwhile, alternative gauges such as CPI‑deflated retail sales and freight‑service...

The Last Month’s June Brent and Kalshi Hormuz Re-Opening Odds
Brent crude rose to $118.48 per barrel on April 29, 2026, up from roughly $111 in early April. Kalshi’s prediction market shows the probability that traffic through the Strait of Hormuz will normalize at 46% for July 1, the lowest level since early...

Brent Front Month Above $111
Brent crude’s front‑month contract on the NYMEX rose above $111 per barrel on April 28, 2026, marking a new near‑term price peak. Simultaneously, GasBuddy reported that U.S. average gasoline prices have hit an all‑time high, after a steep climb since...

Hormuz Re-Opening Odds and Brent June Futures
The Kalshi prediction market indicates a roughly 45% probability that the Strait of Hormuz will be reopened by July 1, while Brent June futures have risen about 2% as the perceived supply risk diminishes. The chart, dated April 27, shows the probability...

Where Will Brent Futures Open Today?
A market‑based forecast predicts Brent crude futures will open near $111 per barrel today. The estimate combines data from the Kalshi prediction market with the Economic Policy Uncertainty (EPU) index, assuming the index remains unchanged from the previous session. The...

“Margaret in Love and War”: An Opera Premiere
Composer Laura Schwendinger and librettist Ginger Strand’s new opera “Margaret in Love and War” premiered in a semi‑staged production at the Leonard Nimoy Thalia on April 28, 2026. The work dramatizes 19th‑century journalist Margaret Fuller’s 1847 Italian sojourn, her frontline...

Updated April Michigan Survey Results
The University of Michigan’s Survey of Consumers released its April update, showing one‑year‑ahead median CPI inflation expectations slipping 10 basis points to 2.9%. At the same time, the consumer‑sentiment index rose two points, its strongest reading since early 2022. The...

One Year Inflation Expectations: A Survey of the Latest
The article aggregates the latest one‑year‑ahead inflation expectations from the University of Michigan, the New York Fed, the Cleveland Fed’s Survey of Professional Forecasters and its firm‑level SoFIE, all showing a steady climb toward the mid‑3 percent range by mid‑2026. The...

Fertilizer Prices in Context
A new CSIS chart tracks fertilizer, oil and maize prices from 2000, highlighting sharp spikes during four distinct crises: the 2007‑08 food price surge, prolonged droughts, the COVID‑19 pandemic combined with the Ukraine war, and the recent "Epic Fury" weather...

Five Year Inflation Expectations, April 22
The five‑year inflation breakeven rate rose to 2.61% as of April 22, up from the 2.4% spread reported on February 27. The NY Fed’s median five‑year‑ahead inflation forecast for March sits at 3.05%, while the University of Michigan survey reads 3.2%. Treasury‑TIPS break‑even...

Today’s TACO Tuesday and the Markets
Paul Krugman argues that analysts, including the IMF, model the Hormuz crisis backwards—starting with oil price forecasts instead of physical supply constraints. He contends that real shortages, not price spikes, drive deeper economic disruption. The piece highlights that a sizable...
Gallup, U.Michigan, Conference Board Compared, Plus Morning Consult
The latest release from the University of Michigan, Gallup, and the Conference Board shows their standardized consumer‑sentiment indices moving in lockstep from 2020 through early 2025, then plunging sharply after the political event dubbed “Liberation Day” in early 2026. All...
How Badly Is the Russian Economy Doing?
Russia’s economy appears to be in deep decline, with official statistics showing negative growth and Swedish military intelligence warning that the country’s budget deficit can only be closed if Urals crude stays above $100 a barrel for a year. The...

Aizenman, Desbordes and Saadaoui: Quantifying Trade Destruction From Bombs & Bullets Vs. Taxes and Sanctions
Researchers Aizenman, Desbordes and Saadaoui present a new monthly bilateral conflict index built from calibrated GDELT event data. The decomposition isolates four layers—kinetic fighting, military posture, trade‑context hostility, and baseline diplomacy—and shows that only kinetic conflict and trade‑related hostility significantly...

Using Today’s Futures, Don’t Expect Gasoline Prices to Soon Return to Antebellum Levels*
The article uses a log‑difference regression linking Brent futures to regular gasoline prices, finding a conditional forecast that gasoline will stay above pre‑conflict levels. The model (1990‑2026) explains 56% of price movements, but the author warns that futures have underperformed...
What Drives the Administration’s Trend GDP Forecast?
The White House’s 2026 GDP outlook projects a growth path that outpaces the Wall Street Journal’s median forecast and an error‑correction model anchored in historical GDP‑population trends. The administration attributes the upside to an accelerated labor‑productivity rate of 2.9% annually,...

Prediction Markets on Hormuz Strait and June Brent Futures: 6:30PM ET
Prediction‑market platform Kalshi shows the probability of normal traffic through the Strait of Hormuz by May 15 slipping to 37 %, down from earlier optimism. The market also priced a 5.9 % jump in June Brent crude futures, reflecting heightened geopolitical tension. The...

Guest Contribution: “Is a Natural Resource Curse Crowding Out US Renewable Energy?”
Harvard economist Jeffrey Frankel argues that the United States may be experiencing a version of the natural resource curse as the recent oil‑gas resurgence appears to crowd out domestic renewable‑energy manufacturing. He cites global evidence that heavy commodity exports correlate...
MacParity, January 2026
Menzie Chinn’s January 2026 MacParity note applies the Big‑Mac Index to the United States’ top trading partners, regressing log‑relative burger prices against log‑relative per‑capita income. The analysis treats the Euro Area as a proxy for Germany and Ireland due to data gaps....

Auto Prices – Adjusting for Quality and Mix
The average transaction price of a new car jumped from $1,900 in 1960 to over $50,000 in October 2025. When adjusted for quality improvements and a shift toward larger, feature‑rich models, the price increase is about 125%, far lower than the...

1.5% M/M Ann’d: What Headline CPI Inflation Have to Be to Restore Pre-War Trend by Dec. 2026
The analysis estimates that a 1.5% month‑over‑month annualized CPI increase from May through December 2026 would bring the headline consumer price index back to its pre‑war stochastic trend. This target assumes oil prices remain elevated until the Strait of Hormuz...

“Flash Talks on Iran, Oil, and OPEC” (UW Madison, Thursday, 4:30-6)
On April 16, 2024, the University of Wisconsin‑Madison Law School hosted a flash‑talk series titled “Flash Talks on Iran, Oil, and OPEC.” Sponsored by the Global Legal Studies Center, the two‑hour session featured political science and economics scholars Steven Brooke,...

GDP Projections: One of These Is Not Like the Others
The latest chart juxtaposes U.S. real GDP growth forecasts from the Biden administration, the IMF’s World Economic Outlook, the Survey of Professional Forecasters, the Wall Street Journal poll, the Fed’s GDPNow model, and Goldman Sachs. The administration’s projection, built on...

The WEO Wartime Economic Outlook
The IMF released its World Economic Outlook for April 2026, presenting a reference scenario that assumes a brief armed conflict. Global real GDP growth is projected at 2.9% in 2026 and 3.0% in 2027, with headline inflation easing to 3.4% and...

Clifford Winston on “Where Did All the Affordable Cars Go?”
Clifford Winston’s recent NYT essay highlights the disappearance of affordable new cars in the United States. The average transaction price for a new vehicle has climbed to roughly $50,000, and as of December, finding a new car under $20,000 is...

Everyday Prices Jump
AIER’s proprietary Everyday Price Index (EPI) surged 2.5% in March 2026, reaching 307.4 – the second‑largest monthly gain since January 2020. Fourteen of the 24 component categories rose, led by motor fuel, housing fuels, utilities and food away from home,...