
Indicator of the Day (Video): NYSE New 52 Week Highs
The NYSE New 52‑Week Highs index ($NYHGH) chart for May 18 2026 shows daily closing levels and volume alongside the S&P 500. The indicator tracks how many NYSE‑listed stocks are hitting fresh 52‑week highs, a proxy for market breadth. Recent data reveal a noticeable uptick in the number of stocks reaching new highs, outpacing the S&P 500’s modest gains. This divergence suggests growing bullish momentum across a broader set of equities.
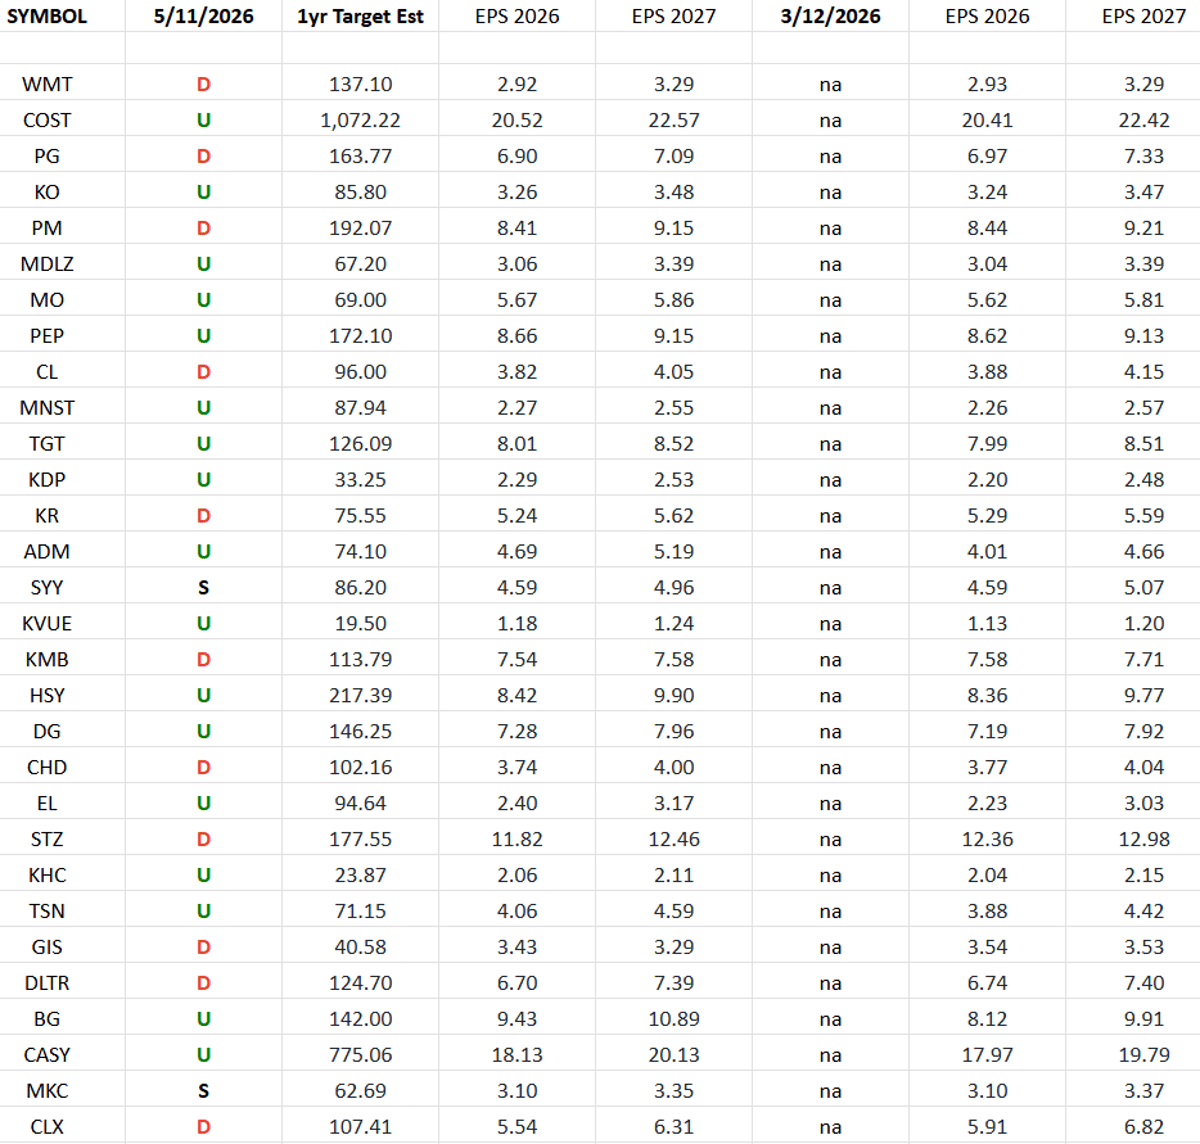
Consumer Staples (Top 30 Weights) Earnings Estimates/Revisions
The latest earnings estimate revisions for the Consumer Staples Sector ETF (XLP) focus on its 30 largest holdings. In the past 60 days, 17 stocks saw upward revisions versus 11 downward, yielding a 17:11 up‑down ratio. Cumulative 2026 earnings power...

Indicator of the Day (Video): Pring Emerging Market Diffusion Indicator
The Pring Emerging Market Diffusion Indicator (EOD) provides a visual measure of how broadly price moves are shared across emerging‑market equities. The chart displays a black line for market diffusion and a red line for trading volume, covering the period...

Indicator of the Day (Video): DOW Swenlin Trade Oscillator – Breadth
The Dow Swenlin Trade Oscillator – Breadth (STO‑B) was highlighted as today’s market indicator. The chart spanning January 2024 to May 2026 shows STO‑B swinging sharply between positive and negative values while the S&P 500 maintains a steady upward trajectory. Such divergence suggests...

Where Is Money Flowing Today?
The latest Finviz heat‑map reveals capital gravitating toward large‑cap technology and clean‑energy firms, while traditional energy and consumer staples lag behind. Green‑shaded rectangles dominate the upper‑right quadrant, indicating strong price gains in AI chipmakers, cloud software, and solar equipment. Red‑colored...

Indicator of the Day (Video): NYSE Intermediate Term Breadth Momentum Oscillator
The Indicator of the Day is the NYSE Intermediate Term Breadth Momentum Oscillator (ITBM), a tool that tracks the momentum of market breadth over an intermediate horizon. Between January 2024 and May 2026 the ITBM displayed a volatile pattern of sharp peaks...
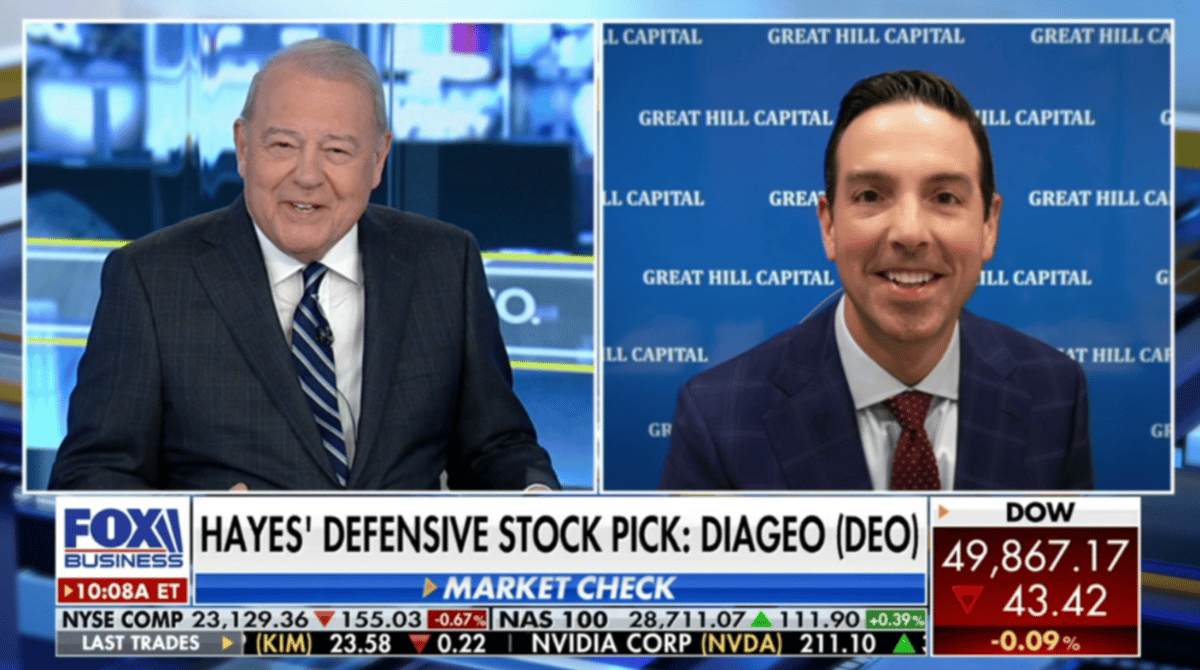
Tom Hayes – Fox Business – Varney & Co – Appearance – 5/7/26
On May 7, 2026, Tom Hayes, Chairman of Great Hill Capital, appeared on Fox Business alongside Varney & Co. During the interview he outlined the firm’s $5 billion capital deployment plan and highlighted a strategic pivot toward tech‑enabled consumer brands. Hayes...

Be in the Know. 16 Key Reads for Thursday…
A curated roundup of 16 market‑moving stories highlights Alibaba’s chip‑driven share surge, a rebound in Chinese consumer spending, and a rally in emerging‑market equities that outpaces the S&P 500. The list also flags Disney’s push toward a “super app,” strong...

Where Is Money Flowing Today?
The latest Finviz treemap shows capital flowing into AI chip makers and renewable‑energy firms, while rate‑sensitive financials and consumer discretionary lag. Double‑digit percentage gains dominate the technology sector, reflecting strong earnings and continued hype around generative AI. Energy stocks benefit...

Indicator of the Day (Video): NYSE Advance-Decline Volume ($NYUD)
The NYSE Advance‑Decline Volume (NYUD) indicator has logged pronounced daily swings from May 2024 through May 2026, reflecting heightened market breadth volatility. Despite the turbulence, the NYSE Composite Index ($NYA) has maintained a steady upward trajectory over the same period. The chart...

Hedge Fund Trade Tip (PIN) – Position Idea Notification
The Hedge Fund Trade Tip (PIN) post shares a line‑graph chart that tracks an unnamed asset from June through March, revealing a steady decline through December, a brief rally in February, and a sharp drop in March. The visual is...
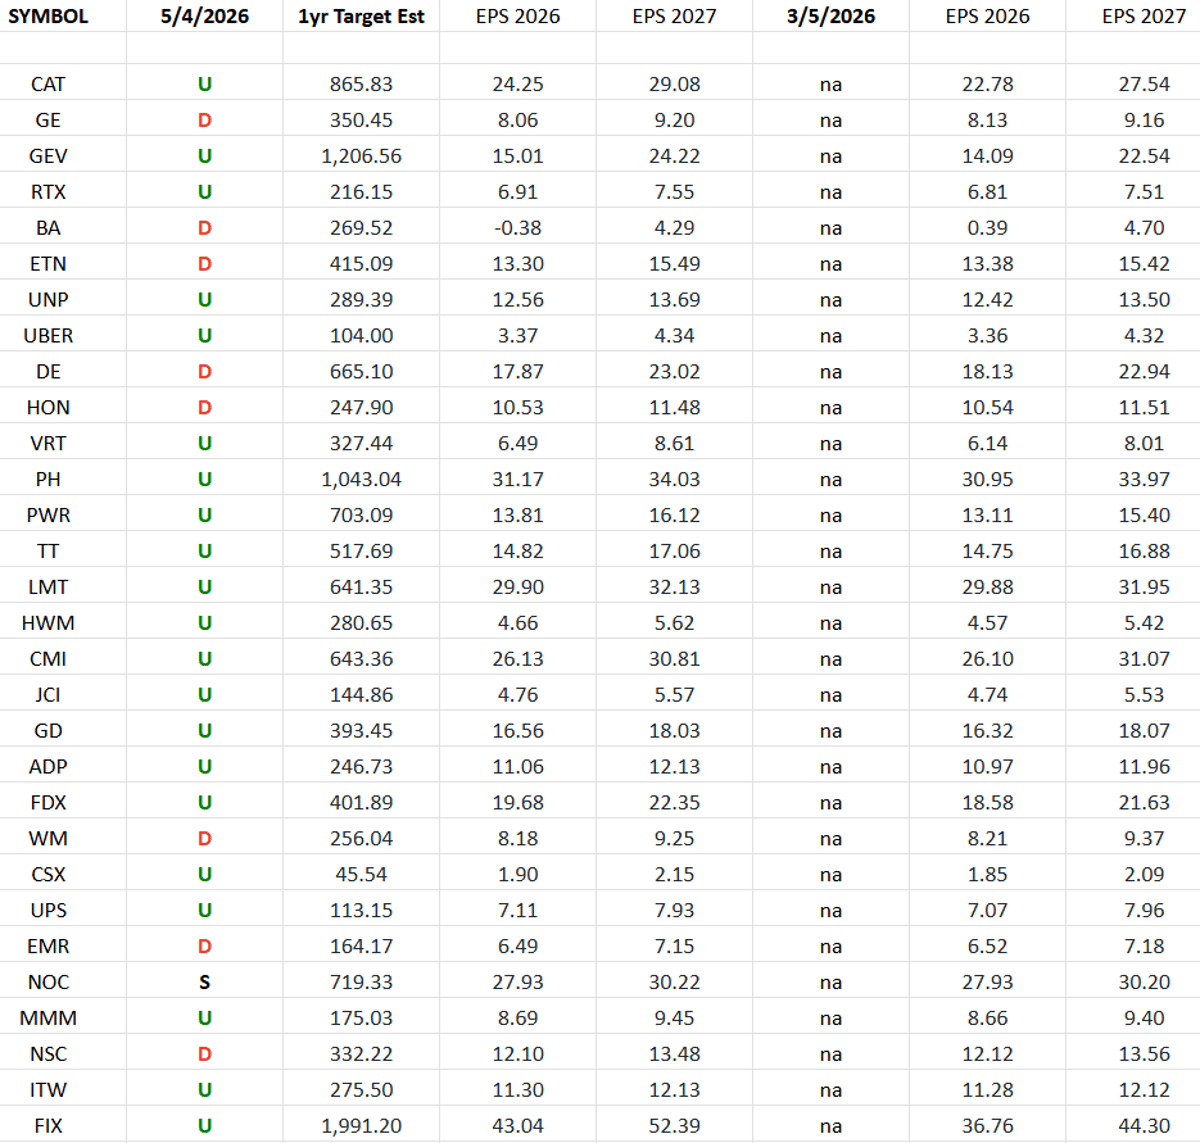
Industrials (Top 30 Weights) Earnings Estimates/Revisions
Analysts have revised earnings estimates for the Industrials Sector ETF (XLI) top 30 stocks, with 21 companies raising 2026 forecasts and only eight lowering them over the past 60 days. The net upward movement translates to a 2.64% increase in...

Exploration & Production Sector (XOP) – Earnings Estimates/Revisions
Earnings estimates for the Exploration & Production sector (XOP) have surged over the past 60 days, with all 30 tracked stocks receiving upward revisions and none downgraded. The collective 2026 earnings power jumped 76.82%, while 2027 forecasts rose 32.84%. These...

Indicator of the Day (Video): Pring Bottom Fisher Indicator
The Pring Bottom Fisher Indicator, a technical gauge of bottom‑fishing buying pressure, displayed a highly volatile pattern from May 2024 through May 2026, swinging between positive and negative readings. During the same period the S&P 500 index maintained a generally upward trajectory, creating...

Indicator of the Day (Video): NYSE High Low Oscillator
The Indicator of the Day highlights the NYSE High Low Oscillator, a momentum tool that tracks the difference between daily highs and lows on the NYSE Composite. The chart spans June 2024 to April 2026, showing the oscillator swinging between –15,000 and...