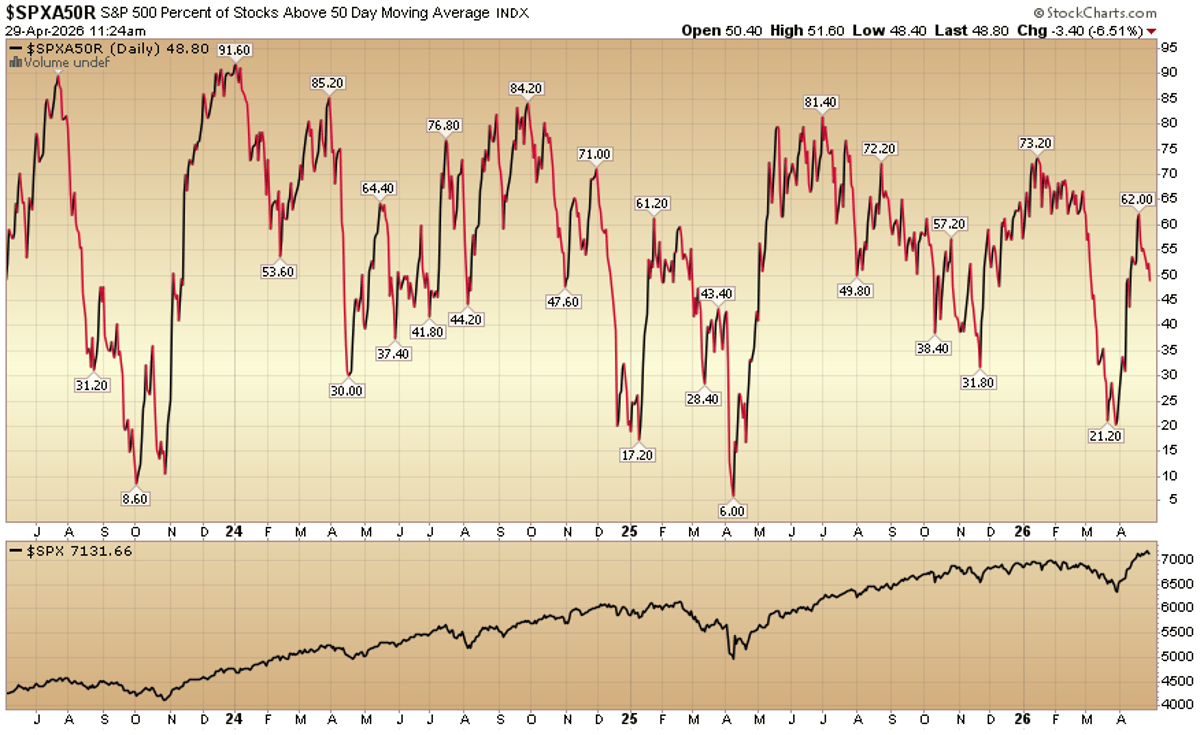
Indicator of the Day (Video): S&P 500 Percent Above 50-Day SMA
The Indicator of the Day highlights the percentage of S&P 500 stocks trading above their 50‑day simple moving average (SMA). The chart tracks this breadth metric from January 2024 through April 2026, showing a series of peaks and troughs that mirror overall market momentum. Recent readings have slipped toward the low‑60% range after a mid‑2025 rally that pushed the metric above 70%. Analysts use these movements to gauge the underlying health of the equity market beyond headline index levels.
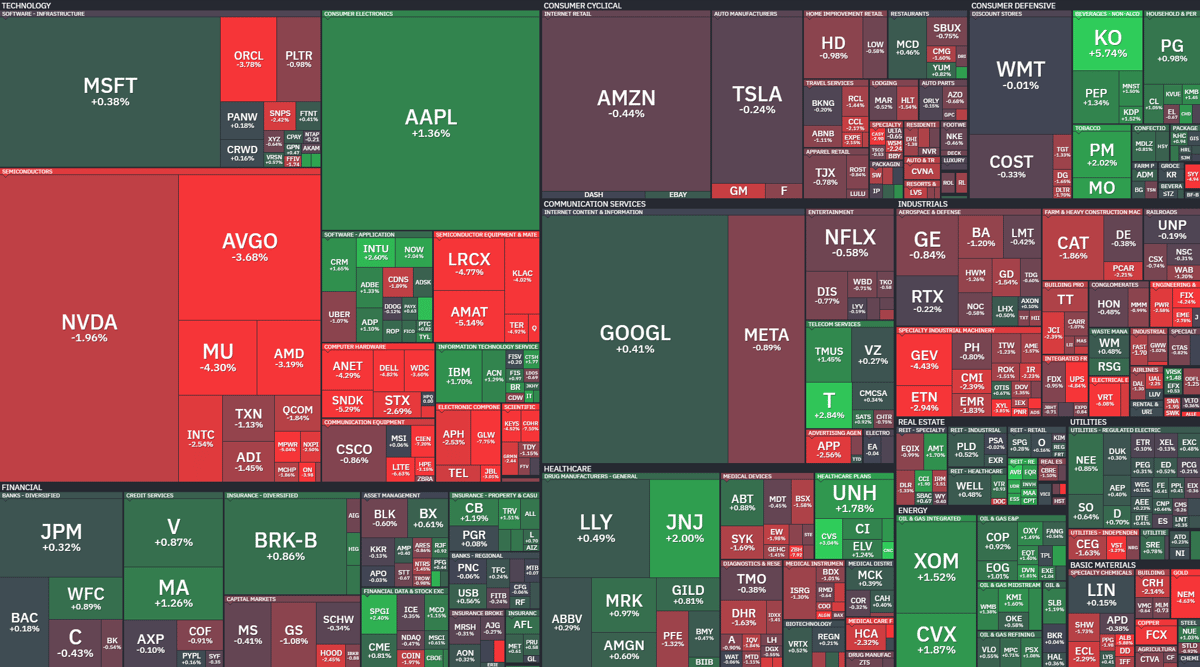
Where Is Money Flowing Today?
Today's Finviz heatmap shows capital gravitating toward AI and semiconductor firms, with Nvidia and AMD posting double‑digit gains. Renewable energy names such as NextEra Energy and Enphase Energy also attracted inflows, reflecting continued policy support. In contrast, traditional defensive utilities...
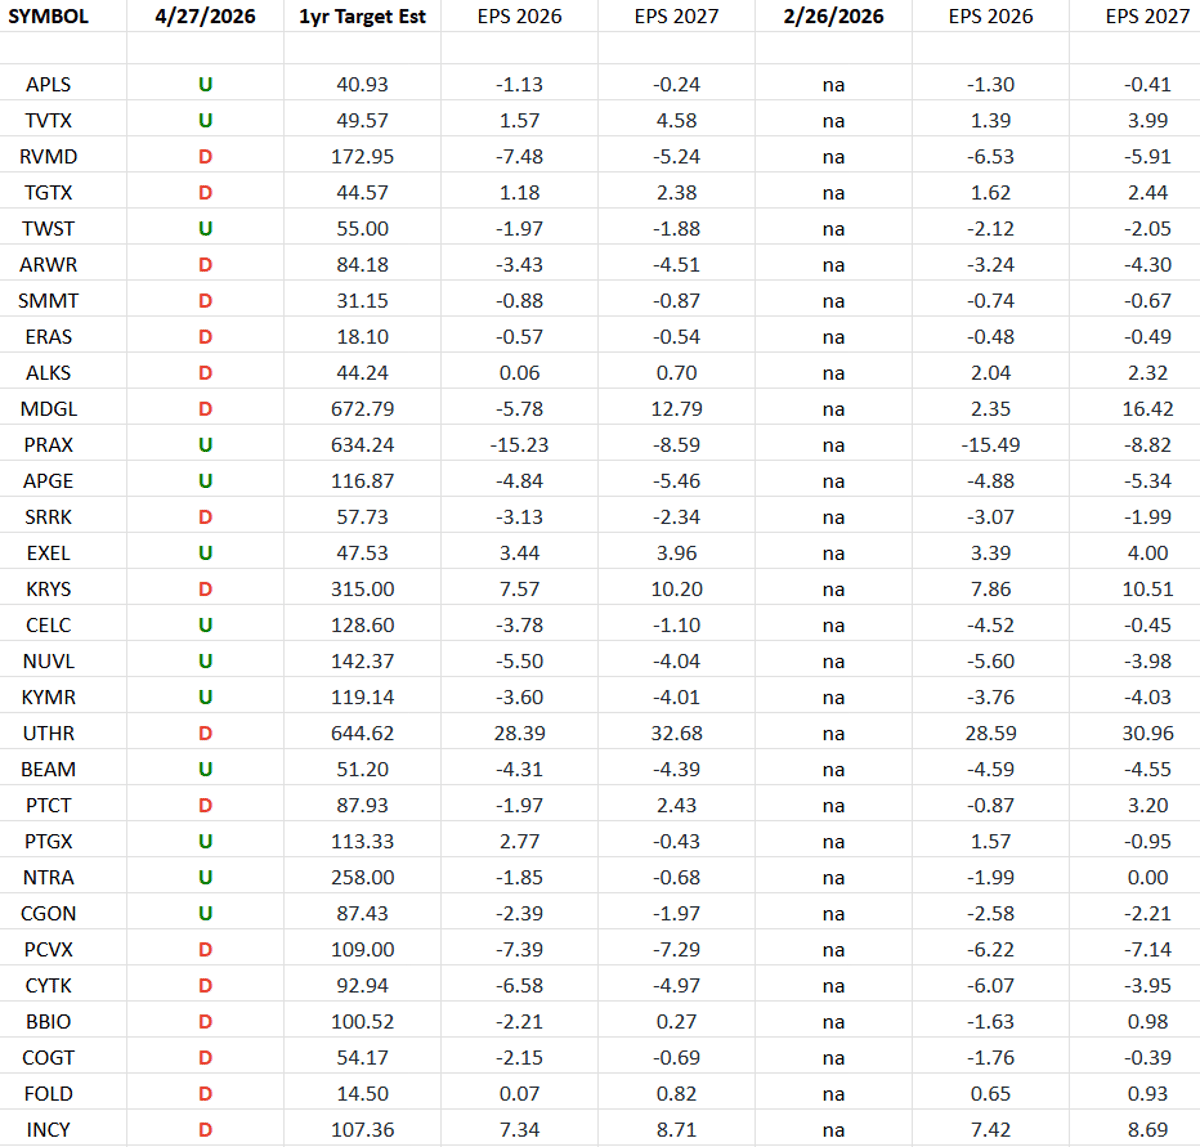
(Equal Weight) Biotech Earnings Estimates/Revisions
The Equal‑Weighted Biotech ETF (XBI)’s top 30 holdings saw a sharp pull‑back in earnings forecasts over the past 60 days. 2026 earnings power was cut by 64.30%, while 2027 estimates fell 24.36%. The revision tally shows more downside than upside,...
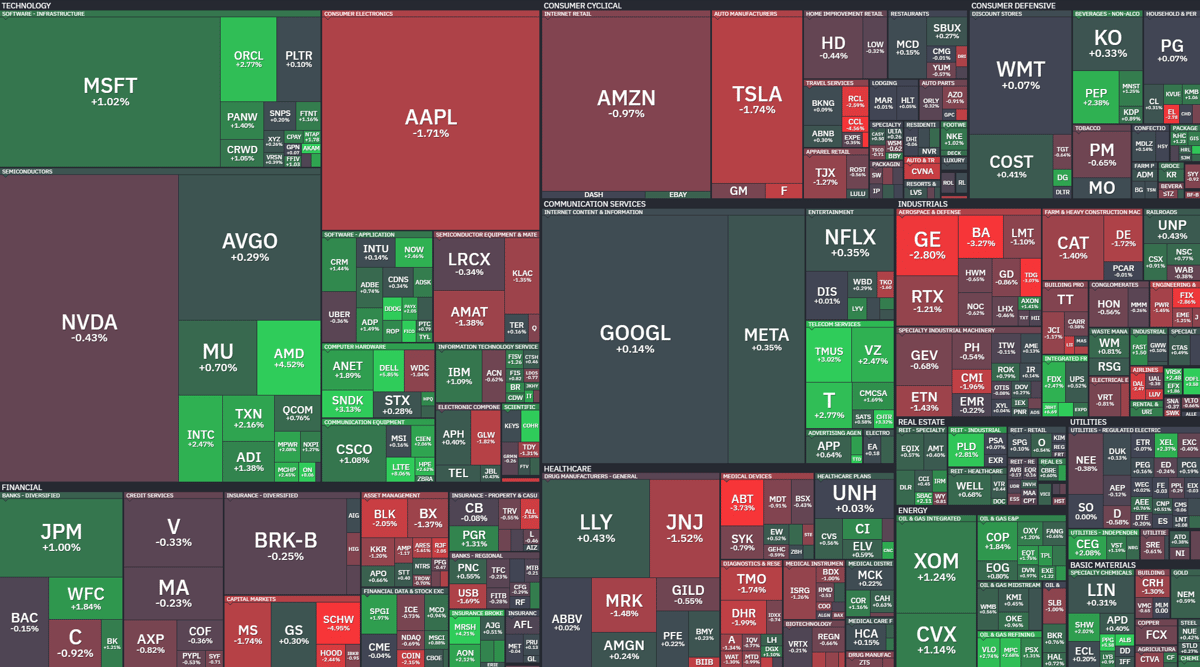
Where Is Money Flowing Today?
The article showcases a Finviz‑sourced treemap that visualizes today’s stock market capital flows, using rectangle size for market capitalization and green‑red shading for performance. Large‑cap technology names dominate the visual, while energy stocks display solid gains and defensive sectors appear...
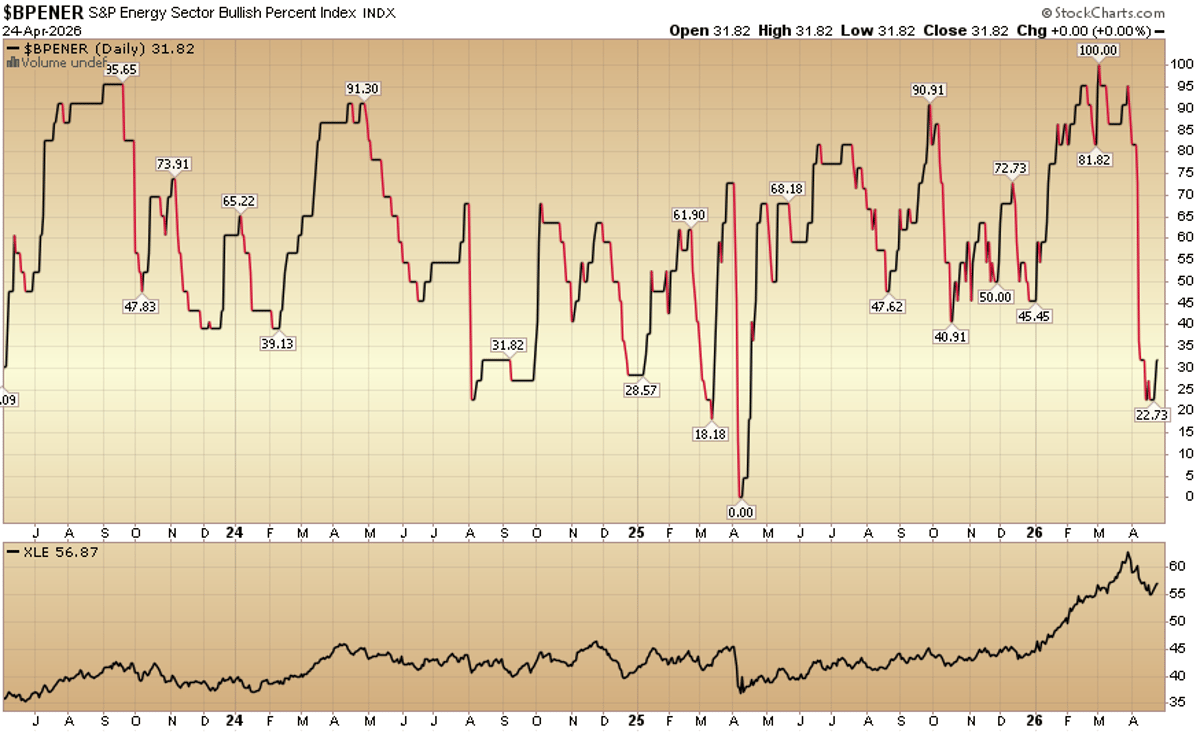
Indicator of the Day (Video): Bullish Percent Energy
Hedge Fund Tips highlighted the Bullish Percent Energy indicator, showing the S&P Energy sector’s bullish‑percent line alongside the XLE ETF performance chart. The metric measures the proportion of energy stocks trading above their 200‑day moving average, offering a breadth gauge...
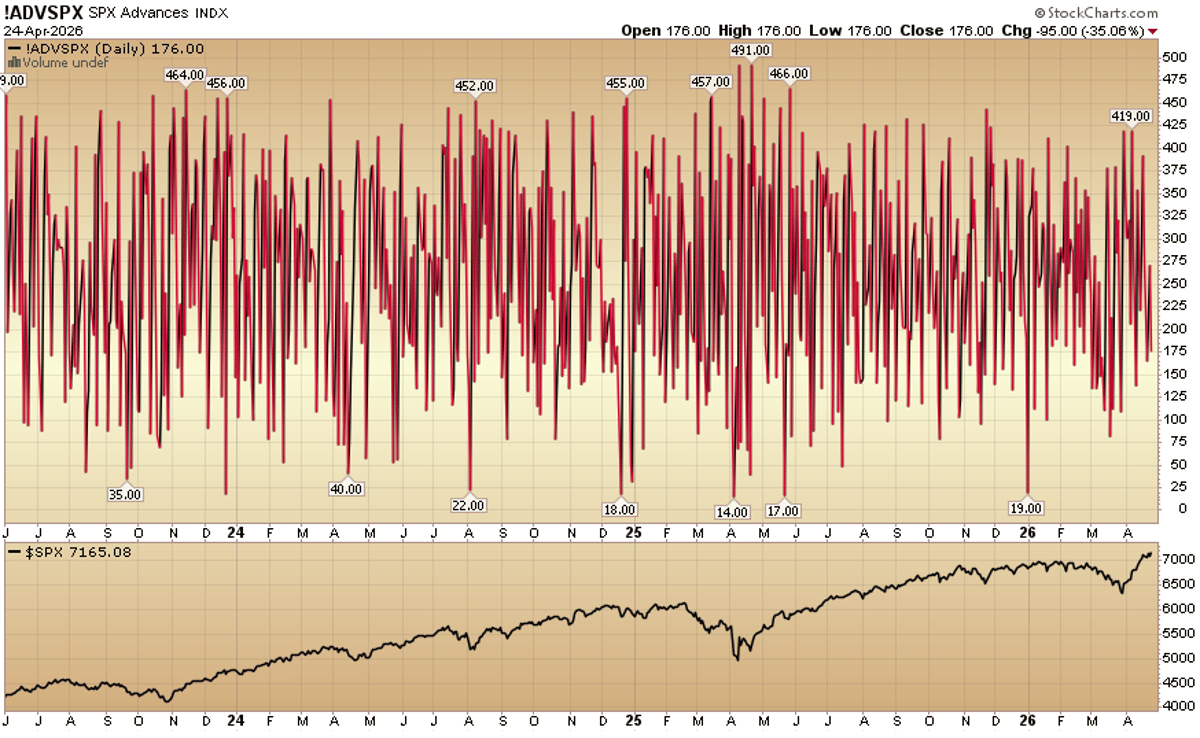
Indicator of the Day (Video): S&P 500 Advances
Hedge Fund Tips released its daily "Indicator of the Day" video focusing on S&P 500 Advances. The accompanying chart tracks the Advancing/Declining Index (ADVSPX) alongside the S&P 500 from April 2024 through April 2026, showing a clear upward trajectory in market breadth. Rising ADVSPX...
Tom Hayes – Quoted in Bloomberg Article – 4/23/2026
Intel reported a robust outlook, citing accelerating AI-driven demand that is translating into higher order volumes. Great Hill Capital Chairman Tom Hayes told Bloomberg TV that investors are increasingly directing orders to Intel, marking a shift from recent despondency to...
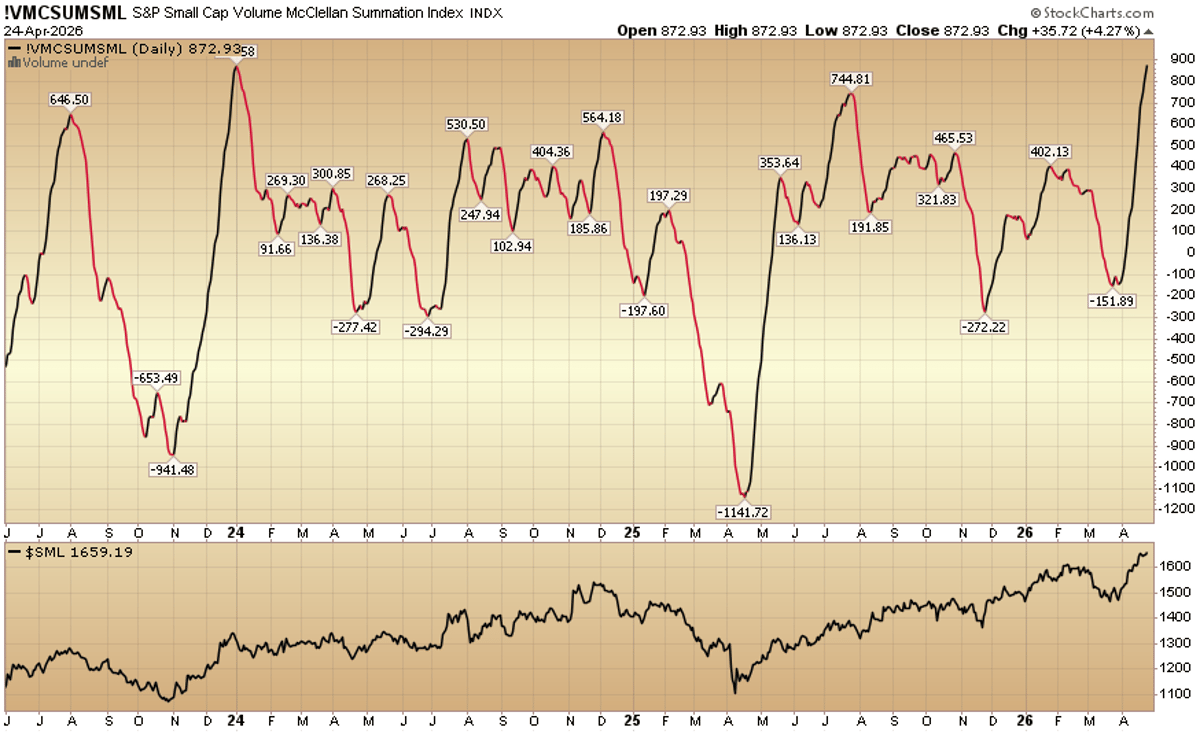
Indicator of the Day (Video): S&P Small Cap Volume Summation Index
The S&P Small Cap Volume Summation Index, also known as the McClellan Summation Index for small‑cap stocks, aggregates net advancing versus declining volume across the S&P SmallCap 600. A chart from HedgeFundTips shows the index fluctuating between modest highs and...

Hedge Fund Tips with Tom Hayes – Podcast – Episode 340
In episode 340 of "Hedge Fund Tips with Tom Hayes," the host reviews the recent "Past the Turbulence" stock‑market report, focusing on how market sentiment has shifted after the latest volatility spikes. Hayes breaks down the report’s key metrics, including...
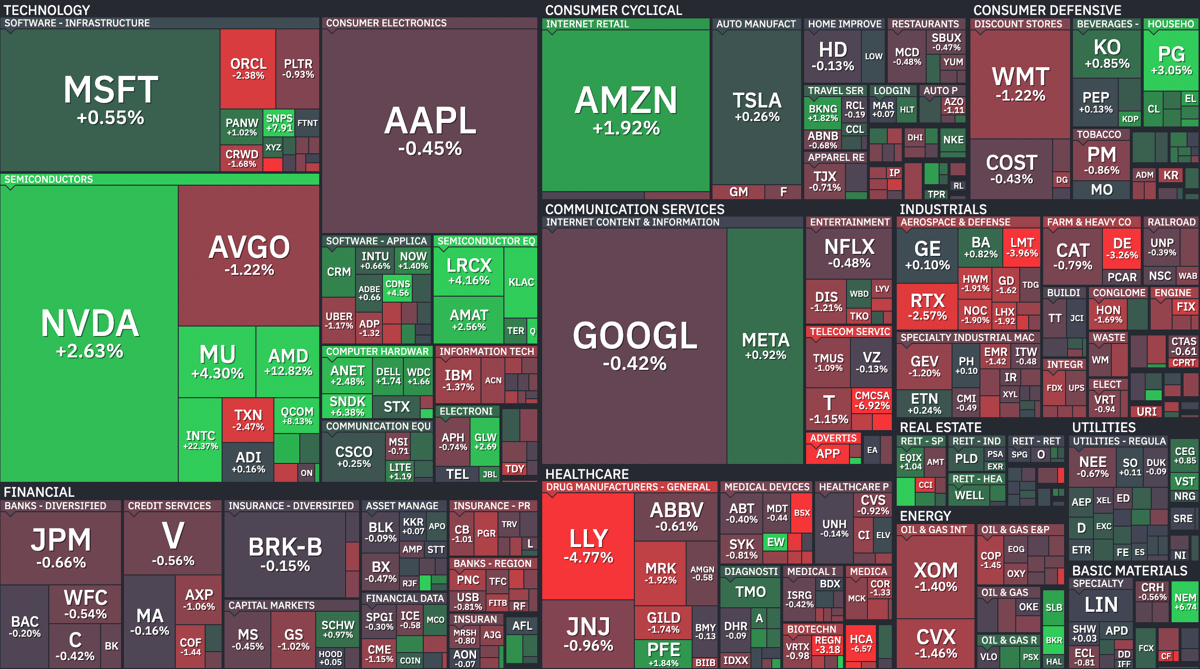
Where Is Money Flowing Today?
Finviz’s latest heat map shows capital gravitating toward mega‑cap tech stocks, with Nvidia, Apple and Microsoft posting the strongest gains. The AI‑driven semiconductor rally lifted Nvidia about 3%, while Apple and Microsoft each rose over 2% on robust earnings. In...
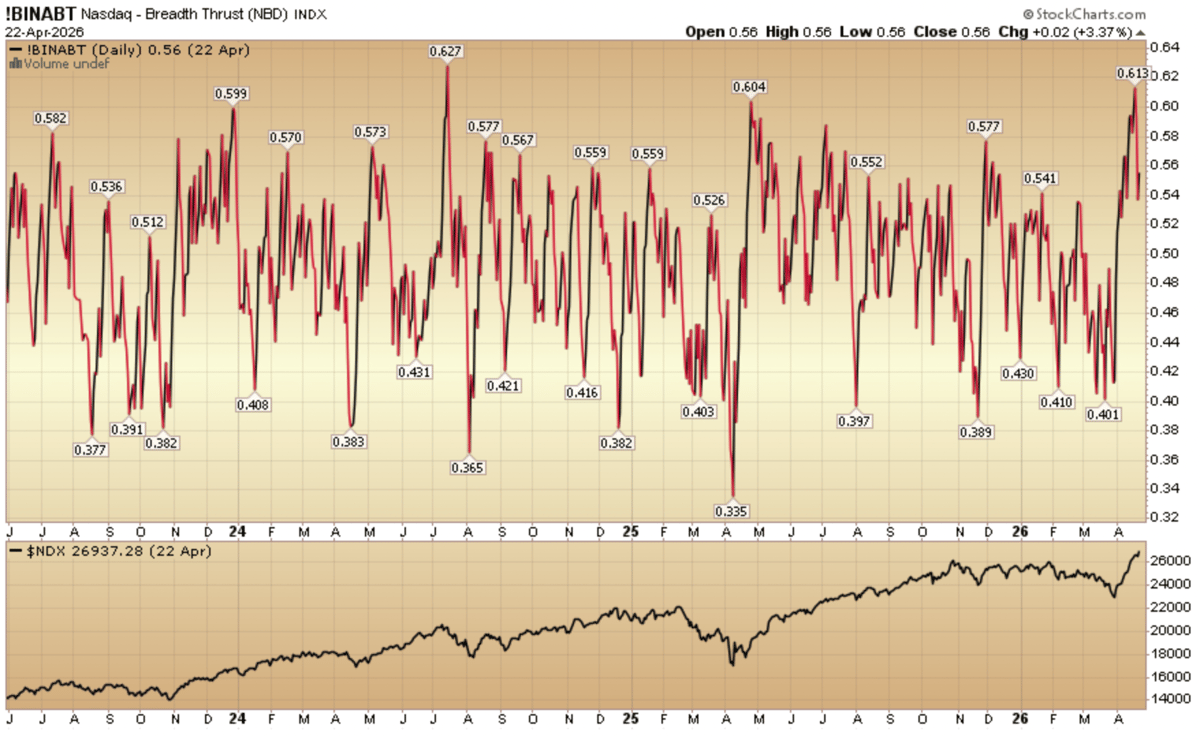
Indicator of the Day (Video): Nasdaq – Breadth Thrust
The Hedge Fund Tips brief spotlights the Nasdaq Breadth Thrust (NBD) indicator, pairing it with a dual‑chart that tracks the metric against the Nasdaq Composite from August 2023 through April 2026. Breadth Thrust gauges the ratio of advancing to declining Nasdaq stocks,...

Be in the Know. 17 Key Reads for Friday…
Intel’s latest earnings beat expectations, sending the stock up 29% as AI‑driven demand for its CPUs accelerates. Analysts, including HSBC, raised price targets to $100, citing a resurgence in server‑grade chip sales. The AI rally spilled over to broader markets,...

Tom Hayes – Bloomberg TV Appearance – 4/23/2026
Tom Hayes, chairman of private‑equity firm Great Hill Capital, appeared on Bloomberg TV on April 23, 2026 to unveil a new $2.5 billion growth fund focused on artificial‑intelligence and climate‑tech companies. He highlighted the fund’s target 12% internal rate of return...
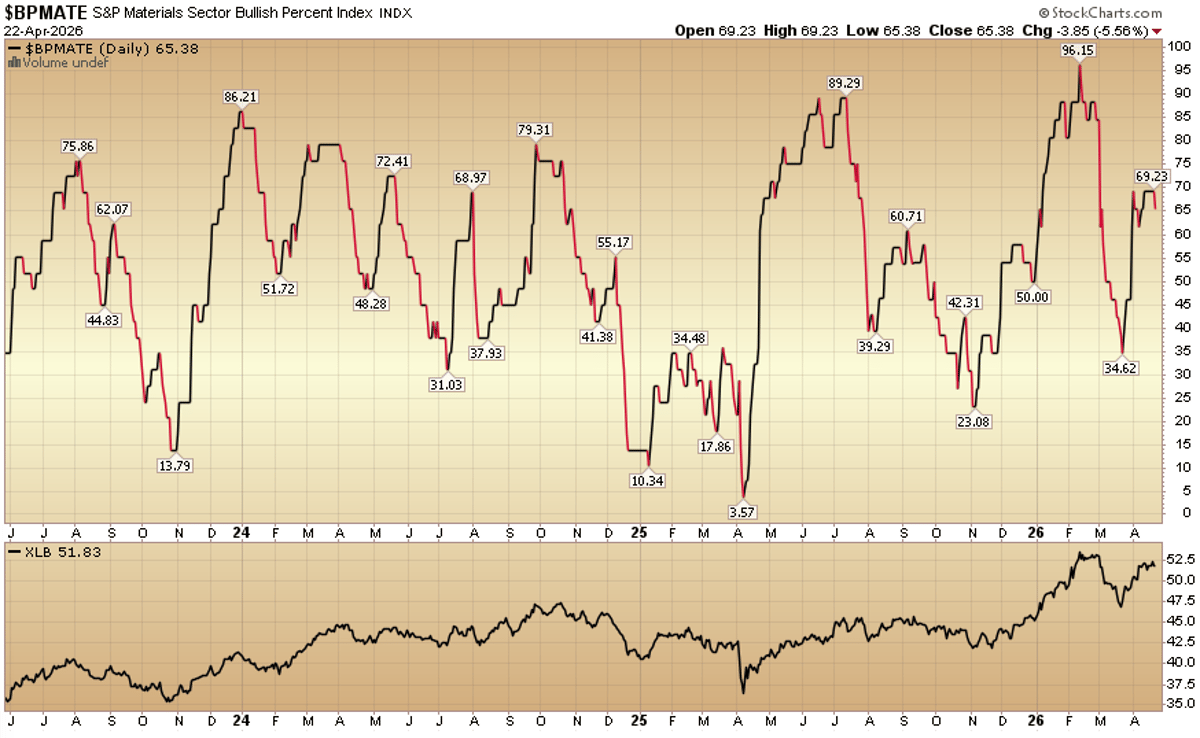
Indicator of the Day (Video): Bullish Percent Materials
The article spotlights the Materials Sector Bullish Percent Index (BPMATE), which has shown a volatile swing from January 2024 through April 2026. BPMATE measures the percentage of materials stocks trading above their 200‑day moving average, offering a breadth gauge for the sector....
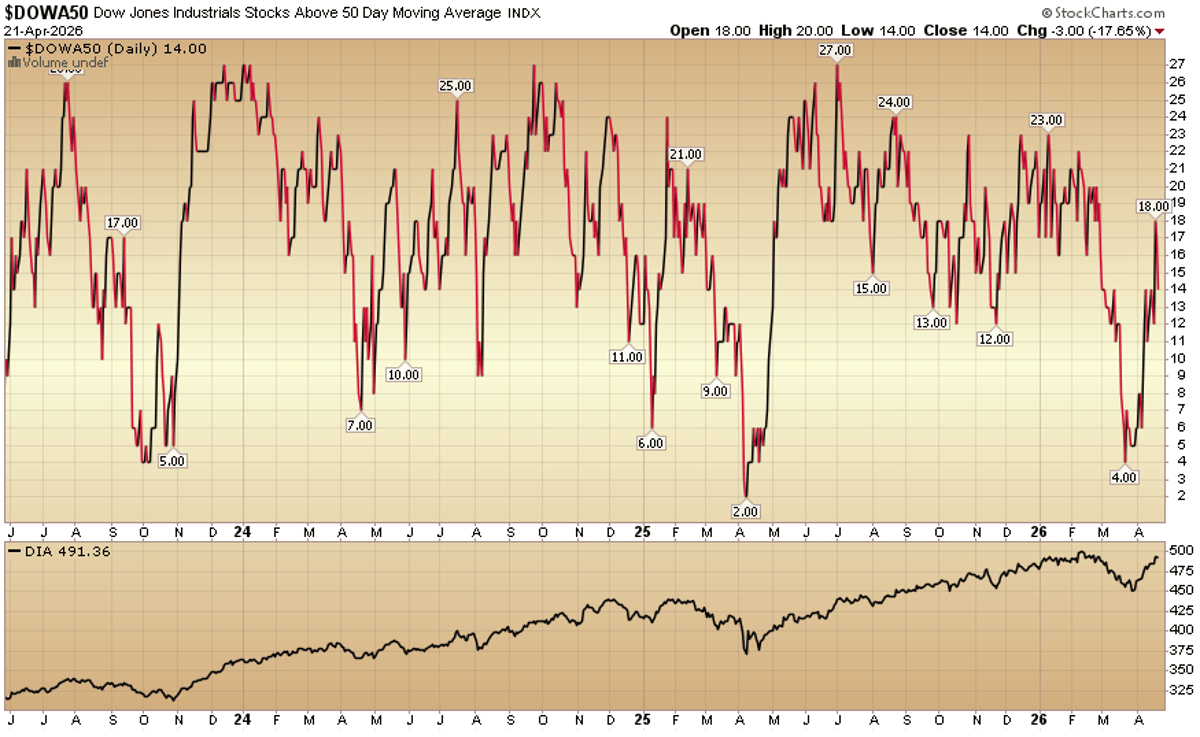
Indicator of the Day (Video): Dow Jones Industrials Stocks Above 50 Day MA
The Dow Jones Industrial Average (DJIA) has risen above its 50‑day simple moving average, a technical signal often interpreted as bullish momentum. The crossover occurred amid a broader rally in industrial stocks, with the index trading near 491 points. Analysts...
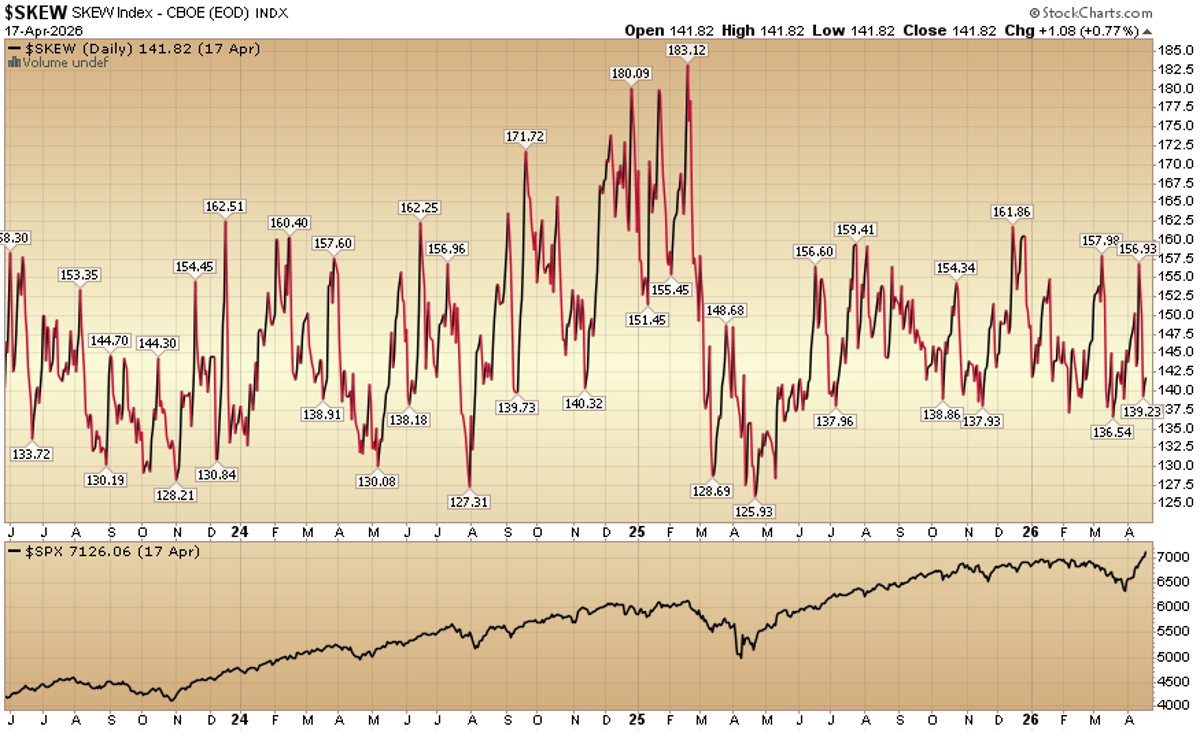
Indicator of the Day (Video): CBOE Skew Index
The CBOE Skew Index, a gauge of tail‑risk pricing in the options market, is currently swinging between 125 and 185 while the S&P 500 continues its upward trajectory. The index’s sharp fluctuations suggest that investors are demanding higher premiums for downside...
Tom Hayes – Fox Business Appearance – Charles Payne – 4/20/2026
On April 20, 2026, Thomas Hayes, chairman of Great Hill Capital, joined Charles Payne on Fox Business for a market‑outlook interview. Hayes outlined the firm’s growth strategy, emphasizing technology and consumer investments while cautioning about rising interest rates. The segment...

IBD 50 Growth Index (Top 30 Weights) Earnings Estimates
The IBD 50 Growth Index’s top 30 weighted stocks saw a wave of upward earnings revisions in the past 60 days. Twenty‑three symbols were upgraded for 2026 forecasts versus five downgraded, with the remainder unchanged, yielding a 23:5 up‑down ratio. Cumulative earnings...
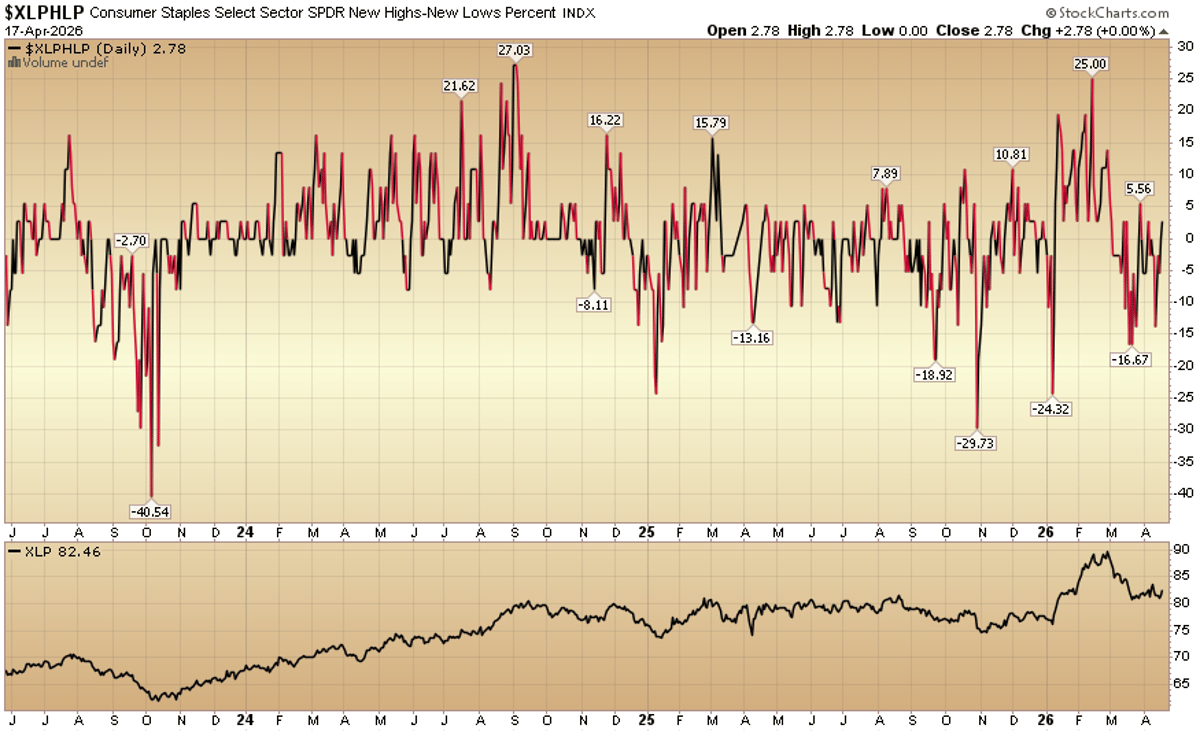
Indicator of the Day (Video): Consumer Staples New High New Low %
The daily "New Highs minus New Lows" percentage for the Consumer Staples Select Sector SPDR (XLP) has been tracked from July 2023 through May 2026. The chart shows the breadth of the sector, highlighting periods when more stocks hit fresh 52‑week highs...
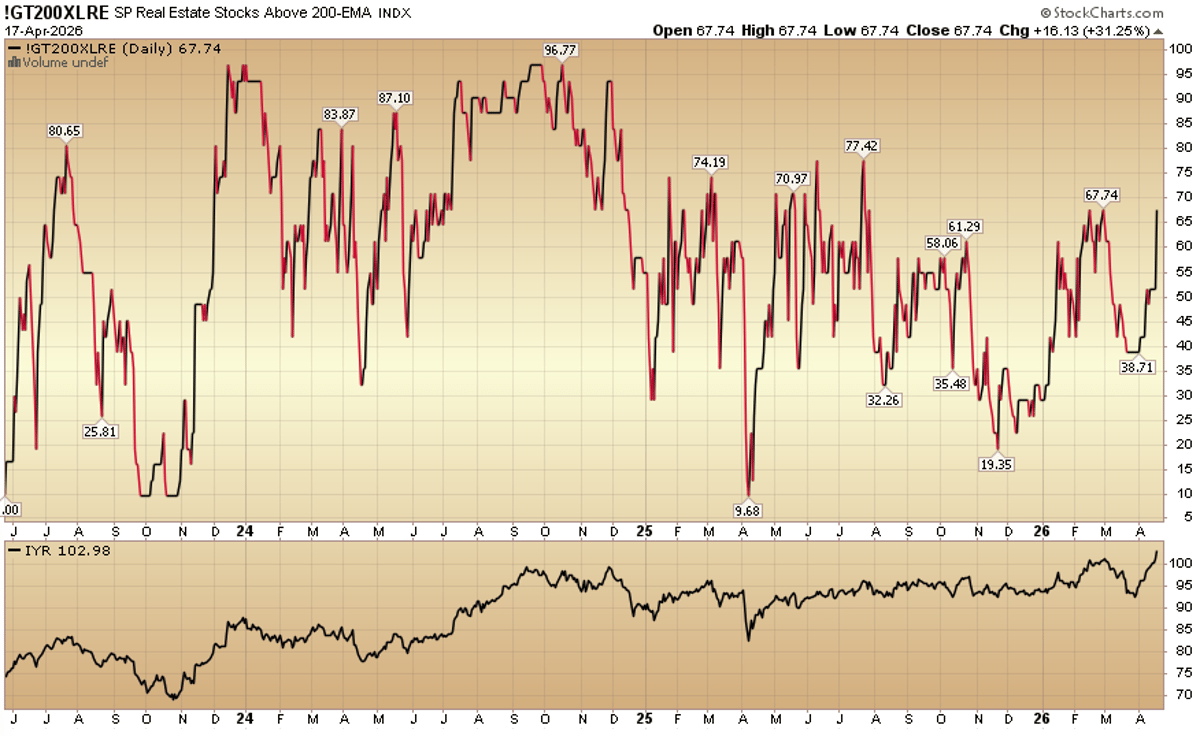
Indicator of the Day (Video): S&P Real Estate Stocks Above 200 EMA
The S&P Real Estate Index breached its 200‑day exponential moving average on April 17, 2026, signaling a technical shift toward bullish momentum. The crossing suggests that the sector may experience a sustained price rally, as the 200‑EMA is widely watched...
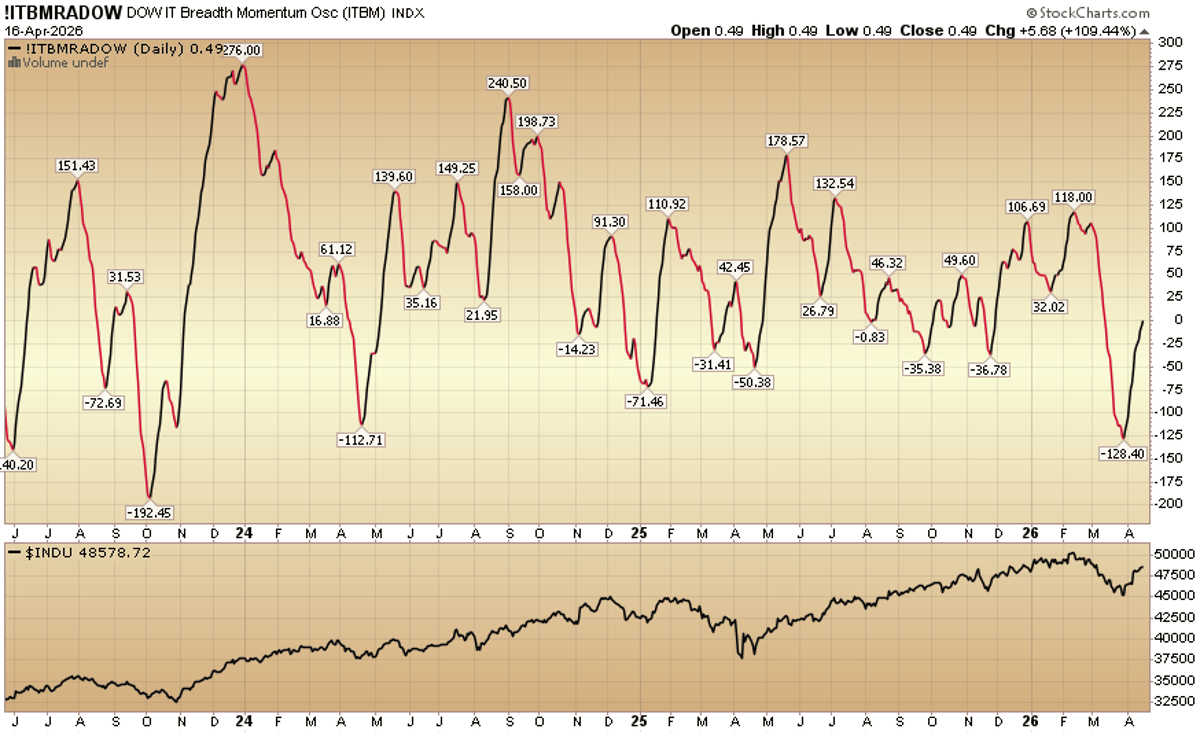
Indicator of the Day (Video): DOW Intermediate Term Breadth Momentum Oscillator
The article spotlights the DOW Intermediate Term Breadth Momentum Oscillator (ITBM) as today’s Indicator of the Day, pairing its line chart with the S&P 500 from April 2024 through April 2026. The oscillator gauges the momentum of market breadth over an intermediate horizon,...
Where Is Money Flowing Today?
Finviz’s intraday heatmap shows capital gravitating toward technology and consumer‑discretionary stocks, while energy, utilities and several small‑cap names lag behind. The visualization highlights a pronounced rally in mega‑caps such as Apple and Microsoft, contrasted with broad weakness in commodity‑linked equities....

Be in the Know. 21 Key Reads for Thursday…
China’s Q1 GDP outperformed forecasts, driven by a surge in infrastructure spending, while U.S. investors posted the largest quarterly inflow into Hong Kong and China equities in three years. In the aerospace sector, Boeing announced a hiring push of over 100...

Indicator of the Day (Video): Nasdaq Stocks Above 200 Day MA
The daily Nasdaq breadth indicator measures the percentage of Nasdaq‑listed stocks trading above their 200‑day moving average. From January 2024 through April 2026 the metric has mirrored the Nasdaq‑100 index, rising during market rallies and falling in downturns. The chart shows a...

Russell 2000 (Top Weights) Earnings Estimates
Analysts tracked earnings estimates for the 30 most heavily weighted Russell 2000 small‑cap stocks, comparing data from February 12 2026 to April 13 2026. In the past 60 days, more forecasts moved higher than lower, yielding an 18:12 up‑to‑down ratio. Despite the bullish revision...

S&P 500 Earnings Estimates
Analysts have upgraded earnings estimates for the 30 largest holdings in the S&P 500 ETF over the past 60 days. The Up:Down revision ratio stands at 22:7, indicating more upward adjustments than downward ones. Cumulative 2026 earnings forecasts for these stocks...

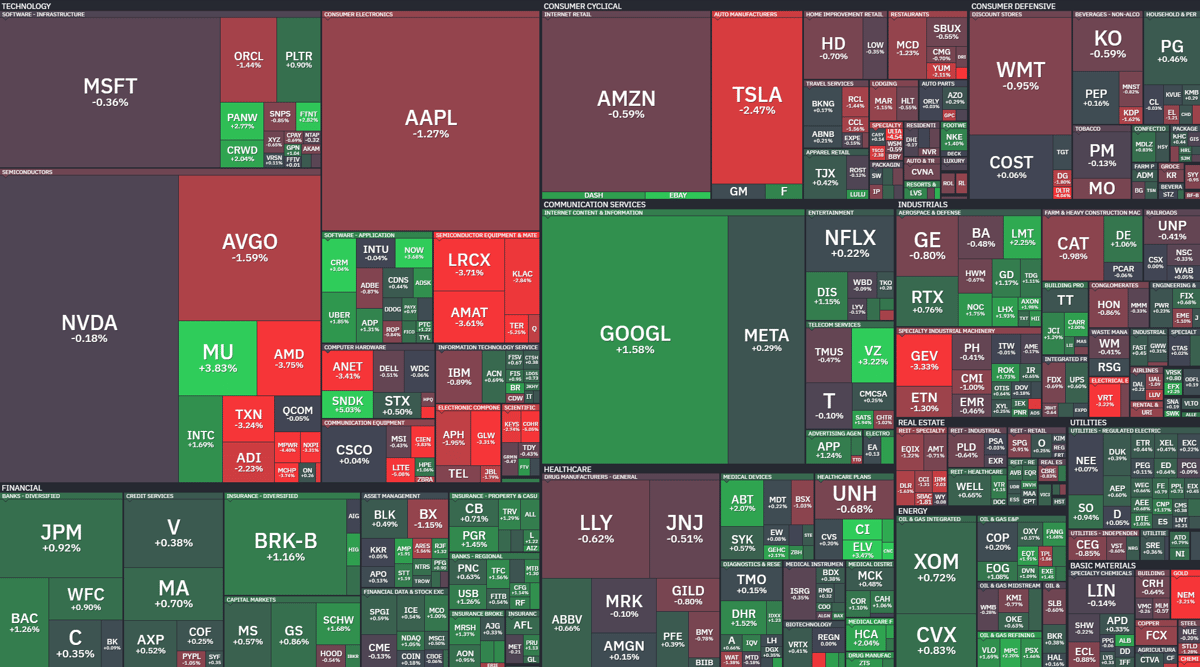
Where Is Money Flowing Today?
A Finviz treemap visualizes today’s equity capital flows, coloring gains in green and losses in red. Large‑cap tech titans—Microsoft, Apple, Amazon, Alphabet and Tesla—appear as the biggest green blocks, indicating strong price appreciation. Smaller firms across a range of sectors...

Indicator of the Day (Video): Equity Put Call Ratio 10 DMA
The daily Equity Put/Call Ratio 10‑day moving average (DMA) was highlighted as the Indicator of the Day, accompanied by a chart spanning April 2024 to April 2026 alongside the S&P 500. The DMA smooths volatile daily ratios, offering a clearer view of market...

Indicator of the Day (Video): Volatility Index – CBOE Russell 2000
The CBOE Russell 2000 Volatility Index (RVX) has been on a steady decline from April 2024 through April 2026, punctuated by occasional spikes that correspond with macro‑economic events. The chart also shows the IYM (iShares MSCI Malaysia ETF) climbing steadily over the...

Where Is Money Flowing Today?
Today’s Finviz heatmap shows capital flowing into technology and semiconductor stocks, which posted the strongest gains over the past 24 hours. Consumer discretionary also advanced, while energy and financial sectors lagged, registering modest declines. The visual snapshot highlights a risk‑on...

Where Is Money Flowing Today?
A Finviz‑sourced heat map released today visualizes where investors are allocating capital across U.S. equities. The graphic shows strong net inflows into large‑cap technology, especially AI‑focused chip makers, while energy stocks register notable outflows as oil prices dip. Financials benefit...

Indicator of the Day (Video): Bullish Percent Consumer Discretionary
Hedge Fund Tips released its daily Indicator of the Day video focusing on the Bullish Percent Index for the Consumer Discretionary sector (BPDISC). The chart shows the index well above the 70% bullish threshold, indicating that most stocks in the...

Be in the Know. 17 Key Reads for Wednesday…
Intel announced a joint venture with SpaceX and Tesla to operate a new semiconductor fab, signaling a push to bring advanced chip manufacturing back to the United States. At the same time, Alibaba unveiled a massive AI‑focused data center powered...

Indicator of the Day (Video): CBOE Index Put/Call Ratio
HedgeFundTips released a one‑minute video highlighting the CBOE Index Put/Call Ratio as today’s market indicator. The clip shows the latest ratio level against its historical range alongside S&P 500 price action. A rising ratio points to growing bearish sentiment, while...

Nasdaq (Top 30 Weights) Earning Estimates/Revisions
Analysts have updated earnings forecasts for the Nasdaq’s 30 most heavily weighted stocks, showing a clear upward trend. In the past 60 days, 19 stocks raised their 2026 earnings estimates while only seven lowered them, yielding a 19:7 up‑down ratio....
Indicator of the Day (Video): S&P Small Cap Stocks Above 200 Day Moving Average
The latest Indicator of the Day highlights that the S&P Small‑Cap Index has moved above its 200‑day moving average, a classic bullish technical signal. The crossover was captured in a concise 60‑second video, underscoring a potential shift in momentum for...

Indicator of the Day (Video): Dow Percent on PMO Crossover BUY Signals
The Indicator of the Day highlights the Dow Percent on PMO Crossover BUY signals, measuring the proportion of Dow Jones Industrial Average components that generate a bullish Price Momentum Oscillator (PMO) crossover. On April 2, 2026 the metric spiked above...

Where Is Money Flowing Today?
A Finviz heatmap shows today’s capital allocations across major equity sectors. Technology leads with the strongest inflows, while energy experiences the deepest outflows as oil prices dip. Consumer discretionary and financials are also attracting notable buying, whereas healthcare remains a...

Where Is Money Flowing Today?
The Hedge Fund Tips article visualizes the latest money‑flow data from Finviz, highlighting which equity sectors are receiving net buying versus net selling. Green‑shaded areas indicate capital inflows, while red zones show outflows across the market. The chart shows technology...

ARKK Innovation Fund Earnings Estimates/Revisions
The Ark Innovation Fund (ARKK) saw more earnings estimate upgrades than downgrades in the latest 60‑day window, with a 19:10 up‑to‑down ratio among its top‑weighted stocks. Cumulative 2026 earnings power for these holdings rose modestly by 0.77%, while 2027 forecasts...

Indicator of the Day (Video): Nasdaq Market Thrust
HedgeFundTips released a short video spotlighting the Nasdaq Market Thrust indicator, a momentum tool that blends price action with volume. The clip features a recent chart showing the indicator’s movement through March 2026, highlighting a shift toward negative thrust. The...

Be in the Know. 12 Key Reads for Monday…
Investors poured record money into a Hong Kong tech ETF despite regional volatility, while hedge funds are rapidly shedding equity positions, with trend‑following managers shorting roughly $190 billion of stocks. Dividend‑focused funds attracted strong inflows as investors chase safety, and Morgan...

Indicator of the Day (Video): Volatility Index – CBOE Crude Oil
The CBOE Crude Oil Volatility Index (OVX) closed at 92.37 on March 26, 2026, marking a 2.45% increase from the prior session. Brent crude futures traded at $107.10 per barrel, reflecting strong price momentum. The uptick in OVX suggests growing...

Indicator of the Day (Video): DOW Advances Index
The Indicator of the Day spotlights the Dow Advances Index, a breadth metric that counts how many Dow Jones Industrial Average component stocks close higher each trading session. The chart covering March 2024 to March 2026 reveals a surge in advancing stocks...
Indicator of the Day (Video): S&P Mid-Cap Intermediate-Term Volume Momentum Oscillator
The S&P Mid‑Cap Intermediate‑Term Volume Momentum Oscillator (ITVMMID) measures net buying and selling pressure across the S&P Mid‑Cap 400 over a 30‑ to 90‑day horizon. The daily chart shows the oscillator oscillating around zero, with recent peaks aligning to spikes...

Indicator of the Day (Video): Nasdaq – Declining Issues TRIX
The Nasdaq Declining Issues TRIX indicator measures momentum in the number of Nasdaq stocks closing lower than the previous session, using a triple‑exponential moving average to smooth out noise. Recent data shows the TRIX has slipped below zero, indicating bearish...

Where Is Money Flowing Today?
The latest Finviz treemap visualizes today’s money flow across the U.S. equity market, spotlighting heavyweight names such as Microsoft, Google, Meta, Netflix, JPMorgan, Visa and Berkshire Hathaway. Large‑cap technology stocks dominate the top‑right quadrant, indicating strong inflows, while financials occupy...

Tom Hayes – Fox Business – Varney & Co – Appearance – 3/19/26
Thomas Hayes, chairman of Great Hill Capital, appeared on Fox Business on March 19, 2026 to discuss the U.S. two‑year Treasury yield climbing to 3.816%, up 4.6 basis points, and Fed Chair Jerome Powell’s remark that stagflation is a “1970s...

Where Is Money Flowing Today?
The latest Finviz heatmap shows capital gravitating toward technology and consumer discretionary stocks, while energy and utilities lag behind. Sector performance is uneven, with tech leading double‑digit gains and financials posting modest upside. Overall market breadth is narrowing, indicating that...

Indicator of the Day (Video): S&P 100 Stocks Above the 200 Day MA
The latest Indicator of the Day shows that the majority of S&P 100 constituents are trading above their 200‑day moving average. This technical signal suggests a broad‑based bullish bias across large‑cap U.S. equities. The chart spans March 2024 to March...