
Where Is Money Flowing Today?
The Finviz treemap visualizes today’s stock market activity by mapping each listed company to a square whose size reflects market capitalization and whose color shows intraday price movement. Green squares indicate stocks gaining value, while red squares denote declines. The graphic instantly highlights which sectors and mega‑caps are attracting capital and which are losing momentum. By aggregating thousands of equities into a single view, the tool offers a snapshot of where money is flowing across the market today.

Indicator of the Day (Video): Health Care Advance Decline Percent
The Indicator of the Day highlights the Health Care Advance‑Decline Percent, a breadth metric tracking the proportion of advancing versus declining stocks within the health‑care sector. The accompanying chart shows the daily advance‑decline ratio alongside the XLV ETF price trend,...

Indicator of the Day (Video): Pring European Diffusion Indicator
Hedge Fund Tips released a short video spotlighting the Pring European Diffusion Indicator (PRDIFEUR) as its Indicator of the Day. The chart dated March 12, 2026 visualizes the indicator’s line movement alongside the broader IEUR index. PRDIFEUR gauges the diffusion of price...

Hedge Fund Tips with Tom Hayes – VideoCast – Episode 334
Tom Hayes hosted Episode 334 of Hedge Fund Tips VideoCast, focusing on the recent "Clean Bill of Health" market sentiment report. The discussion highlighted a swing to positive investor sentiment in early 2025, with equity valuations nearing pre‑pandemic norms. Hayes...
Hedge Fund Trade Tip (PIN) – Position Idea Notification
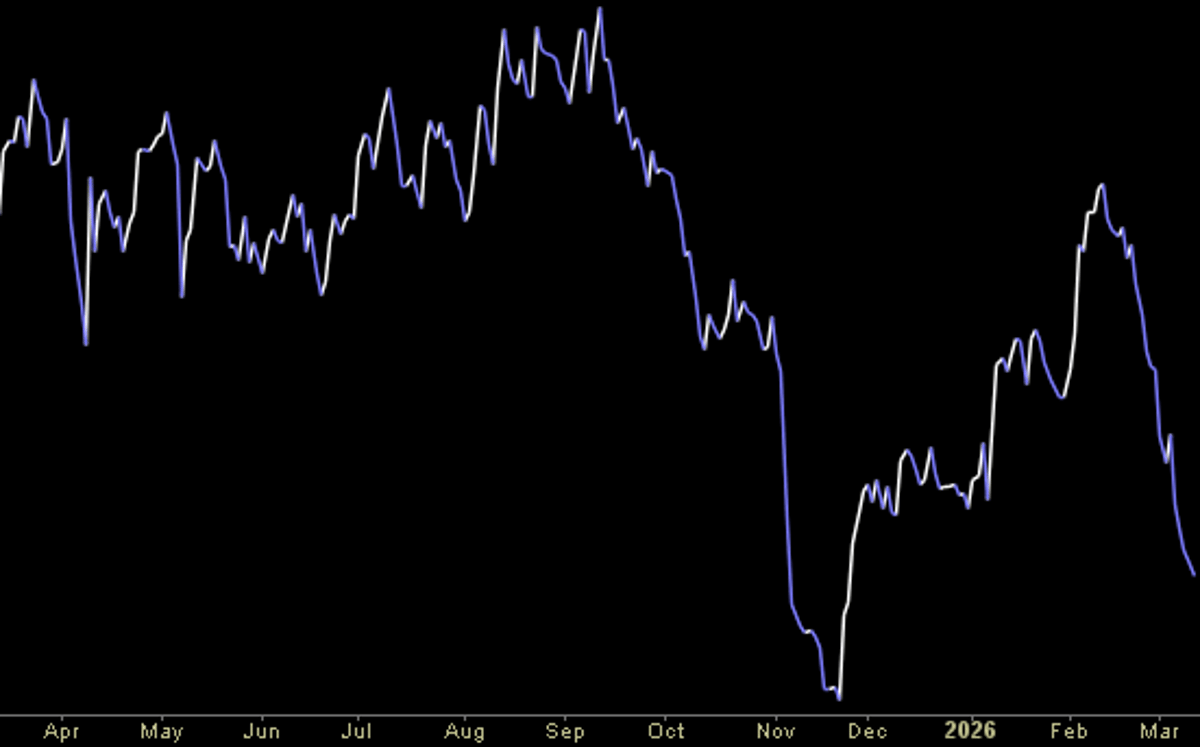
The Hedge Fund Trade Tip (PIN) post is gated behind a login, offering no public text beyond a membership prompt. An accompanying chart tracks a stock’s price from April 2025 to March 2026, showing early volatility, a sharp fall in late fall...
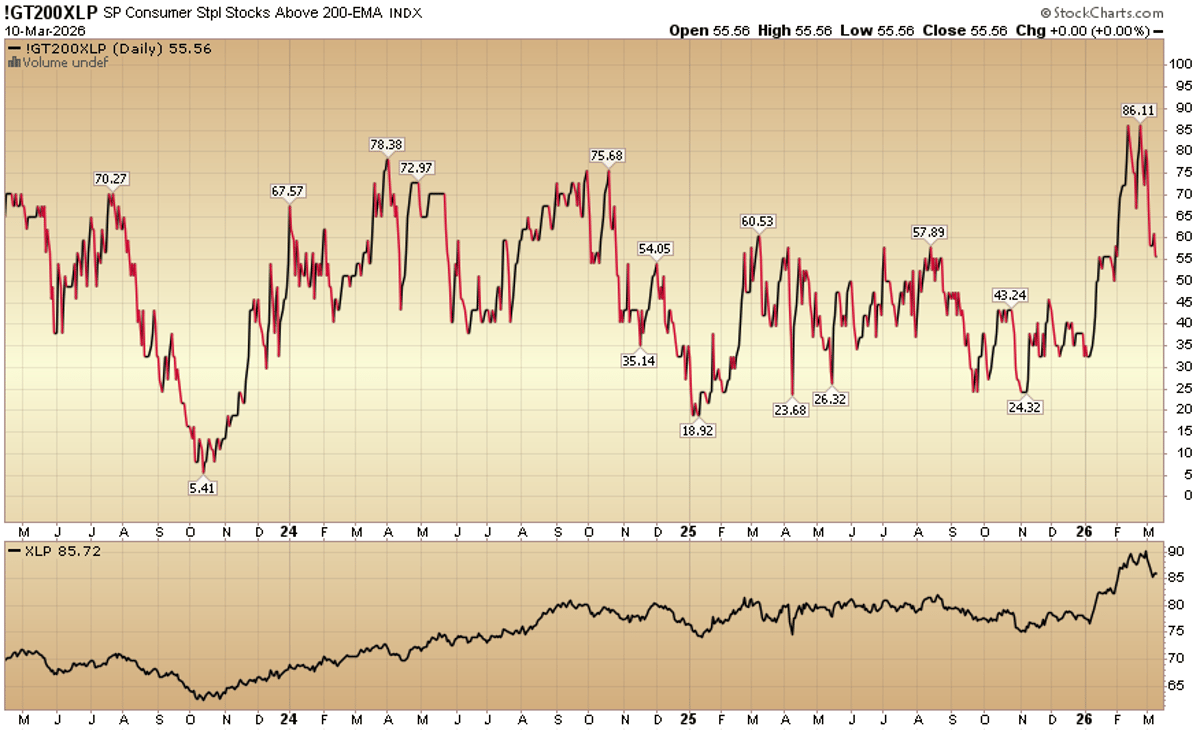
Indicator of the Day (Video): S&P Consumer Staples Stocks Above 200 EMA
The S&P Consumer Staples Index has moved above its 200‑day exponential moving average, a key technical signal often interpreted as a bullish trend. The crossover suggests that the defensive sector is gaining upward momentum after a period of volatility. Investors...

Indicator of the Day (Video): NASDAQ – Eakle Advance Decline Index
The Indicator of the Day highlights the NASDAQ Eakle Advance‑Decline Index, a breadth metric that compares the number of advancing versus declining stocks on the Nasdaq exchange. Recent chart data shows the index climbing even as the Nasdaq Composite has...

Where Is Money Flowing Today?
The latest Finviz heat‑map shows money gravitating toward energy and dividend‑heavy defensive sectors, while technology and consumer discretionary stocks lag. Energy stocks posted double‑digit gains, pulling the broader market higher. Financials have steadied after recent turbulence, and overall market breadth...

Where Is Money Flowing Today?
The latest Finviz heat‑map shows money flowing primarily into technology stocks, which dominate the green‑shaded areas, while energy and utilities remain mixed or red. Mid‑cap and small‑cap names are experiencing notable speculative inflows, contrasting with lagging performance in financials. Overall...

Hedge Fund Tips with Tom Hayes – Podcast – Episode 332
In Hedge Fund Tips episode 332, veteran trader Tom Hayes dives into the recently released "Parts and Crafts" stock‑market sentiment report. He breaks down how the niche consumer‑discretionary segment has outperformed the broader market and highlights the shift in investor...

Where Is Money Flowing Today?
A Finviz‑derived sector heat map shows today’s money flow across major equities. Technology leads with the strongest net inflows, while Consumer Cyclical registers notable outflows. Financials see moderate buying pressure and Healthcare remains largely neutral. The visual snapshot helps traders...

Where Is Money Flowing Today?
Finviz’s latest treemap visualizes today’s capital flows across four major sectors. Technology stocks dominate the green area, registering the strongest percentage gains, while consumer‑cyclical firms display a mixed green‑red pattern. Healthcare appears largely stable, with modest green pockets, and financials...

Tom Hayes – USC Marshall School of Business Talk – 2/11/26
Tom Hayes, chairman of Great Hill Capital, delivered a keynote at USC Marshall School of Business on February 11, 2026. He outlined the firm’s recent $5 billion assets‑under‑management expansion and its disciplined risk‑management framework. Hayes highlighted macro opportunities in emerging markets...

Hedge Fund Tips with Tom Hayes – Podcast – Episode 331
In Episode 331 of Hedge Fund Tips, host Tom Hayes examines how trading volume can trigger sharp market moves, referencing the recent "Volume Opens the Floodgates" research. The discussion highlights that spikes in volume often precede sentiment shifts, creating entry...

Where Is Money Flowing Today?
A Finviz‑sourced heatmap reveals today’s capital allocations across U.S. equities, highlighting strong inflows into technology and renewable‑energy stocks while energy and financials lag. The visual shows green‑colored leaders posting double‑digit gains, contrasted with red zones where sectors such as utilities...