QQQ's Rare 4‑Week Rally Signals Bullish Momentum
we've just had one of the three strongest 4-week rallies on the $QQQ in recent years... as a note: strong momentum after a decline tends to be buying/bullish evidence not a reason (in and of itself) to be bearish... https://t.co/AskI0lqCq1

All‑time Highs Meet Bearish Sentiment: Classic Lockout Rally
Stocks are pushing to all-time highs while sentiment is getting more bearish—bulls down, bears up. That’s a sign of disbelief. Investors are fighting the rally, which is a classic Lockout Rally condition. https://t.co/7NiHKuPACd https://t.co/LJ8u8etwnj
Parabolic AMD Rally Likely to Reverse, QQQ Already Pulling Back
market has gone from strong to parabolic on $AMD earnings and rumored end to hostilities in Middle East. we have seen a few days like this in the past year go from green to red. $QQQ has already...
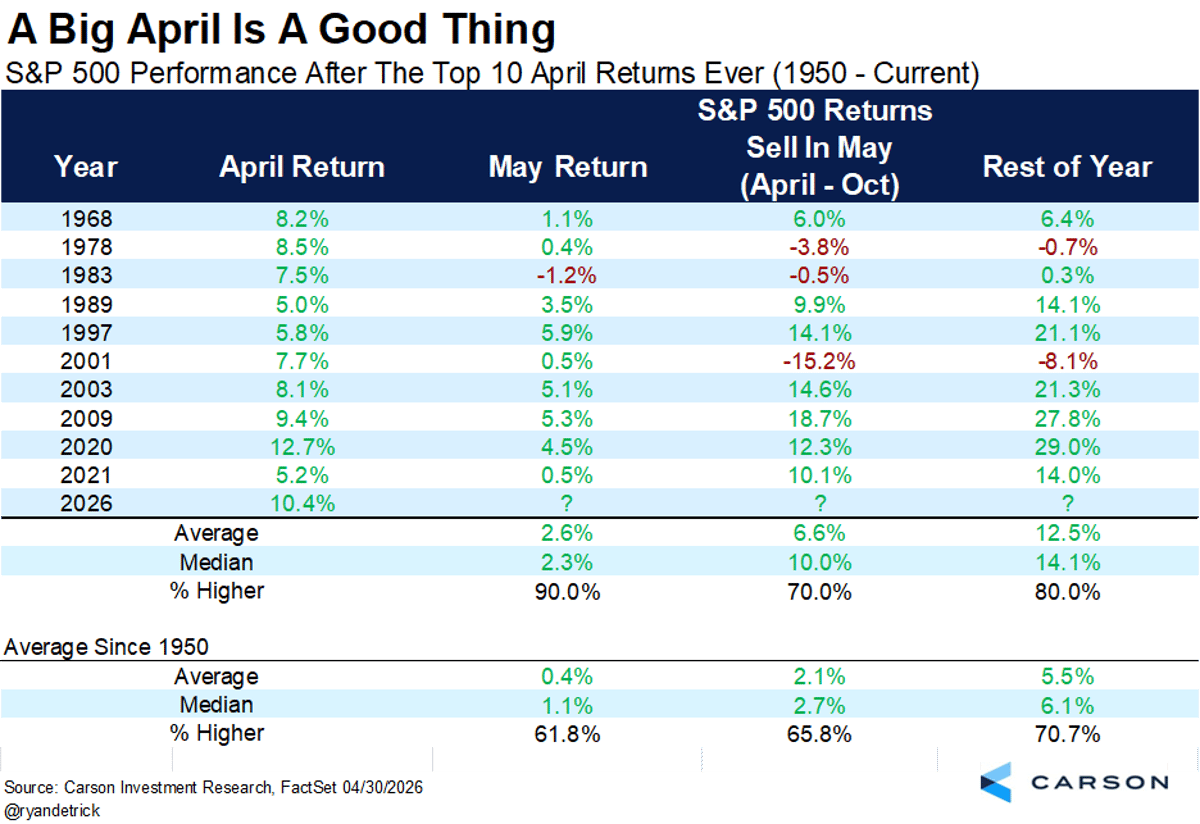
May Gains Expected After Record‑breaking April Rally
Stocks are up in May, but this is normal after a big April. May was higher after 9 of the top 10 April returns ever. https://t.co/EPWRajjU3I
US Index Futures Surge Over 1% Across Board
JUST IN: U.S. S&P 500 E-MINI futures are up 1%, NASDAQ 100 futures are up 1.71%, and Dow futures are up 1.22%.

One‑Std Dev Daily Pump Targets Intel and S&P
New free article on Price Action Lab Blog: The Relentless One-Standard Deviation Daily Market Pump $INTC $SPX Link in reply below 👇 https://t.co/OhAeaiNTWW

Scott Redler’s Live Premarket Update Highlights Top Picks
⏰ Scott Redler’s #630club - LIVE Premarket Stock Market Update ➡️ Free VIP List Newsletter: https://t.co/EW4O2nc6Yl $NVDA $TSLA $IBIT $SNDK https://t.co/WsSRcWjbY3
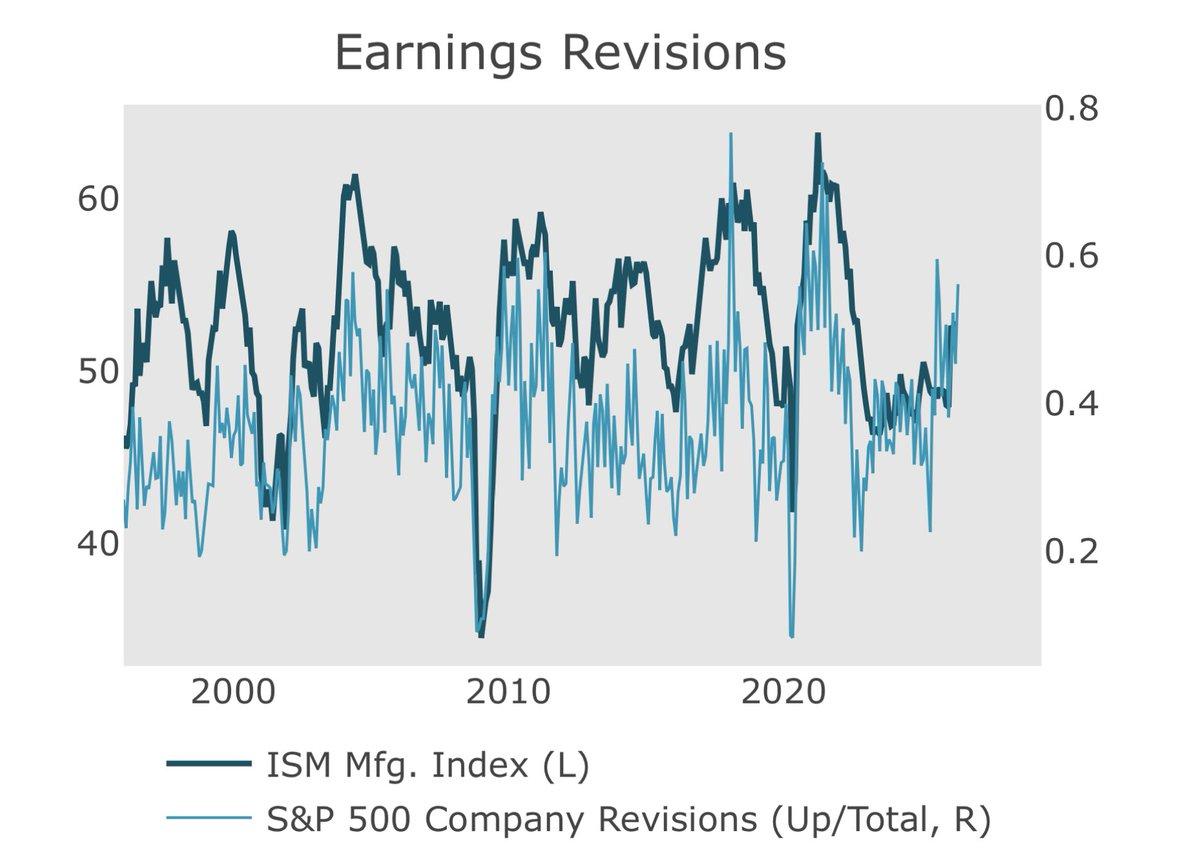
Macro Breadth Returns: Lower Rates and Oil Boost EPS
Today’s backdrop is the broadest macro & micro backdrop we’ve seen since 2021. While AI themes remain dominant, a more classic macro broadening has been taking place since 4Q/25, for the first time in years. Lower rates/oil can help to...

UC Stocks Only If You Embrace No Exit
🌅 सुबह की खबर, trader edition: US: Nasdaq +1% ATH | S&P +0.8% GIFT Nifty +186 pts → bullish open Crude $108 (-2%) | Iran 2-wk ceasefire AVI Polymers – 12th UC in a row CMP ₹23 | Zero debt | P/E 10 Trigger: AI HealthTech...
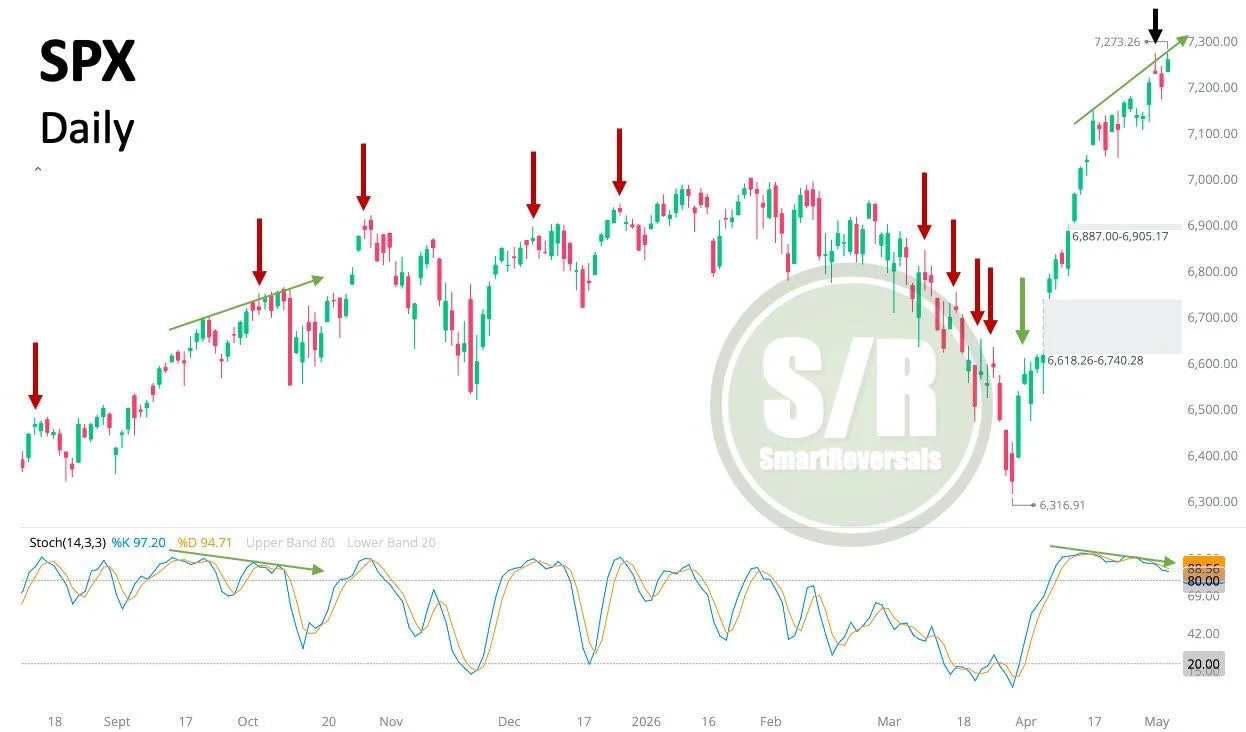
Hold Off Until SPX Breaches 7,299 Resistance
SPX: Don't fight the trend until key levels are breached. The recent indecisive candle is suggesting to be an early signal as the Stochastic divergence continues to extend. It is a matter of when, not if. Next major resistance: $7,299,...

Semiconductor Rally Set: AMD Spikes 15%,
Semi flows going to be nuts again tomorrow with AMD up 15% carrying ARM up 9%, MU up 5%, and INTC up 5% A/H
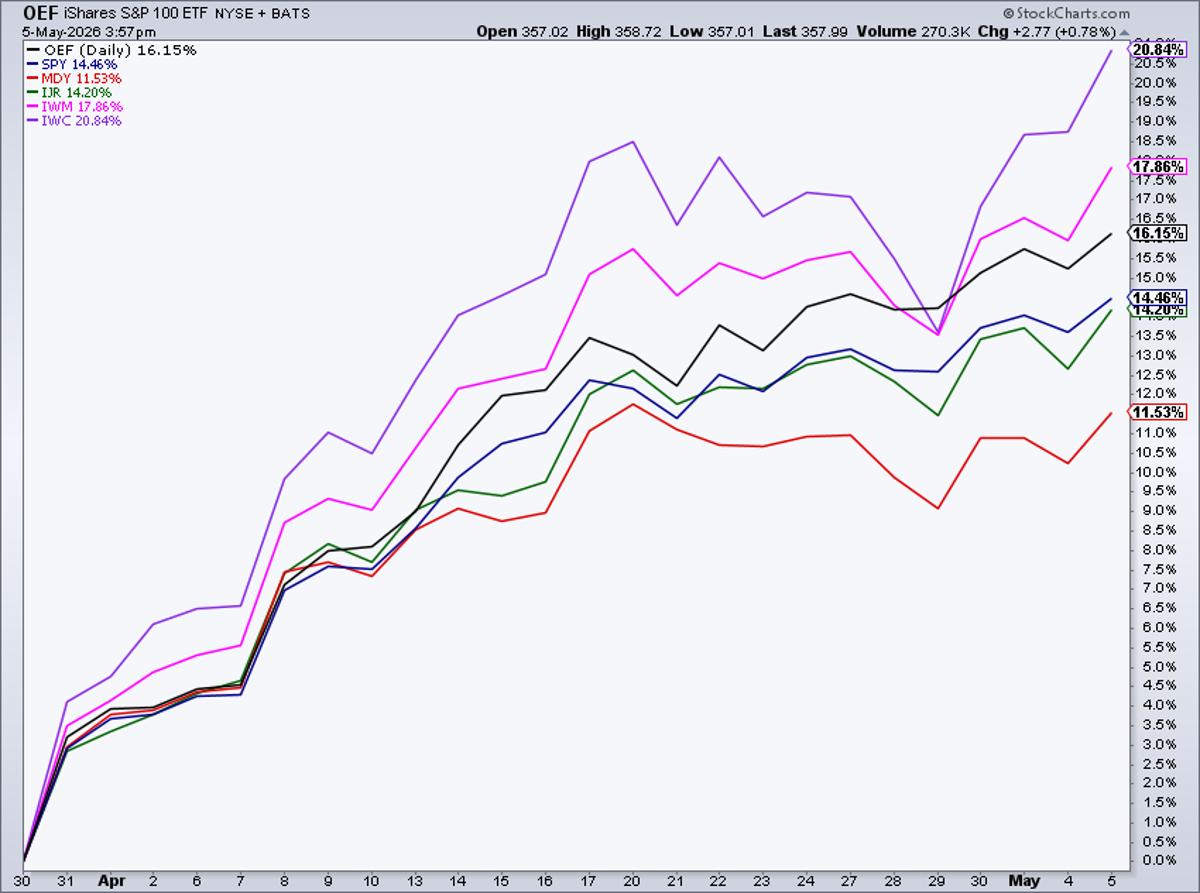
Microcaps Surge 21% While Mid‑Caps Lag Behind
$IWC microcaps leading off the March 30 low... +21% $SPY +14.5% Profitable mid-caps lagging +11.5% @stockcharts https://t.co/lRb6cd508o
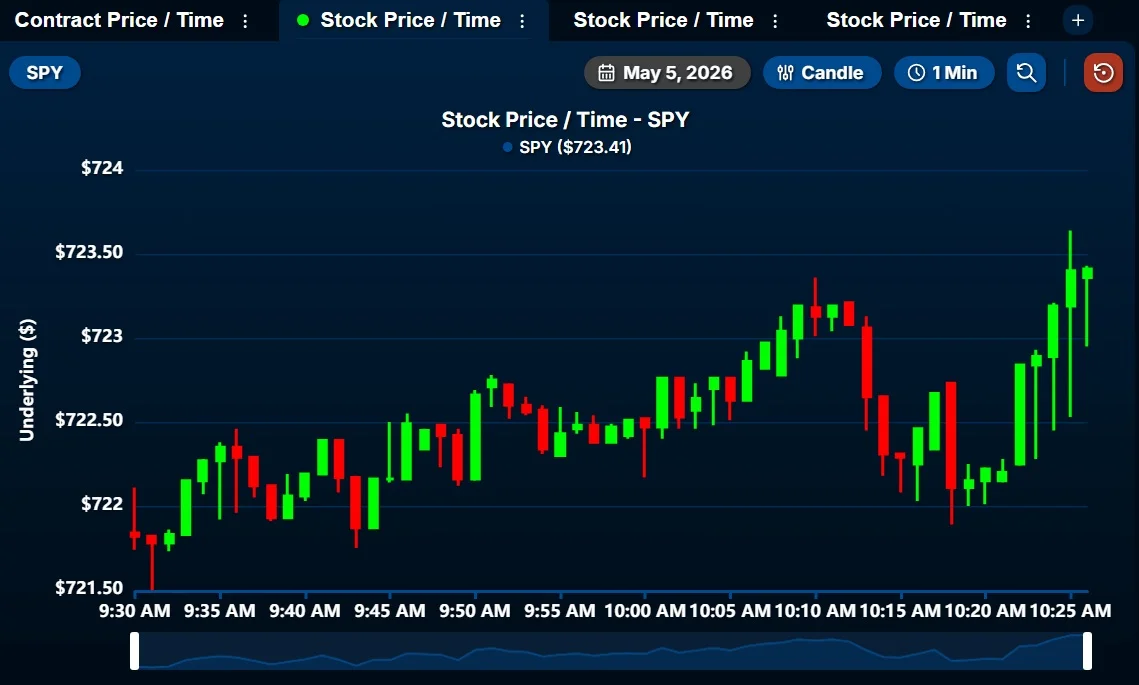
AI Divide Drives Market Split Amid Record Highs
May 5, 2026 close. S&P 500 and Nasdaq printed fresh all-time highs. SPY $723.77 +0.80%, QQQ $681.61 +1.30%, Dow +357 pts, Russell 2000 +1.68%. The headline says everyone won. The tape says the opposite. Underneath, the market just split AI...

Market Signals Bearish Trend Despite All‑time Highs
Yep, both the market and my Signaling Process agrees. It was ultra bearish for $QQQ $GOOGL etc. to print all-time highs with $META confirming Bearish @Hedgeye TREND today. I'll ask Freebird @HedgeyeComm about it tomorrow on The Call @HedgeyeTV

Super Micro Shares Jump 19% After Revenue Doubles
JUST IN: Super Micro's stock rises 19% after beating guidance as revenue more than doubles.
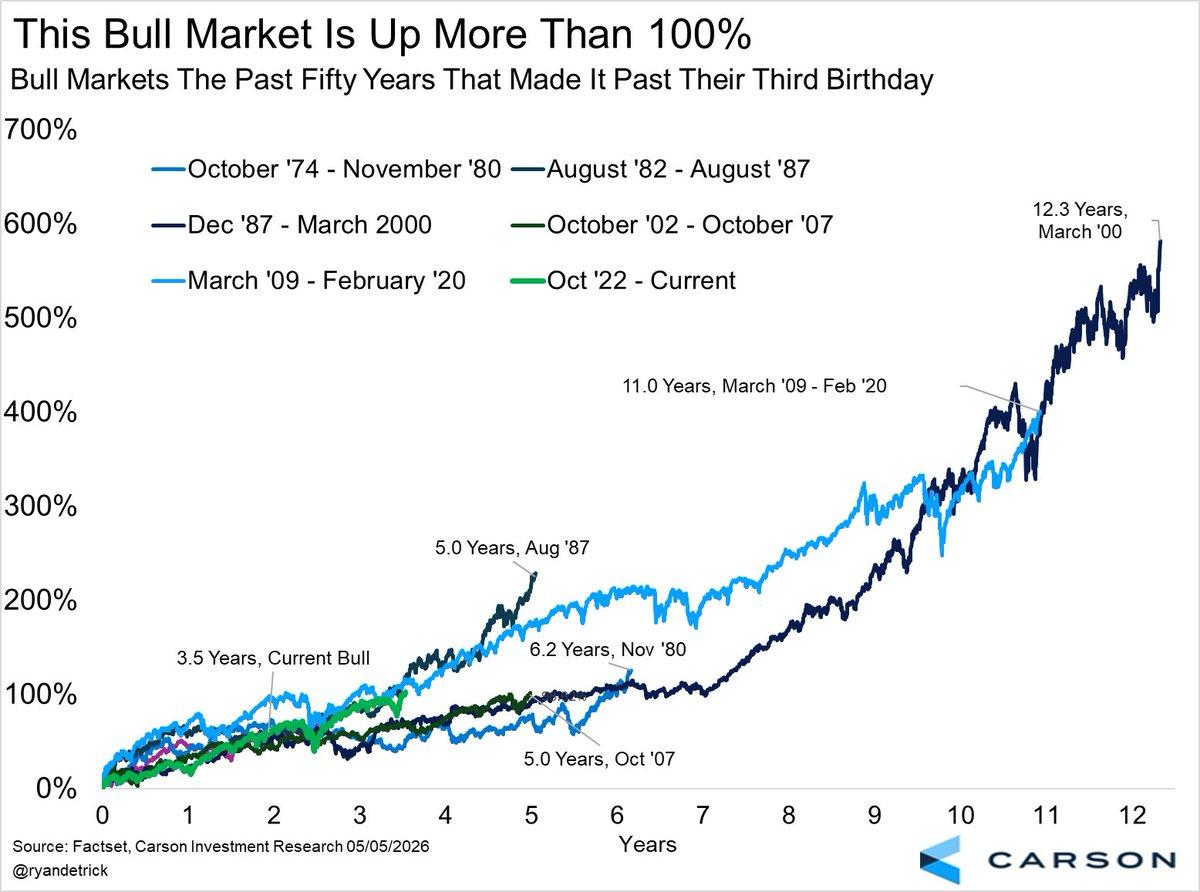
S&P’s 103% Rise Mirrors Past Bull Market Patterns
From the Oct '22 lows, the S&P 500 is up nearly 103% after today. Here's what the previous five bull markets that made it this far looked like. The bottom line? Years more of gains would be perfectly normal. https://t.co/FTzh4IWKYf
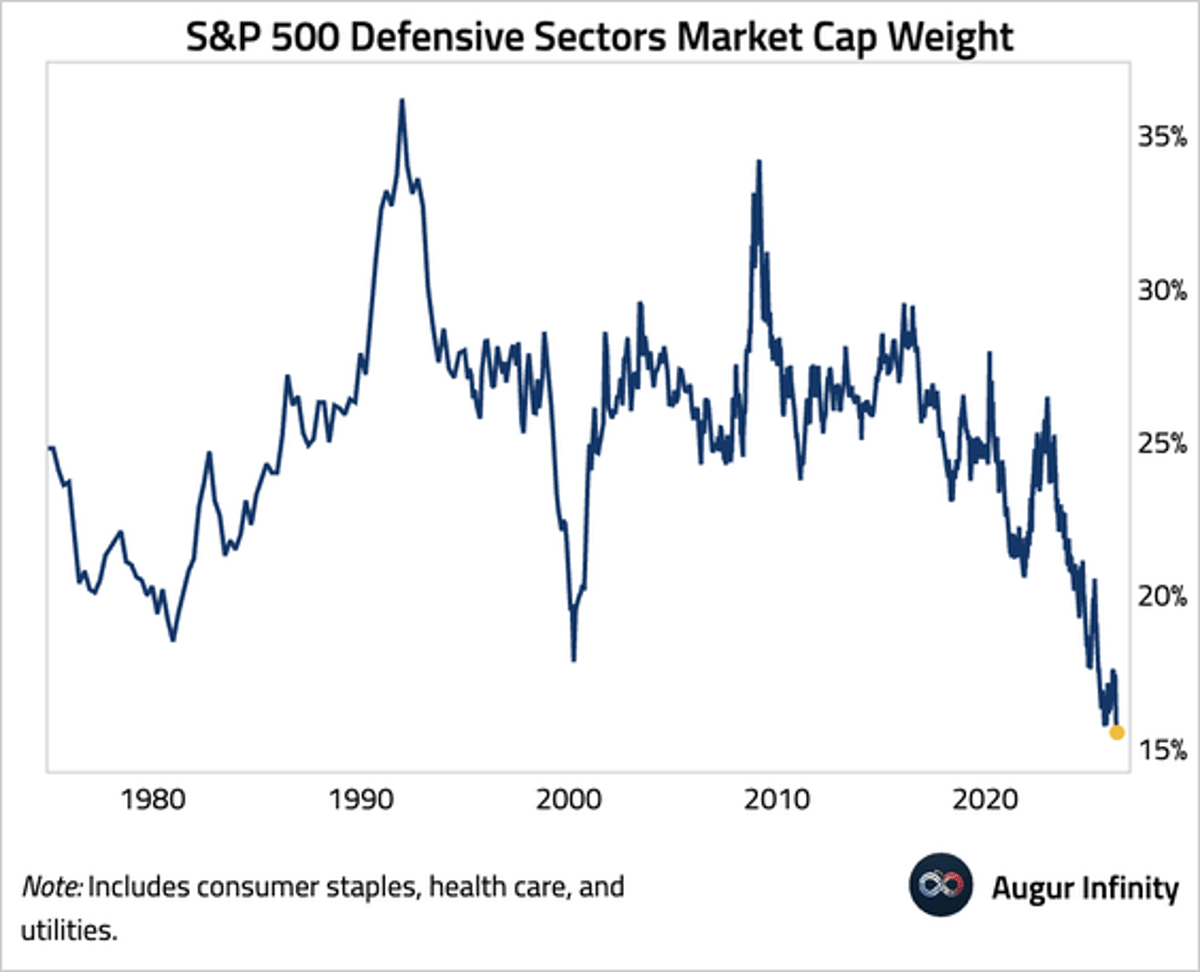
Defensive S&P 500 Sectors Hit Record Low Weight
The market cap weight of defensive sectors in the S&P 500 has fallen to a record low @augurinfinity https://t.co/KvIcxIReRU https://t.co/N5uatfPACb
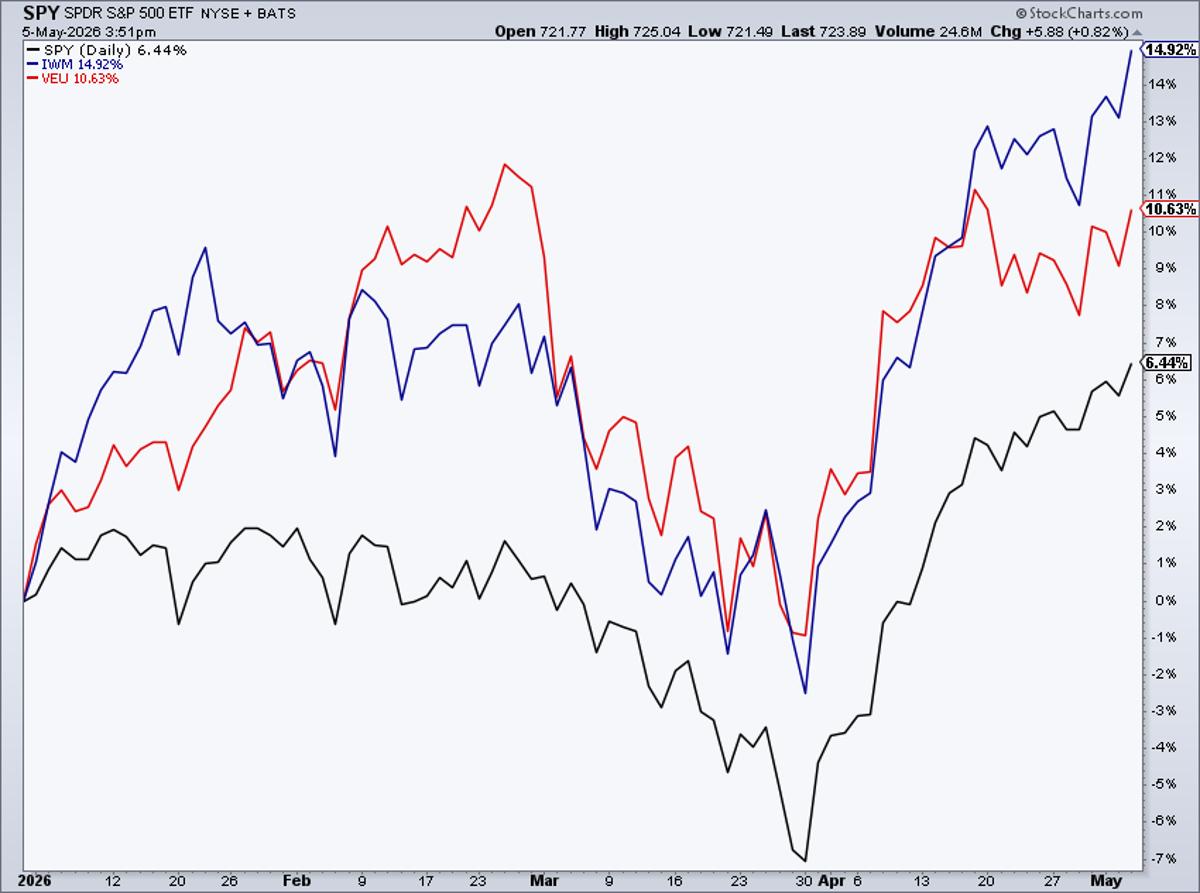
S&P 500 Lags Small Caps, International and MAG 7 ETFs
As the market supposedly hinges on the AI trade, the S&P 500 badly lags small caps and international stocks YTD $SPY $IWM $VEU Even worse for the S&P 100 ETF $OEF ... and even worse for the Mag 7 ETF...
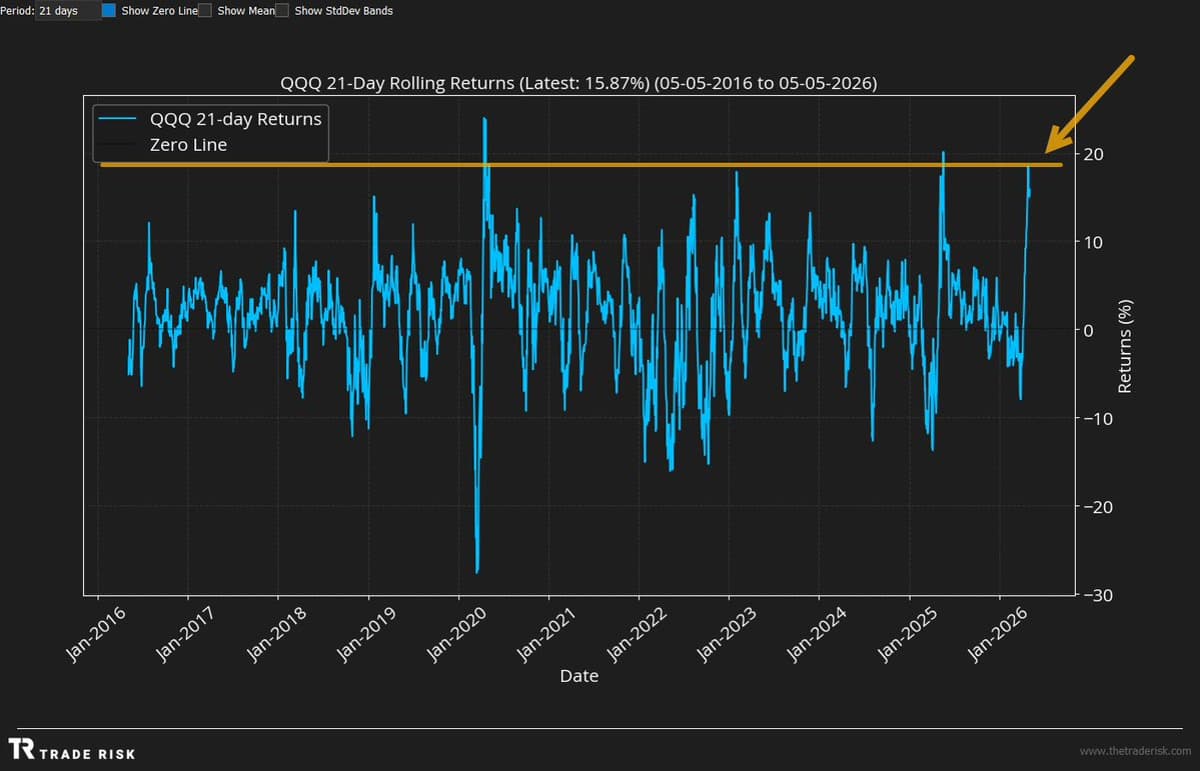
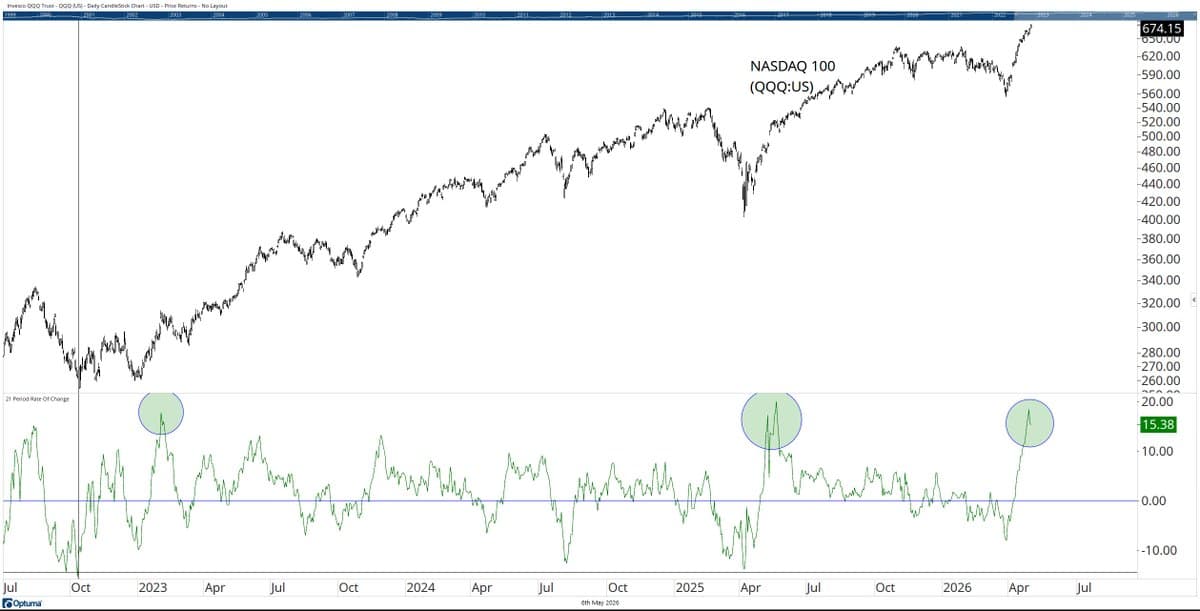
Nasdaq 100 Near Decade‑Best One‑Month Returns
One-month rolling returns for the Nasdaq 100 are approaching “as good as it gets” territory looking back 10 years. $QQQ https://t.co/dTWf01sTfH

Bulls Fueled by Groupthink, Not Fundamentals
Raging Bulls Run On Groupthink $SPX $AMZN $GOOGL $META $MSFT $NVDA Flows over Fundamentals, Part 3 😉 #LiveTradingRoom https://t.co/2x9sbANZVq
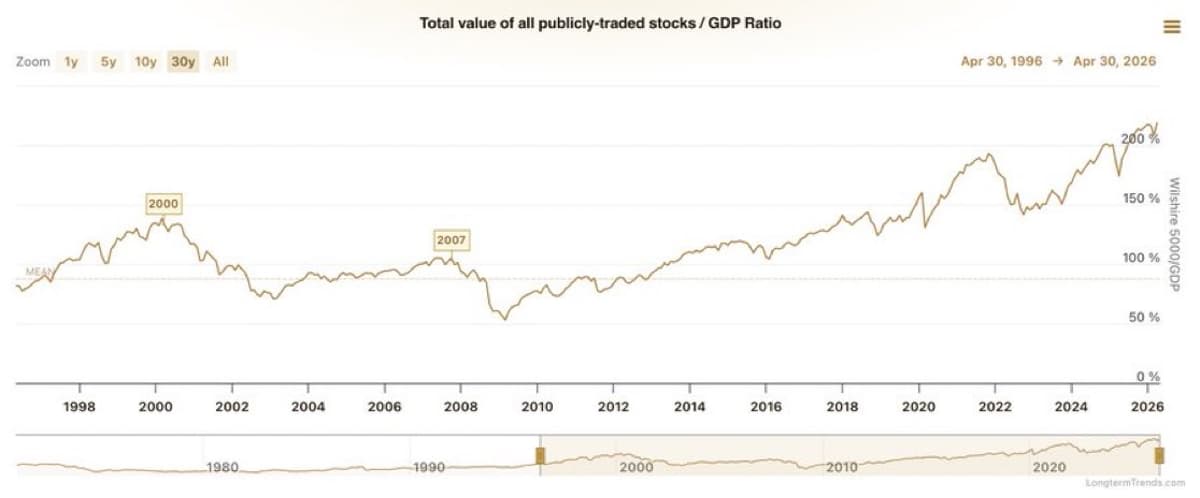
Market Hits Record Valuation, Buffett Indicator Tops 227%
Stock Market reaches it’s most expensive valuation in history after the Warren Buffett Indicator hits 227%, surpassing the Dot Com Bubble and the Global Financial Crisis: https://t.co/c3rpLbz8So
AI Boom Persists; Data‑center Stocks Poised for Gains
The AI trade is alive and well. Semiconductor stocks have run up a lot and likely due for a near-term pullback but other names involved in the data-centre buildout are not over-extended. Real GDP accelerated in March + April and with the...

Mega IPOs Push New Billionaires Toward US Asset Purchases
the equity supply/demand picture could definitely be complicated by the behemoth IPOs this year. but then i ask, what do newly minted multimillionaires and billionaires do with a flood of liquidity? marginal propensity to consume nearly topped out… i think they...

US Index Rebounds to Record in 25 Days
I don't know if investors are truly "looking past the war in the Middle East," but it's pretty amazing that a major US stock market index took just 25 trading days to go from war jitters lows...to record highs 👇

US Stocks Hold Steady as Europe Drags, Global Outlook Bullish
Vanguard global stock index is up about the same amount as the US market this year. Europe is acting as a drag so far this year with other markets (eg Brazil) outperforming strongly. Seems like international investors have got comfortable with...
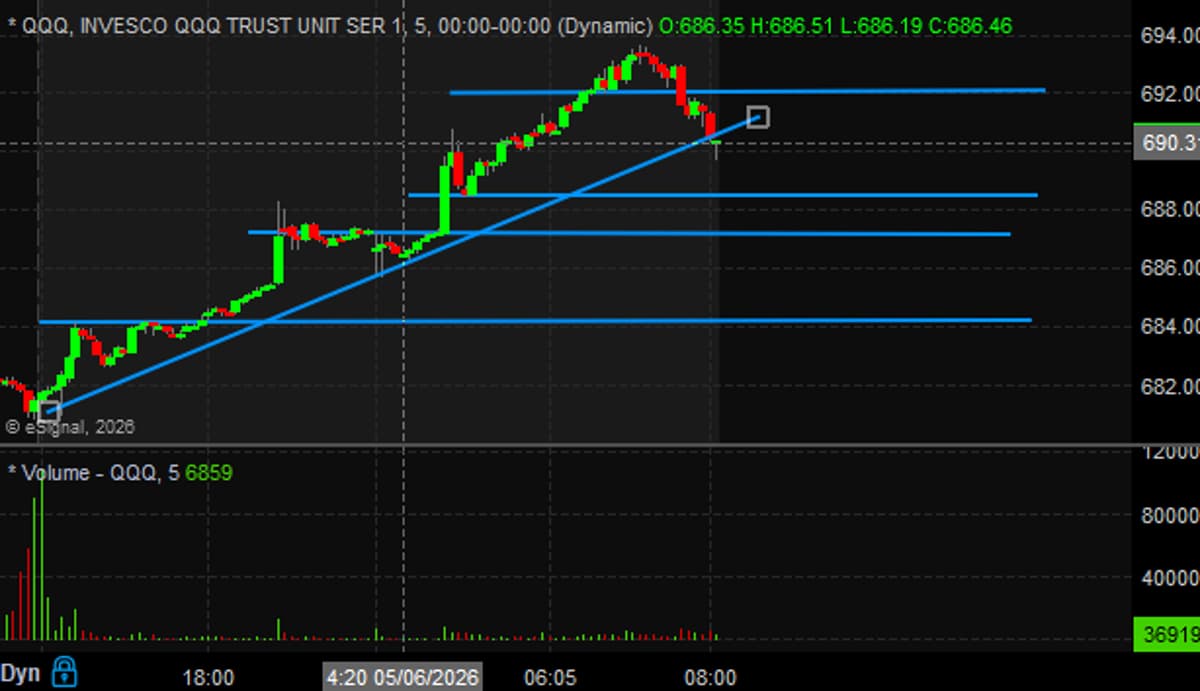
SPY Breaks $722 Support, Reversal Confirmed
You can not make this up...look at that aggressive reversal off $722 support on $SPY. I mentioned we are watching this range this morning, the same analysis stands.
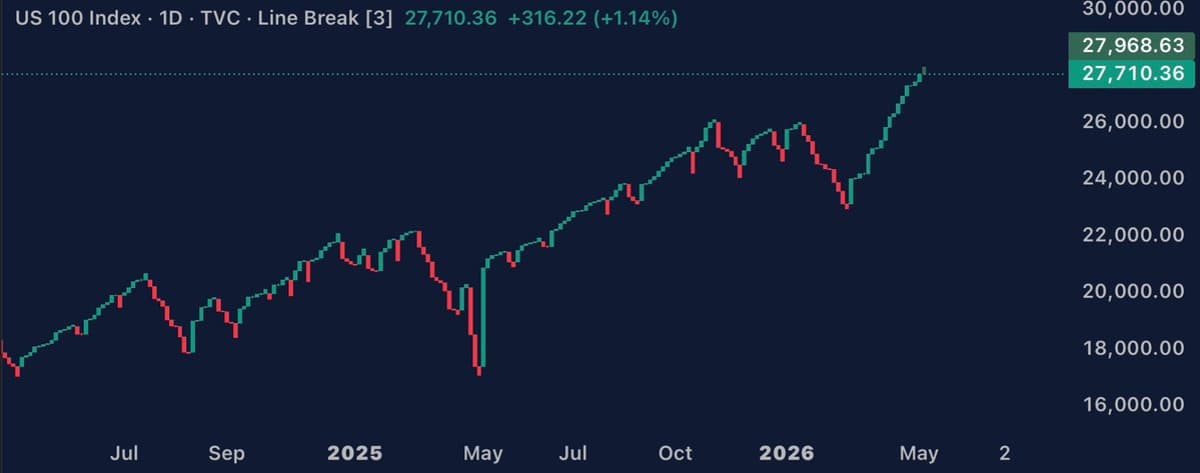
Nasdaq Surges 22.6% in Five Weeks, Hits Record
The Nasdaq just hit a new all-time high at 27,968. It’s up 22.6% in only 5 weeks, adding more than $6 trillion in market value. 🚀 https://t.co/PMyNwOB7V6
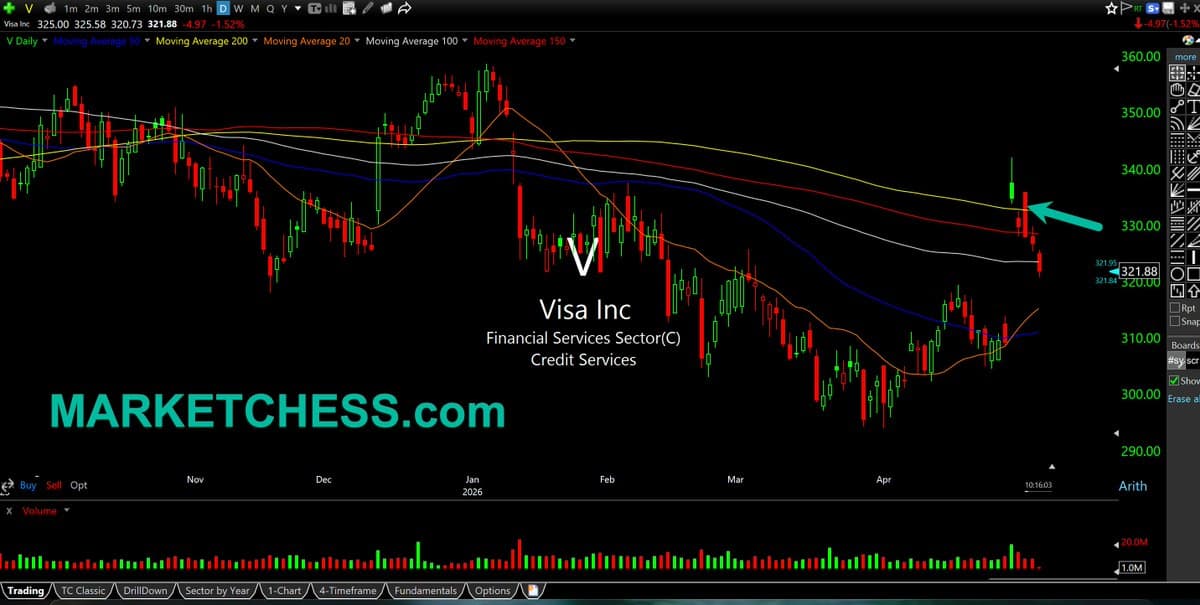
Market Split: Chip Stocks Soar as Majors Slump
$V Daily. Visa, and the likes of $CMG $NKE $LULU all red again. Incredible to see the bifurcation in this market still playing out as memory chips like $MU rally into the sky and nearly disappear into the atmosphere. https://t.co/adJJ4TDZtB
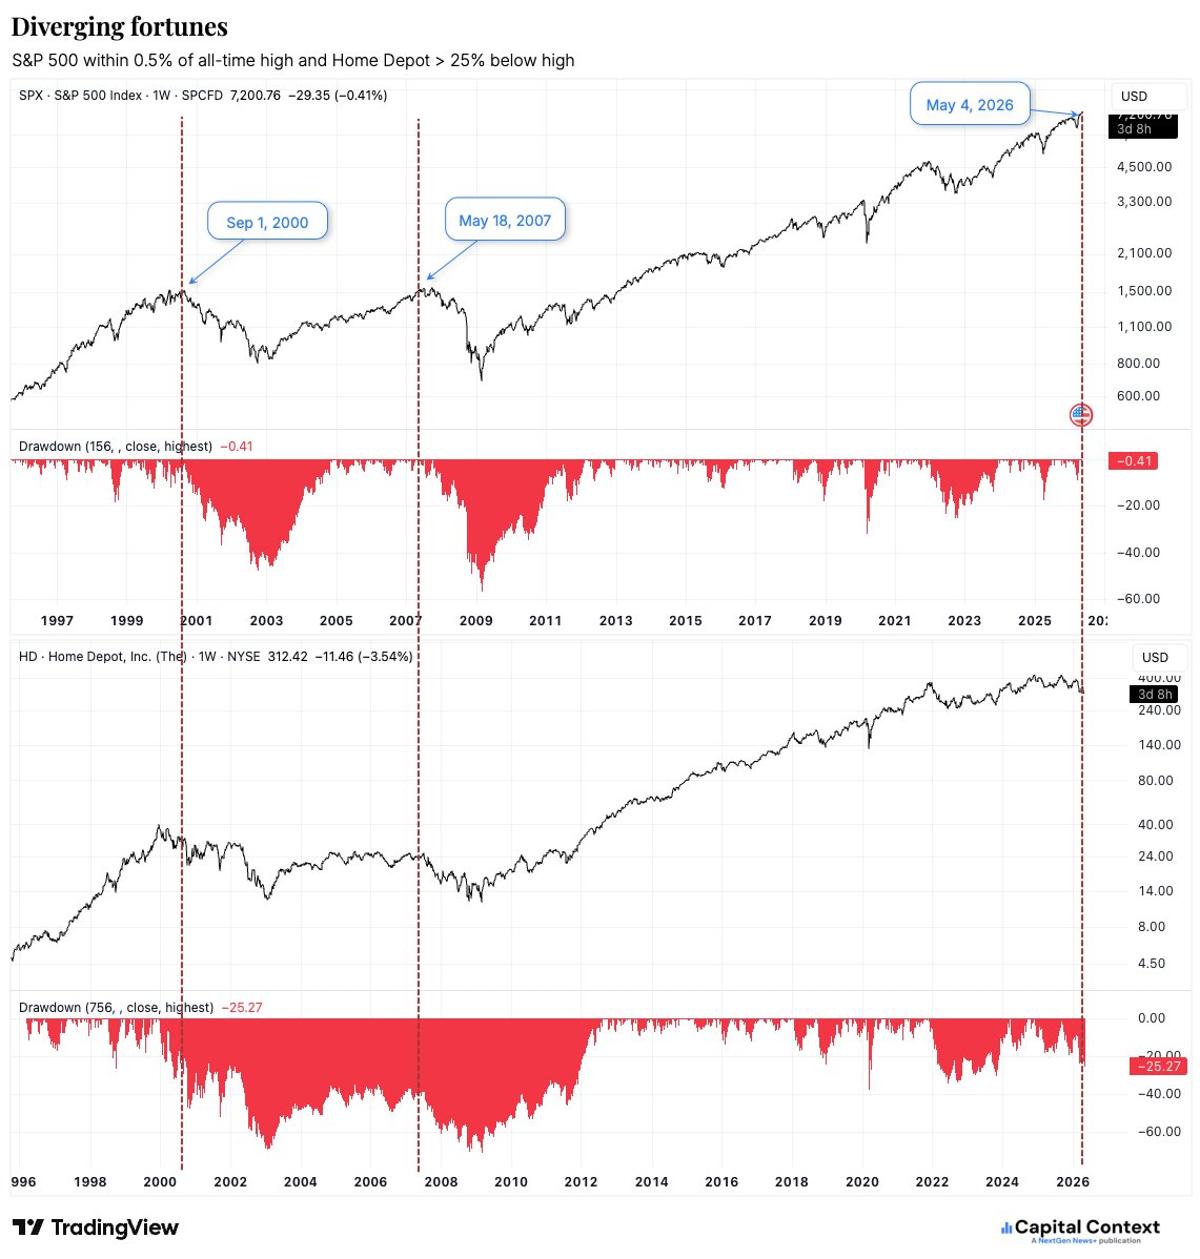
S&P Hits Record, Home Depot Plunges 25%—Rare Divergence
S&P 500 $SPY at/near all-time high while Home Depot $HD is more than 25% off. 3rd time in 30 years. Oh, well. This time is different. https://t.co/4WQAXlMCTv
Breadth Weakness Matters only without Strong Leadership
Concern for market breadth should ALWAYS be taken within the context of market construction and current leadership. Breadth Weakening less of a concern when we have solid offensive leadership and "big guys" participating.
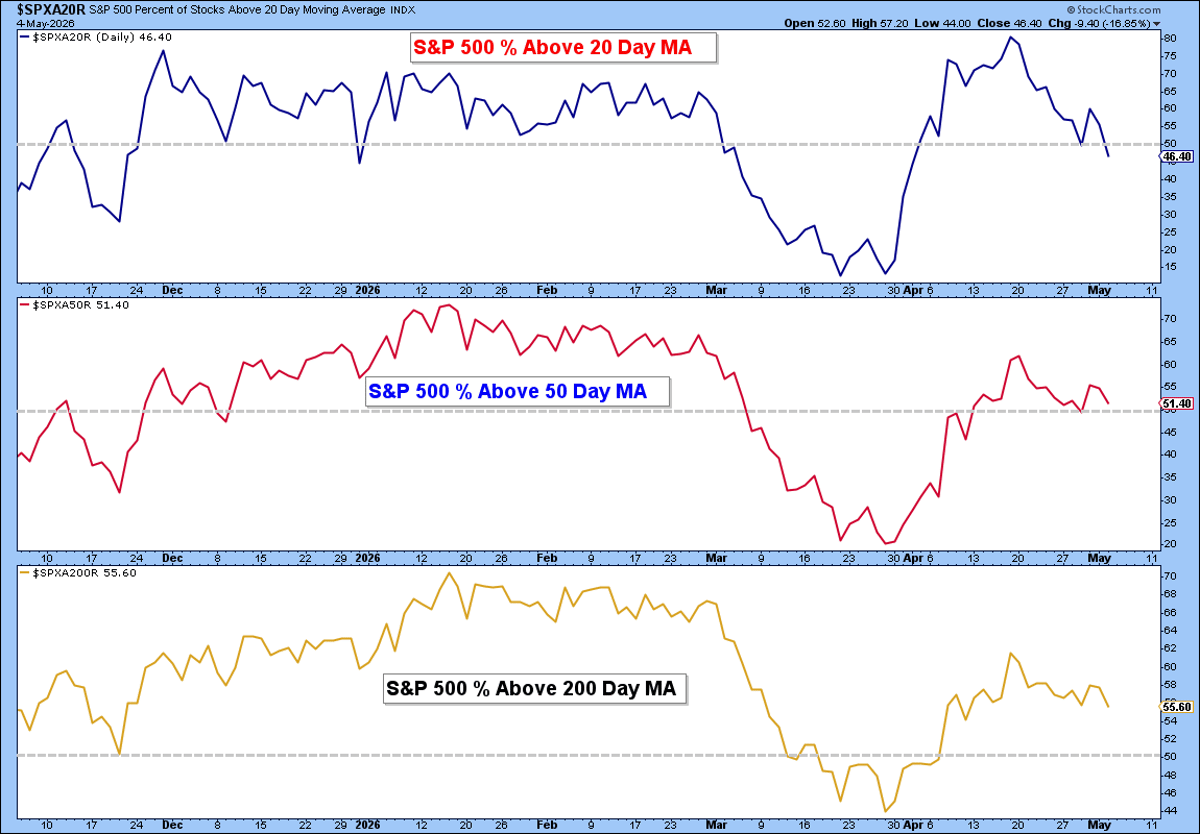
S&P 500 Bread
Not a call to be bearish just a data point to be aware of. Breadth weakening under the surface for the S&P 500. https://t.co/LcO3zUQv6W
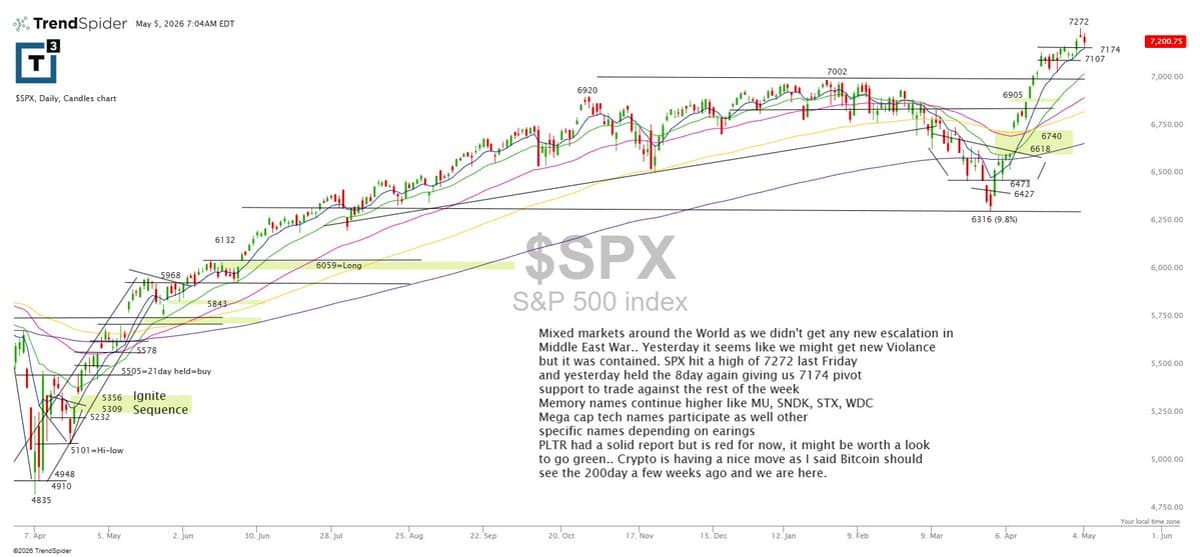
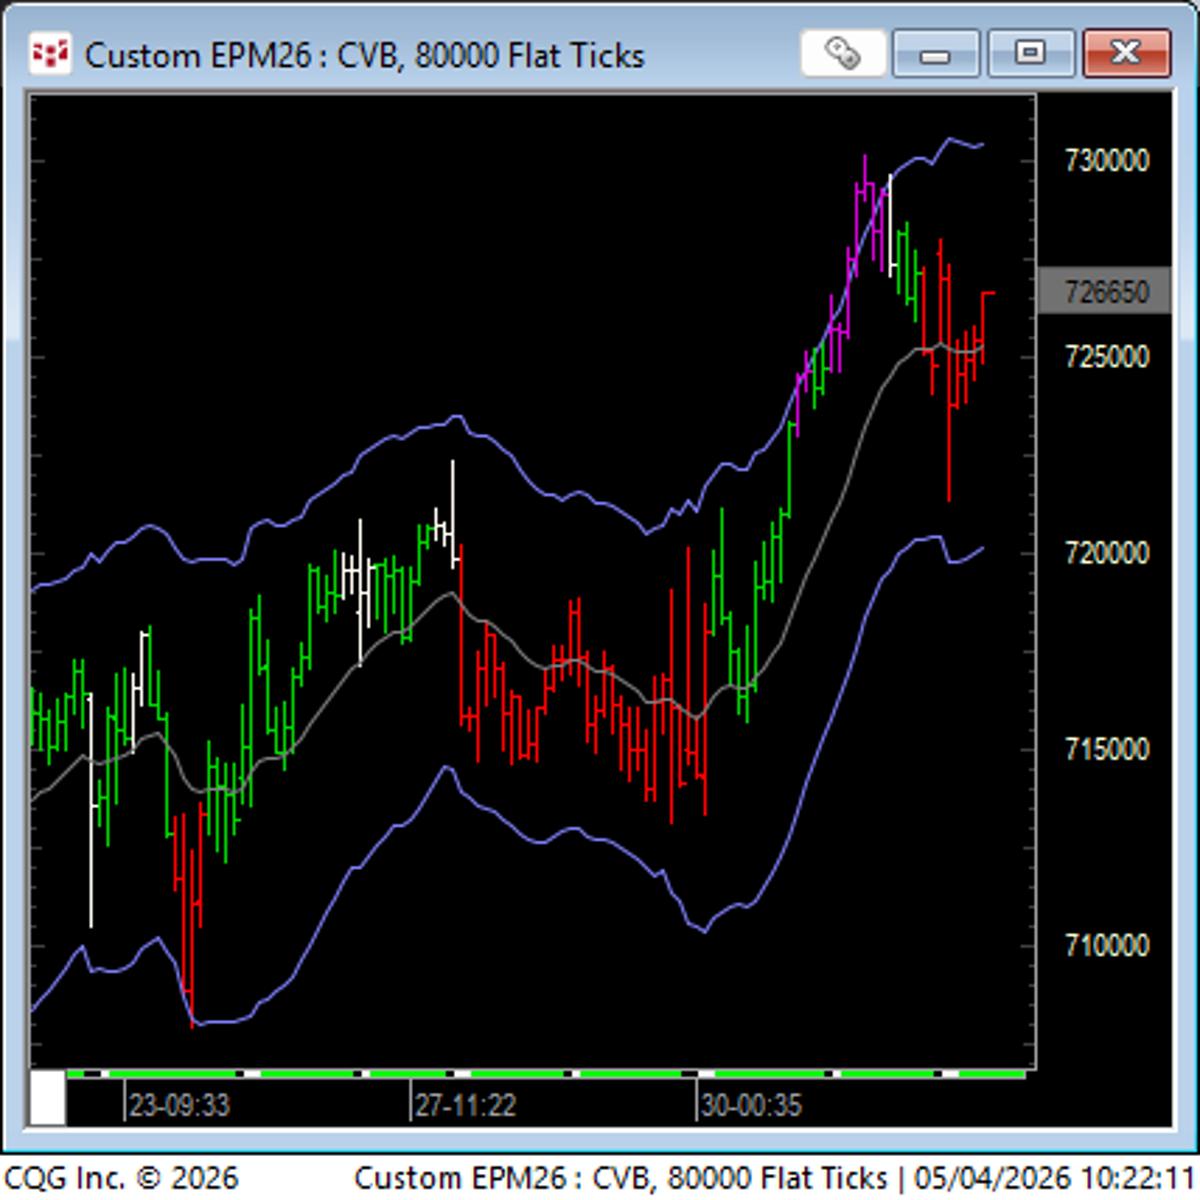
SPX Holds 8‑Day Pivot; Memory Stocks Stay Strong
$SPX is still riding the 8-day, using 7174 as the pivot support after tagging 7272 last Friday. Memory names are staying strong ($MU, $SNDK, $STX, $WDC) and mega-cap tech is participating, while $PLTR is red for now after a solid...
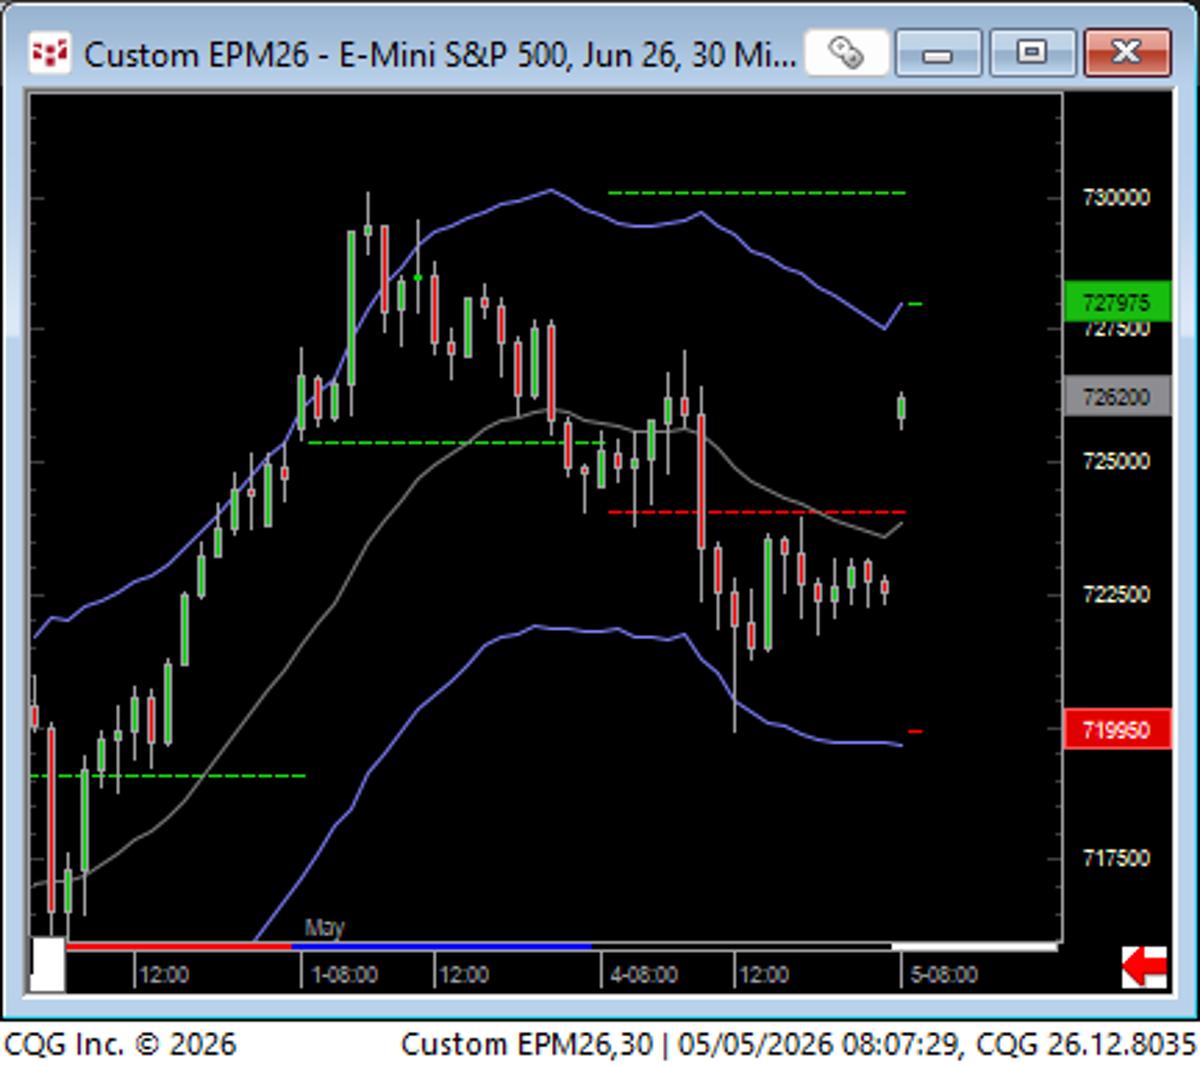
SP Opens Mid-Range After Two-Day Trading Range
SP: 8 AM reading - opens up in the middle of the previous 2 days trading range. https://t.co/kfcaaIJInP

Tight Jobs and Strong Services May Spike Rate Pressure
🚨 Morning Market Rundown – May 5, 2026 🚨 Big data cluster this morning — services PMI + JOLTs could move rates and sentiment fast 👀 🗓️ Economic Events: 0830 - Trade Balance (Mar): Exp -$60.9B; Prior -$57.3B 0945 - S&P Services PMI (Apr):...
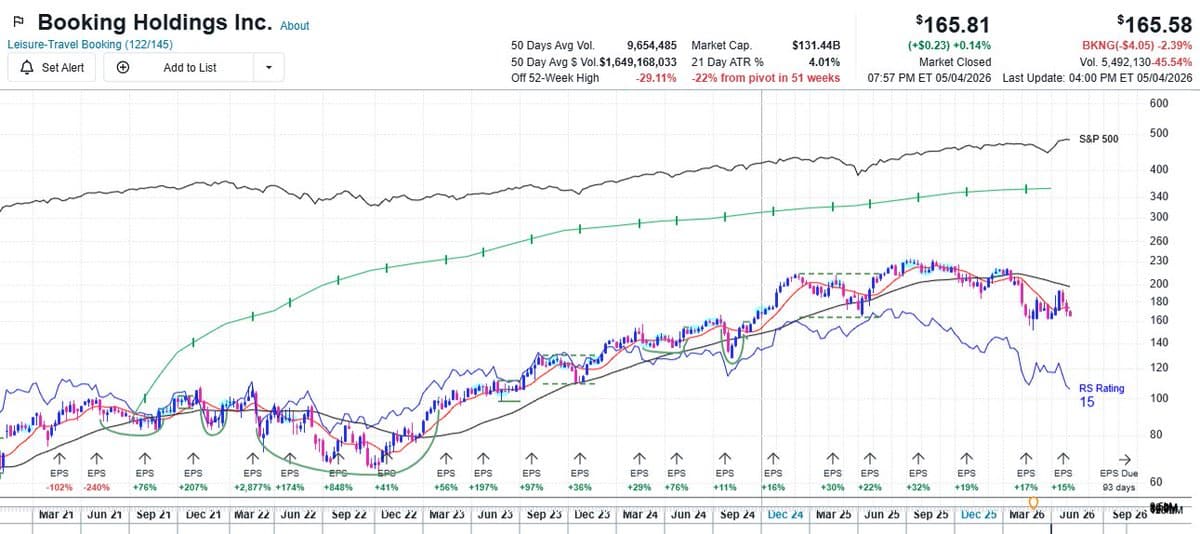
Travel & Leisure Drag Discretionary To
Travel booking Sites along w/ Casinos and Cruiseliner underperformance has resulted in quite a bit of near-term underperformance for Equal-wgtd Discretionary which has fallen to 4-yr lows v Equal-wgtd SPX. While most of earnings have come in moderately above forecast,...

SPX Breaks $7,191 Ceiling, Now Acts as Floor
"l aready reminded my SPX $7191 target/ceiling broke - so now it’s the floor - but is also where we revisit on any sudden news of escalation."
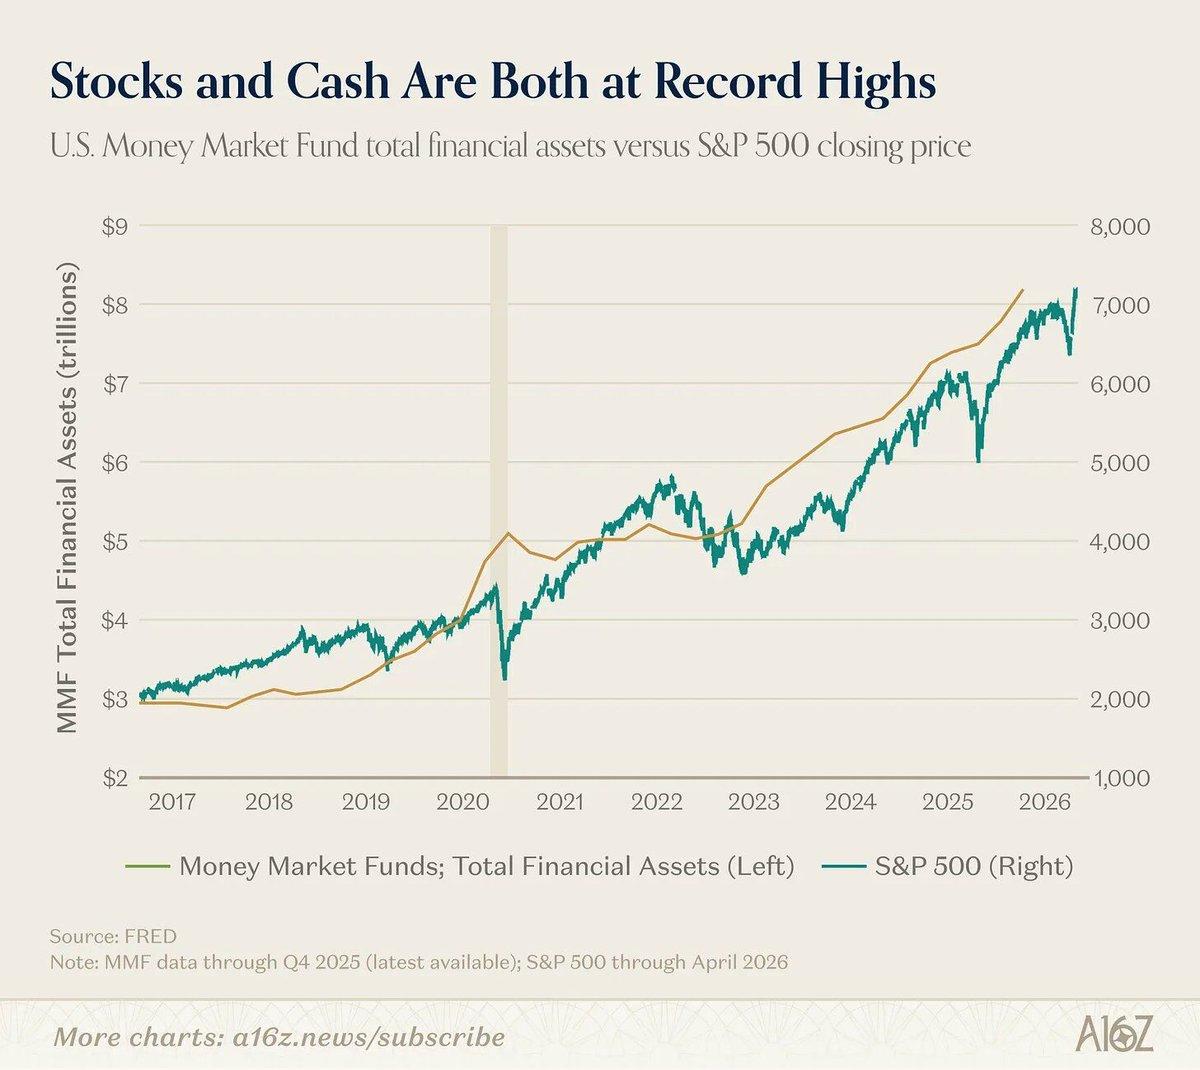
Stocks and Cash Hit Record Highs Simultaneously
🚨INSIGHT STOCKS AND CASH CONTINUE TO SURGE US money market fund assets and the S&P 500 are both at all-time highs https://t.co/DlNrEQMBRj
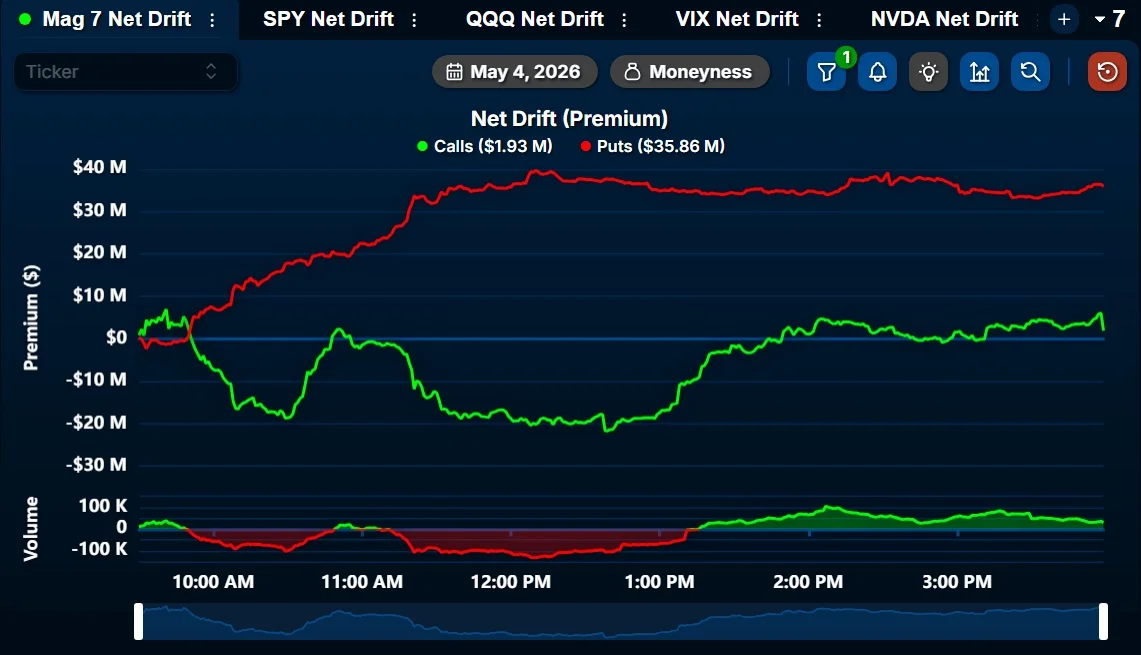
Middle East Tensions Prompt $36M Mag 7 Put Surge
$36M Puts on Mag 7 today This morning, news of tensions in the Middle East sent $SPY down a few dollars.
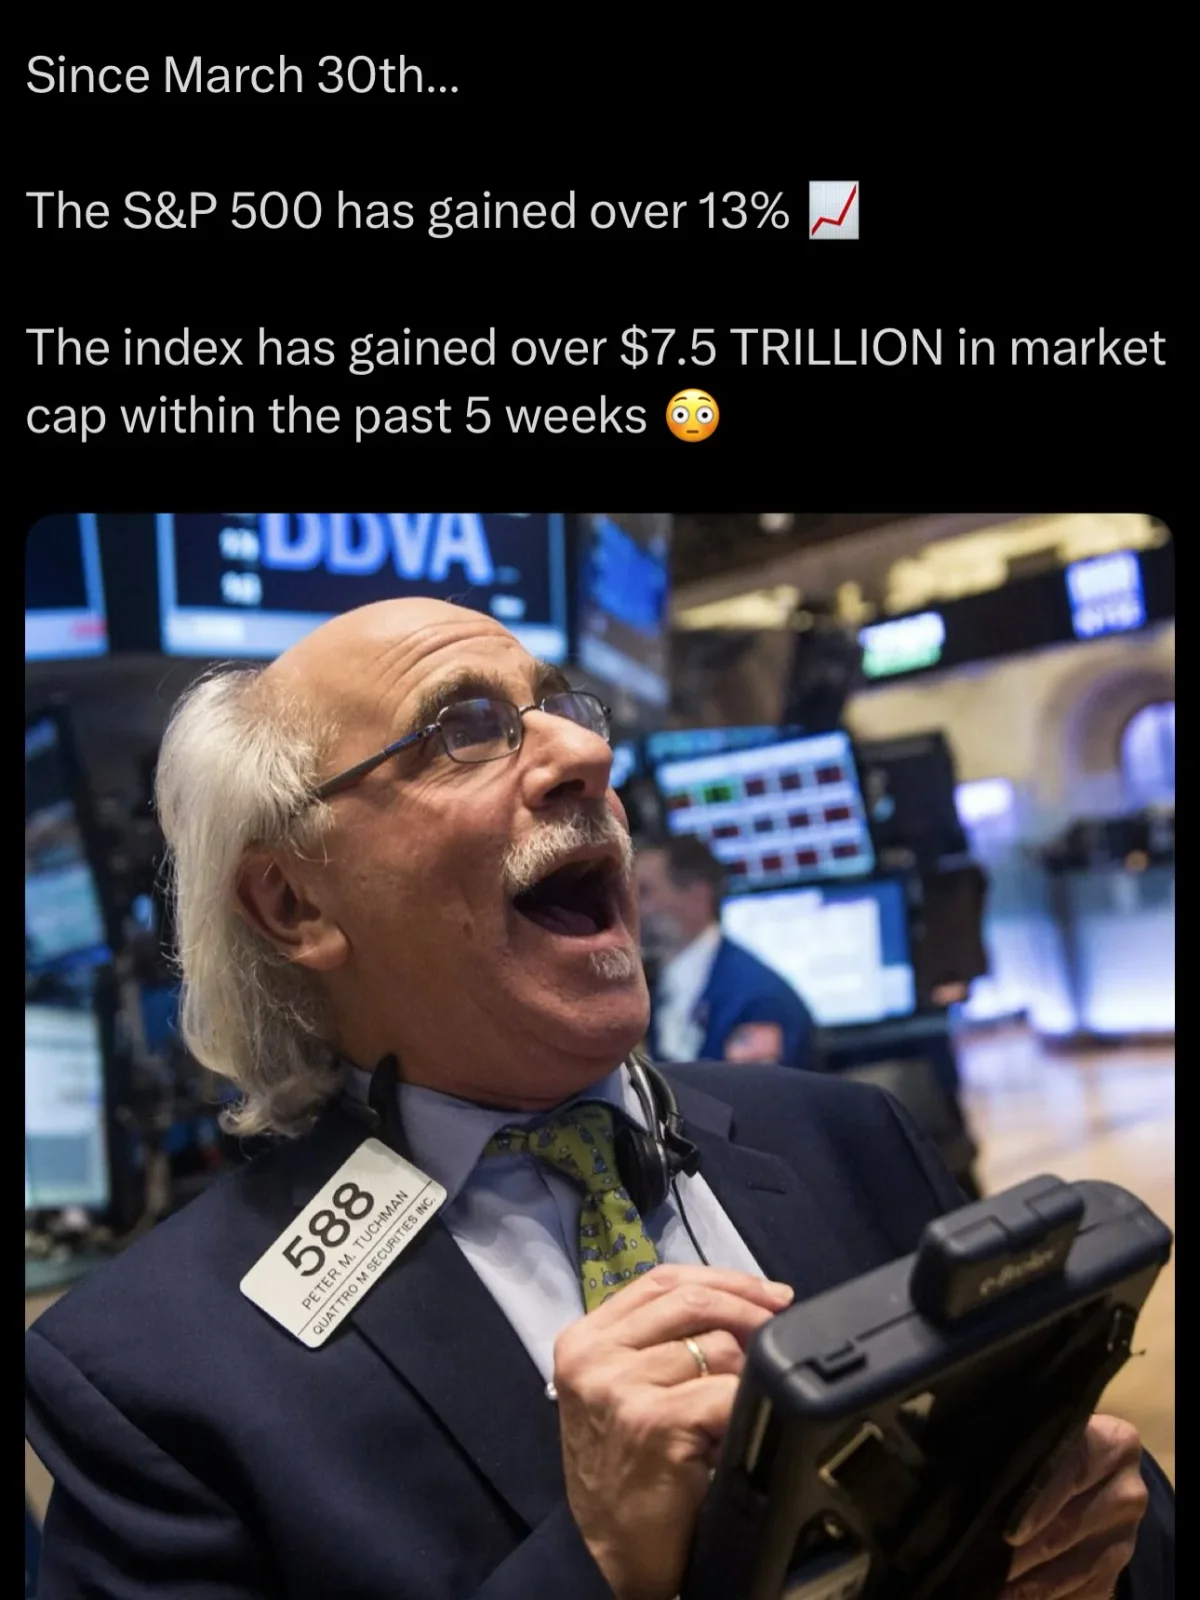
S&P Gains $7.5T, Reverses YTD Losses
Since March 30th, the S&P 500 has gained over $7.5 TRILLION in market cap 😳 On March 30th, the index was down 7.7% YTD. Today, it’s up almost 5%. Swipe to see how crazy the chart is 👀 So why the sell-off...

Unexpected
Listen ! (and we agree on everything, @TeslaLarry, except the rapidity of the ANNOUNCEMENT. I keep on saying that it would be unheard of if they manage to do that before the Nasdaq-100 inclusion, but hey ... All details on...
S&P 500 Hits Record as Financials Lag Below 200‑DMA
The S&P 500 has hit a new all-time high with the financials sector closing below its 200-DMA eight times in the past two weeks. Here are the three most recent times we've seen that: August 18-September 2, 2020 (11 days) October 5-October 11,...

Bullish Technical Sentiment Drives SPY, QQQ Higher
This is an excellent description of the bullish technical sentiment in the markets today. Well worth reading if you have access or even the non paywalled part $SPY 720.76 $QQQ 675.15

Equities Surge, Bonds Lag as Risk Spikes
$QQQ is up 20.8% from the Mar 30 low. $TLT is near the bottom of its 3-month range. Risk is screaming. Bonds are not applauding.
S&P Pullback Amid Uptrend, Russia Leads Breadth Surge
SP early AM structure: pullback in an uptrend...Rus leading now pulling breadth up to PLUS. https://t.co/OX2OZMiqv9

SPY Surge, VIX Plunge: Fear Turns to Complacency
$SPY just ripped from 631.97 to 720.65 while the VIX fell from 31.05 to 17.50. That is not healing. That is a market rapidly repricing fear into complacency.

Geopolitical Tensions and Tariffs Fuel Mixed Market Outlook
Markets are mixed this morning and here's why it matters 👇 Iran allegedly shot at US ships overnight. US denies damage but the message is clear, tensions are escalating, not cooling. Oil popped, then faded. Dow down, NASDAQ up, S&P flat. Add...
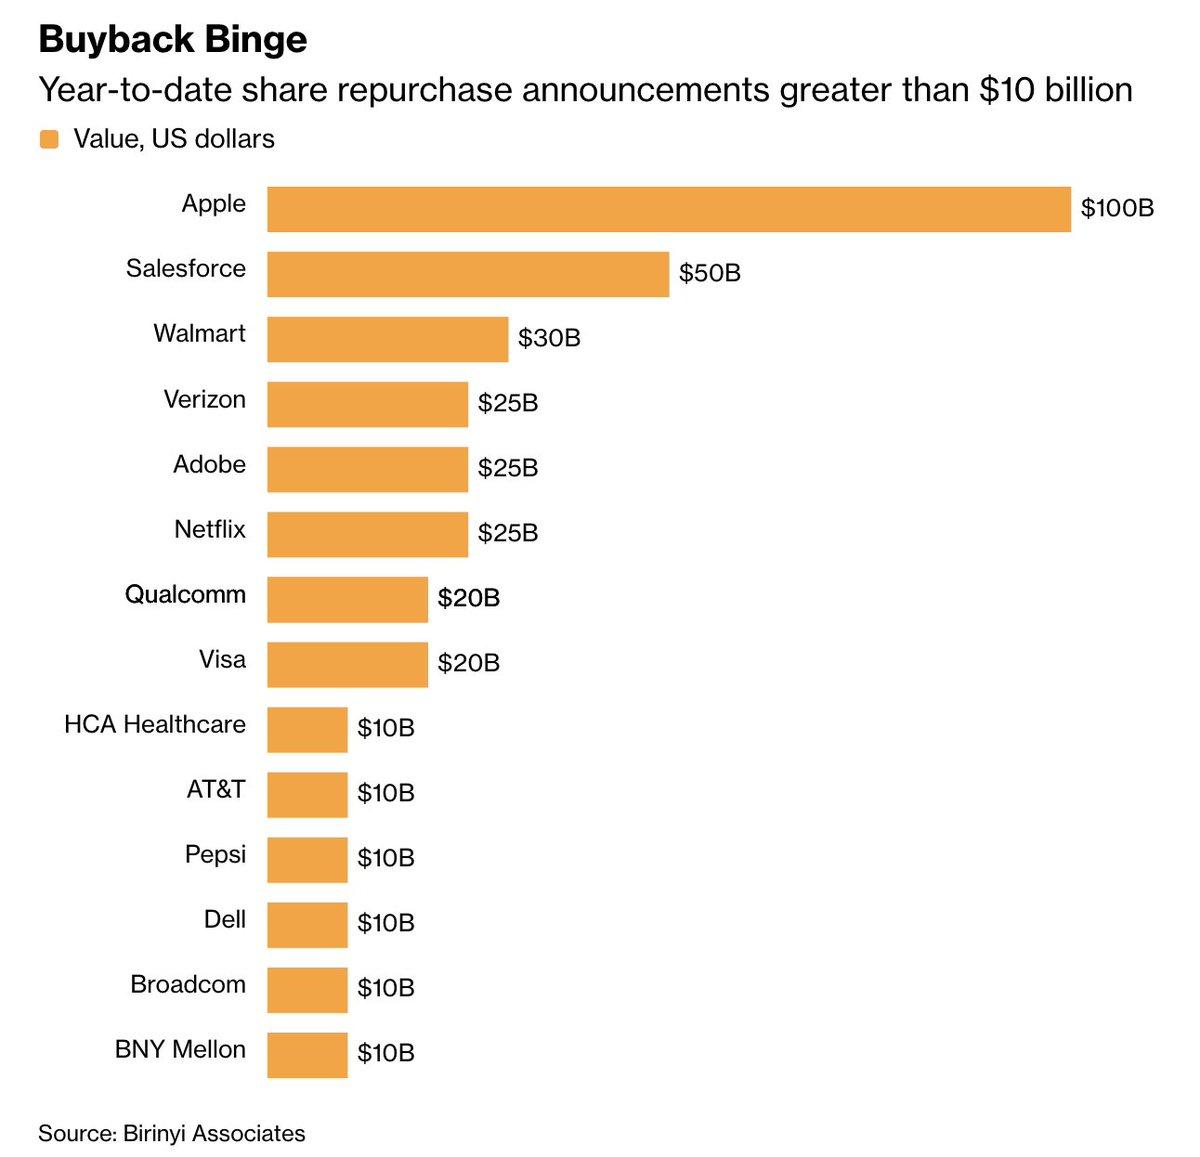
Corporate America Sets Record $665 B Buyback Start
"Corporate America announced plans to buy back $665 billion worth of shares in S&P 500 Index companies in the four months through April, the most ever to start a year, according to data from Birinyi Associates." https://t.co/NQec3D9V29
Join Live MRKT Call with Dan and Carter Worth
We're LIVE at 11am ET with Dan & @CarterBWorth on MRKT Call 📈 WATCH: https://t.co/EJePwCMhZ1 https://t.co/0Rd97vVB8g

Option Volume Jumps
From @Cboe: Friday's option volume of 78.2M contracts was 14% above recent average levels, with calls leading puts 3 to 2. Among the 500 most liquid single stocks, 30D IV was higher for 98 and lower for 354. @tastyliveshow
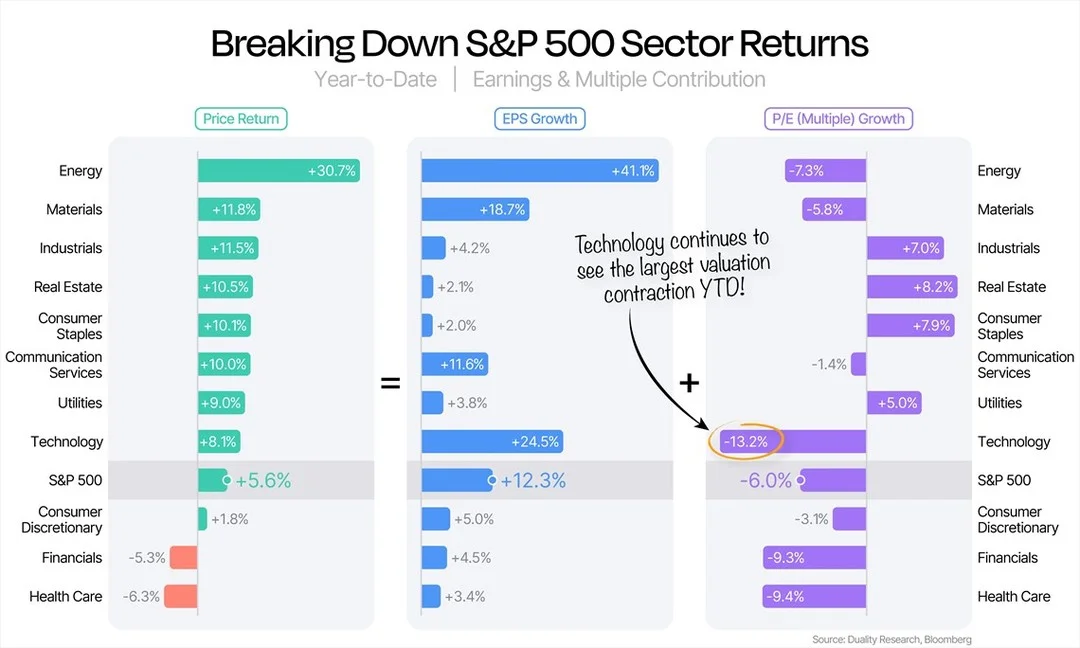
S&P 500 up 12% yet 6% Cheaper This Year
Despite it's +12% gain, the S&P 500 has gotten 6% cheaper this year. via Duality Research