
The Fibonacci Golden Zone Setup That Predicts Reversals
The video introduces a Fibonacci‑based “golden zone” setup designed to pinpoint price‑action reversals with high probability. By resetting the Fibonacci tool to the ratios 0, 0.706, 0.618, 1 and 0.79, three key levels emerge that define the golden zone. Traders first draw the zone from the low to the high of an uptrend; the zone marks where price is most likely to turn. The presenter recommends pairing the golden zone with a fair‑value gap—an area of missing liquidity. When price re‑enters the gap inside the zone, a long entry is taken, stop‑loss placed just below the zone, and profit targets set at the next swing highs. Using this combined signal can improve entry timing, tighten risk, and increase the odds of capturing the full reversal move, offering a repeatable edge for technical traders.
One Setup To Catch Every Liquidity Grab
The video introduces a day‑trading setup that targets liquidity grabs after price breaches a major resistance level. The presenter claims the method works “absolute wonders” and can be executed with a single free indicator on TradingView. The core idea is to...
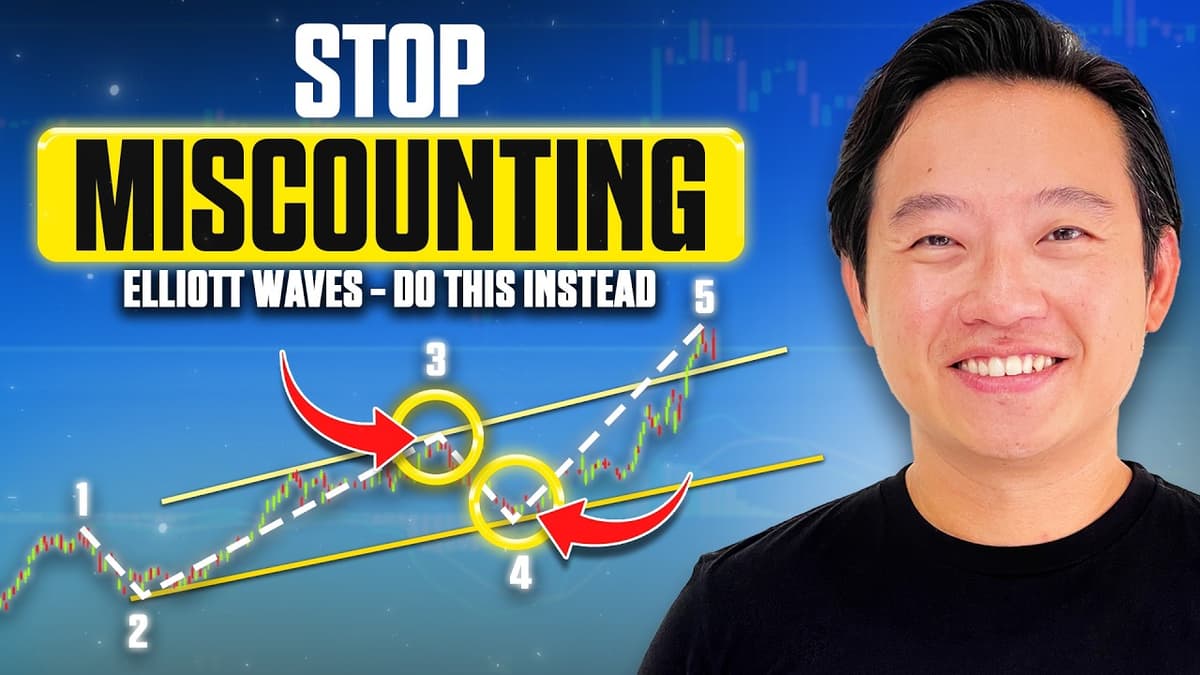
You're Counting Elliott Waves Wrong
The video walks viewers through a practical Elliott Wave framework, emphasizing how to identify whether the market is in an impulse or corrective phase before price moves fully unfold. It rejects forced wave counts and constant redrawing, instead offering a...

ORB Strategy EXPOSED: How to Tell a Real Breakout From a Trap (Don't Trade Without This)
The video introduces the Opening Range Breakout (ORB) framework, a systematic intraday approach that focuses on the first 15‑ to 30‑minute candle after the market opens. By marking the high and low wicks of that candle, traders create clear support‑resistance...

This ONE Gartley Pattern Prints Massive Reversals (Most Traders Keep Getting It Wrong)
Ezekiel Chu’s tutorial spotlights the Gartley harmonic pattern as a mathematically precise tool for catching massive market reversals. By mapping the five pivotal points—X, A, B, C, and D—and adhering to strict Fibonacci ratios, traders can differentiate a genuine Gartley...

Even Smart Traders Fail Because of THIS One Trading Psychology Mistake
The video titled “Even Smart Traders Fail Because of THIS One Trading Psychology Mistake” argues that the single most damaging error is conflating personal identity with trade outcomes. Presenter Ezekiel recounts how early career losses felt like personal rejection, prompting...

My EXACT Day Trading Strategy (Simple & Repeatable)
Ezekiel Chu breaks down a three‑step day‑trading framework that moves beyond hype and random indicators, focusing on market structure first. He argues that successful intraday trading begins with mapping support and resistance zones on higher timeframes—daily or 4‑hour charts—to define...

The 4 Decisions That Decide If You Pass a Prop Firm Challenge
The video breaks down the four decisions that separate traders who pass a prop‑firm challenge from those who fail, emphasizing that success hinges on mindset and structure rather than finding a perfect indicator. First, traders must assess the market context—momentum, exhaustion,...

Replit AI Review: Can It Really Build Apps for You?
Replit’s AI‑powered development platform, marketed as a way to build apps in minutes, is the focus of the video. Host Ezekiel walks viewers through how the service claims to eliminate traditional setup and infrastructure hurdles, positioning itself as a one‑stop...
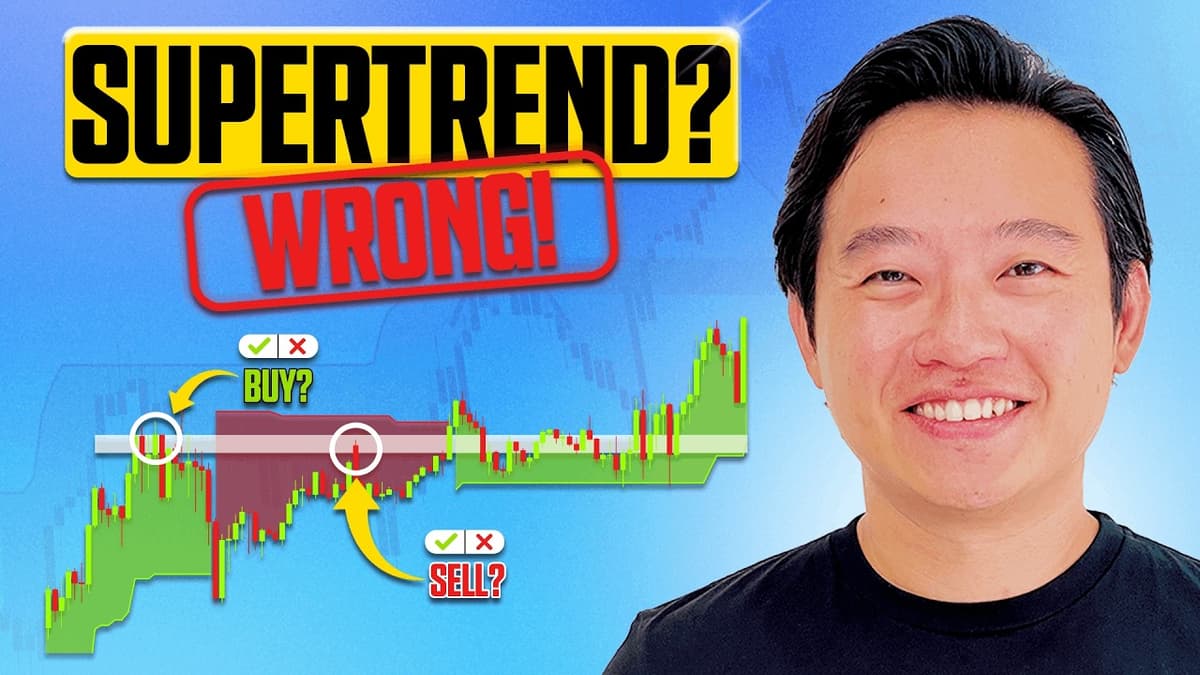
I Use This Supertrend Indicator Strategy (Most Traders Use It Wrong)
In this video Ezekiel Chiu explains why most traders misuse the SuperTrend indicator, treating its color changes as a simple buy‑or‑sell switch. He argues that the indicator was designed to grant "trade permission"—signaling when market conditions justify a bullish or...

The ONLY Heiken Ashi Strategy You’ll Ever Need
Ezekiel Chu outlines a three-part Heiken Ashi trading framework that reframes candles as a decision-making tool rather than raw signals. First, use higher-timeframe color shifts as an early clue and confirm with lower-timeframe structure (breakouts, patterns) before entering. Second, watch...