

Tillis Backs Warsh, Signaling Powell's Final Fed Meeting
Senator Tillis just said on TV that he will support Kevin Warsh as the next Fed Chairman, which will make next week's Fed meeting Powell’s last. #mortgagerates #bonds #realestate #economics #chartdaddy
Existing Homes Dominate Inventory; New Builds Stay Under 120k
One thing to remember, new construction, just nationally speaking, rarely gets above 120,000 completed units for sale. Even in 2008, it never reached 200,000, even though we had 4,000,000 active inventory. The majority of all inventory comes from the existing...

Condo Vs. Single‑Family Market Shock Revealed Soon
Mike is demonstrating both condominiums and single-family homes together. Wait until you read the tracker data this weekend. I rarely get as shocked as I did this week.
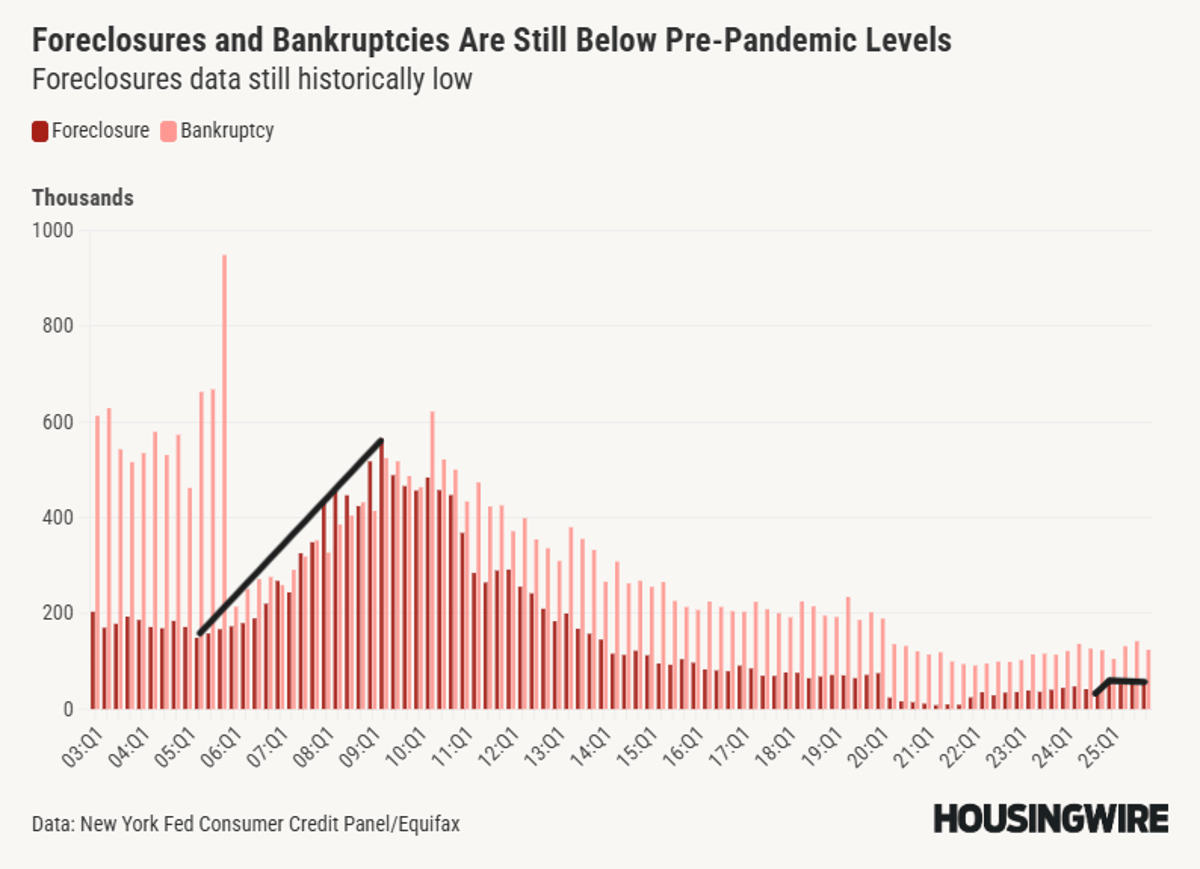
2005 Bankruptcy Reform and 2010 Qualified Mortgage Laws Revolutionized Lending
2005 BK reform law, notice all the BK filings before the law went into effect. Then add the 2010 Qualified Mortgage Law on top. Those two laws changed everything forever https://t.co/2gnt1ETE2e
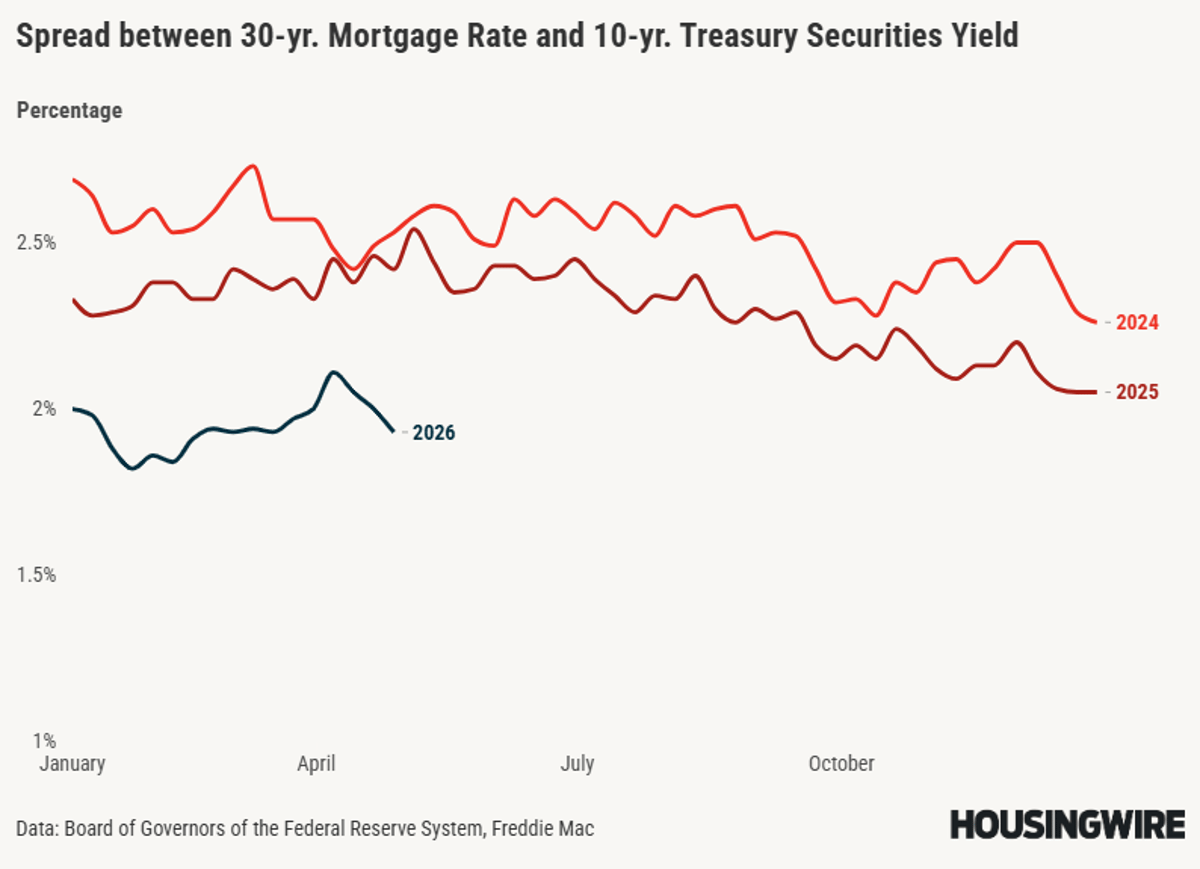
Improved Spread Levels Shave a Percentage Point
If we had the worst mortgage spread levels of 2023, mortgage rates would be 7.50% today, not 6.32%. If we had the worst levels of 2024, mortgage rates would be 7.12% today. If we had the worst levels of 2025, mortgage rates...

Weekend Housing Tracker Ranks Among Best in Years
This weekend's housing tracker was one of the better reports in years for many reasons do.

Pending Home Sales Surge in Unprecedented Weekly Spike
A very noticeble pickup in demand for our weekly pending home sales this week. More on this with our weekend tracker, with some more interesting data lines. One of the more interesting weeks over the past few years, in fact.

Charts Reveal Housing Impact as Powell Leaves, Warsh Begins
@housingwire A lot of charts in this one discussing the end of Powell's term and the Warsh era. #housing #realestate #mortgagerates #federalreserve #chartdaddy

Trump May End Probe, Threatening Powell’s Fed Chairmanship
Rumor has it Trump will drop the probe against Powell, which could end his tenure as Fed chairman. #mortgagerates #realestate #economics #inflation #chartdaddy

Low‑rate Mortgages Shield Older Borrowers From Past Crises
A ton of foreclosures and bankruptcies vs a 30-year fixed debt Stock vs flow economics https://t.co/CUdOs4rE71
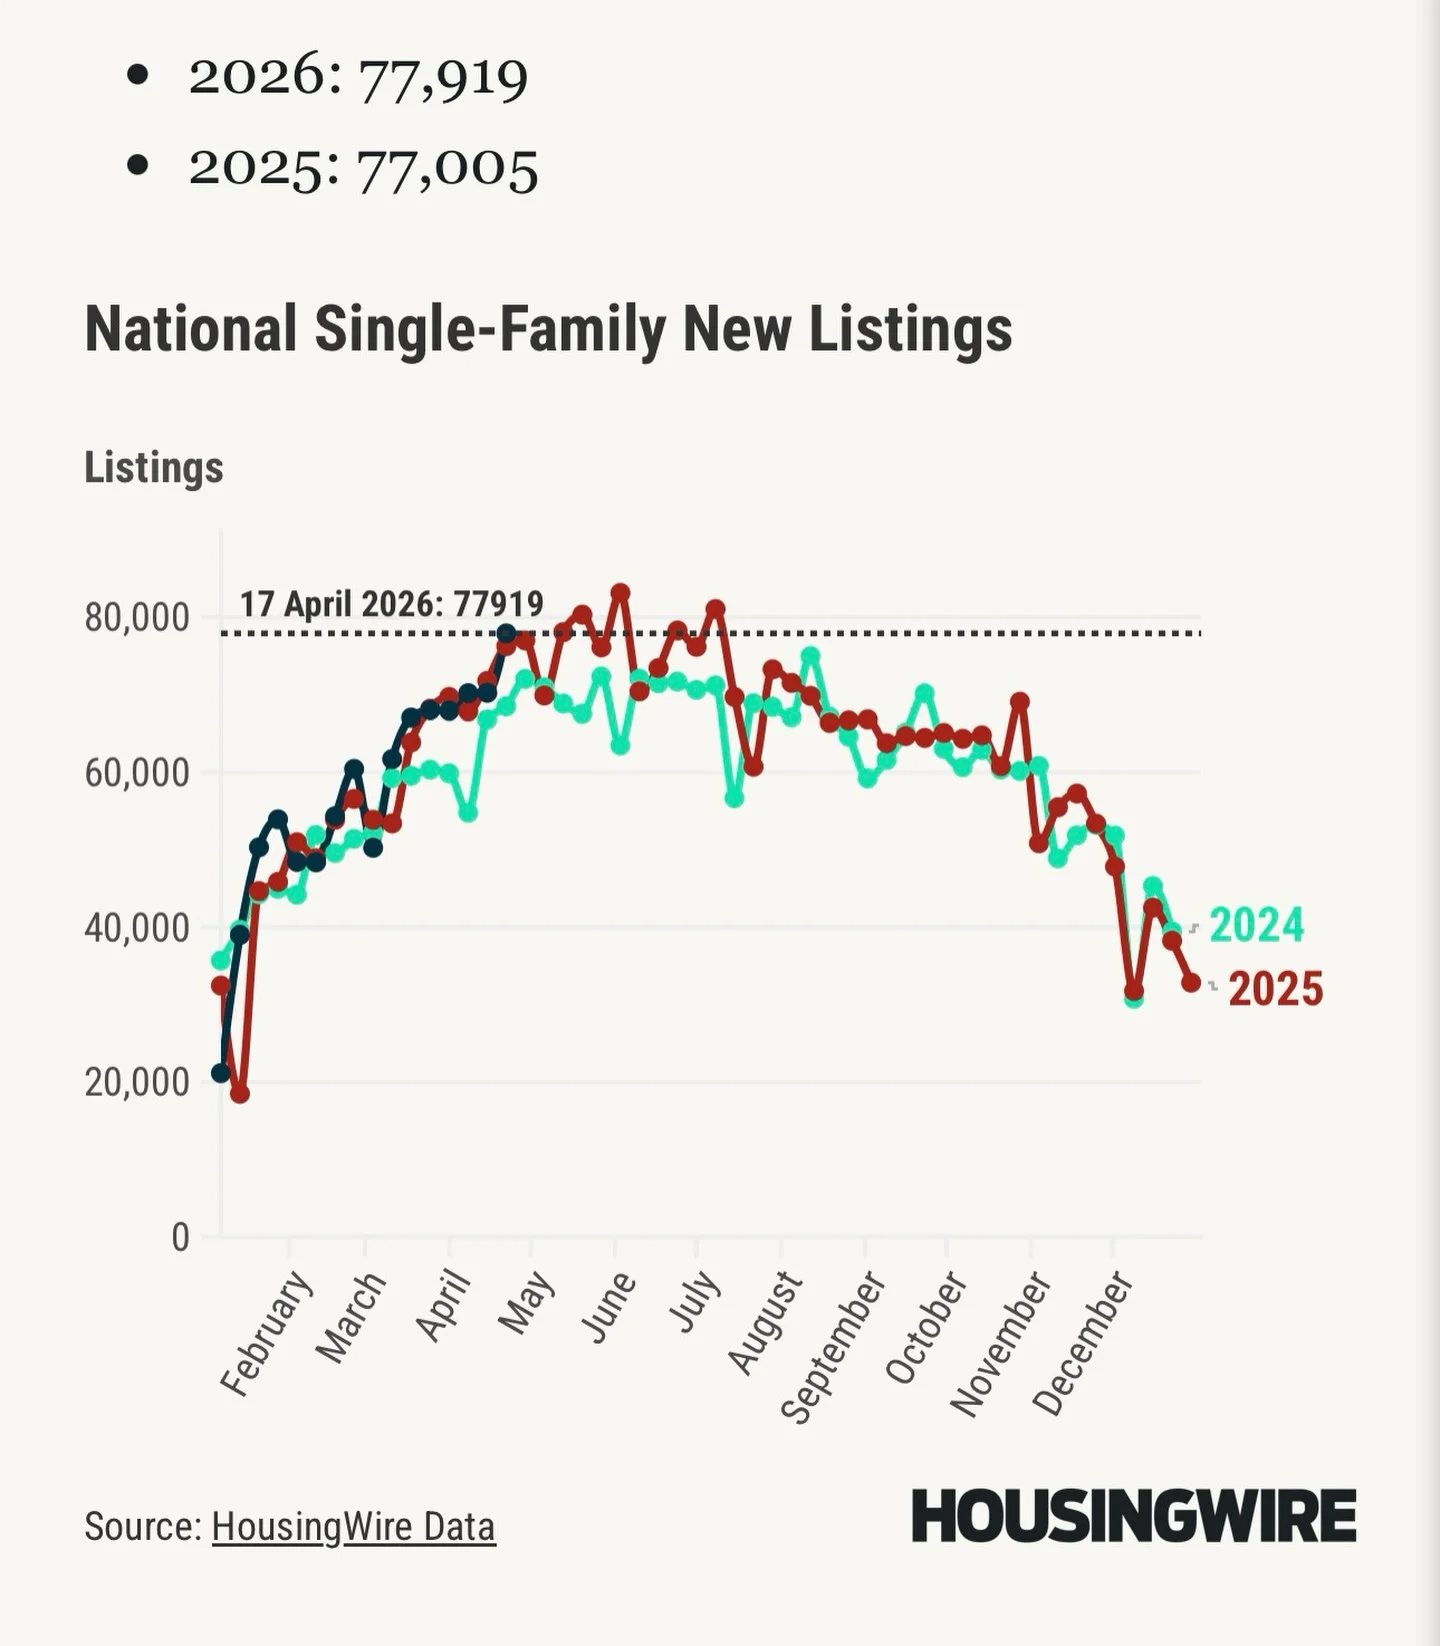
Crash Period Listings Triple Normal Seasonal Peaks
Just a friendly reminder that the new listings data was consistently around 250K-400K per week during the housing bubble crash years. Normally, during seasonal peak weeks, it's 80K-100K. @housingwire @sarahteresa6 #housing #realestate #mortgagerates #chartdaddy

Iran Conflict and Lower Rates Reshape Housing Market
How the Iran Conflict and Falling Rates Are Impacting the Housing Market https://t.co/9umONc87Wf via @YouTube
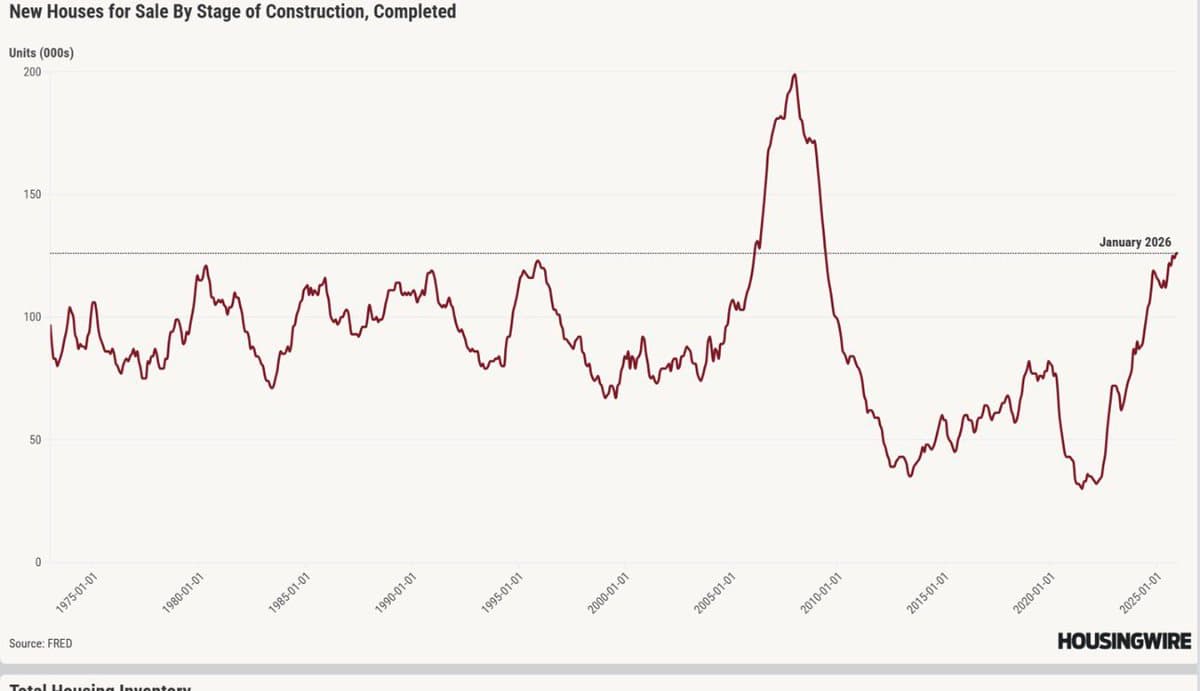
Builders Halt After 120K Units, Permits Drop
This isn't a large amount of inventory in terms of scale, but once we reach 120K completed units, the builders don't push for more construction, so it's not surprising that housing permits and starts are low. https://t.co/YgX6DViH8r

Predicting Post‑Iran Conflict Housing Data Trends
What will housing data look like when the Iran conflict is over? https://t.co/4Ym12HfoDX via @YouTube

Post‑war Housing Outlook: Is 10 Million Home Shortage Real?
Today's podcast discusses when the war finally ends what will #housing look like? Also are we really 10,000,000 homes short 😏. @housingwire @sarahteresa6 #housing #mortgagerates #realestate #chartdaddy

10‑Year Yield >4.10% Triggers Chartdaddy’s Anthem
Whenever the 10-year yield gets above 4.10% the #Chartdaddy sings this song. #mortgagerates #housing #realestate #economics
Inventory Climbs, Listings Far Below Crash‑era Peaks
Surging inventory 😏 … New listings were 77,000 last week. During the housing crash years, weekly numbers ranged from 250K to 400K per week for years. We likely won’t reach 100K during the upcoming peak weeks, which will arrive soon...
Easter Bounce Vs. Rate Cuts: What Drove Recovery?
Was it lower #mortgagerates or the Easter holiday rebound that caused a quick recovery in the data? We take a look at that with this weekend's tracker. @housingwire @sarahteresa6 #housing #realestate #mortgagerates #chartdaddy
Mortgage Spread Surge Drives Major 2026 Market Shift
Hug a #mortgage spread, it has made a big difference in 2026! @housingwire @sarahteresa6 #mortgagerates #realestate #housing #chartdaddy

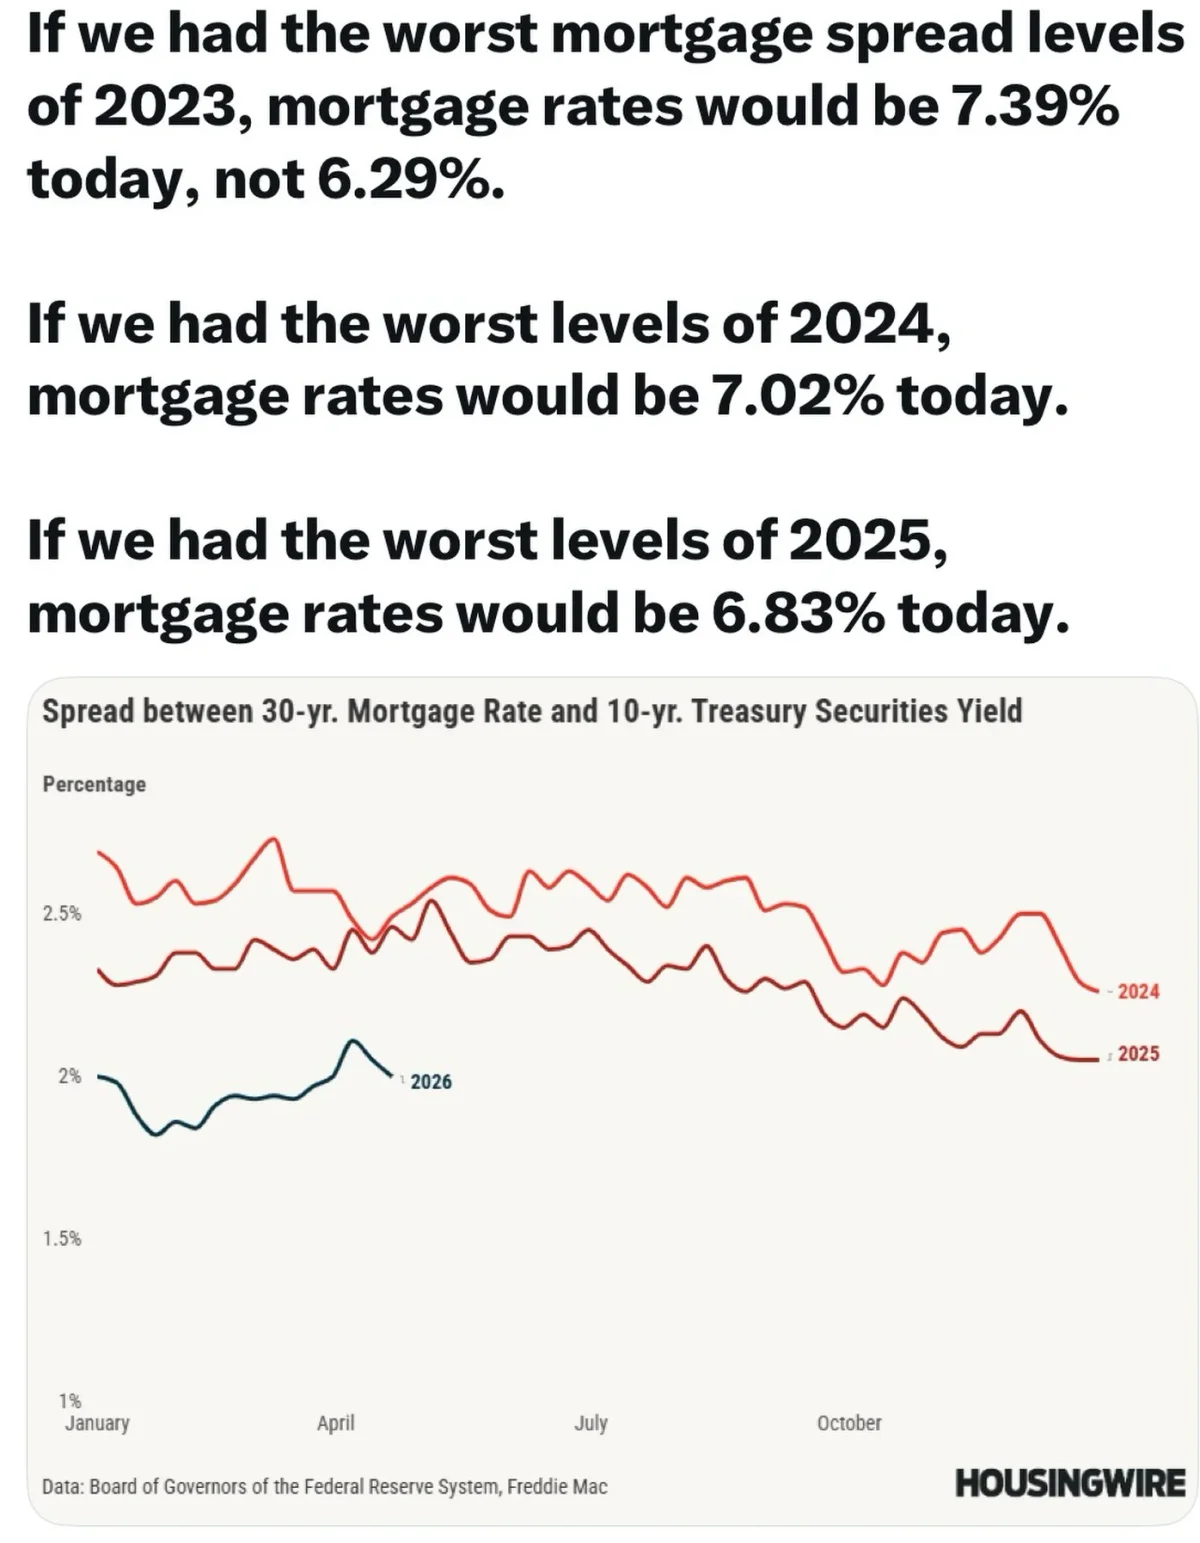
Better Spread Levels Keep Mortgage Rates About 1% Lower
If we had the worst mortgage spread levels of 2023, mortgage rates would be 7.39% today, not 6.29%. If we had the worst levels of 2024, mortgage rates would be 7.02% today. If we had the worst levels of 2025, mortgage rates...

Home Sales Steady; No Waiting Crowd, Life Moves On
There have been nearly 5,000,000 total home sales every year since 2023. The idea that a large group of people is waiting isn’t supported by the data; the peak in the last decade was near 6,000,000. Every day, you get...

Pending Home Sales Return to Year‑Over‑Year Growth
Weekly Pending Home Sales are back to positive year-over-year. "Mind," This week's data is the snap back from the holiday week. Next week will be back to normal, more on this with the weekend tracker

Fed's Post‑War Policy: Cuts or Hikes?
Is the Fed gearing up for rate cuts or rate hikes after the war? https://t.co/rrlbTJ5MBC via @YouTube
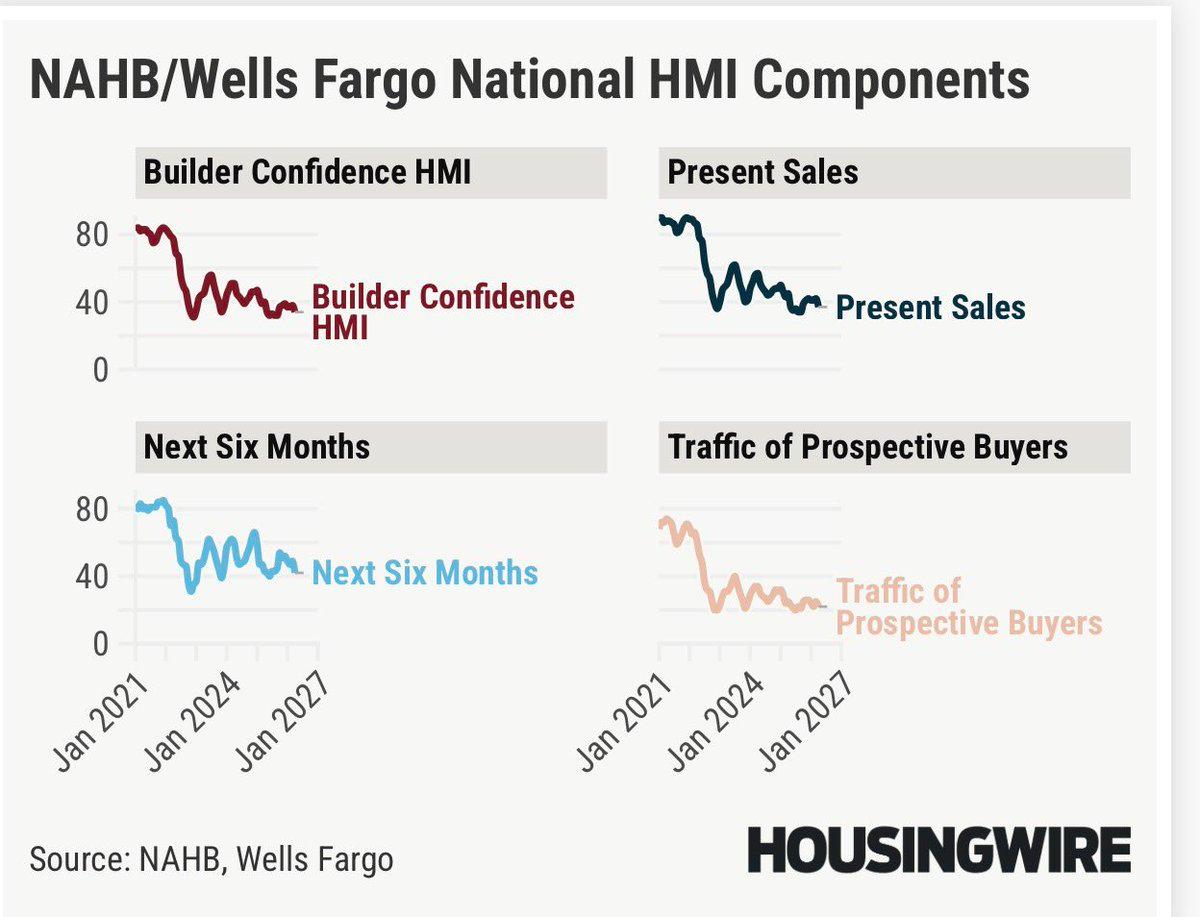
Small Builders Keep 2019 Sales Levels Steady
Not the March of Dimes, but still maintaining the 2019 sale levels. Of course, these are smaller builders who take this survey. https://t.co/9r6kBHAazv
Fed Updates: 24‑Hour News Recap Podcast
What will they do? Today's podcast covers all the news about the Fed from the last 24 hours. @housingwire @sarahteresa6 #housing #realestate #mortgagerates #chartdaddy #economics

Only Two or Three Rate Cuts Remain After War
After the war is over, they will push for lower rates, but realistically, we only have two or maybe three cuts left to reach a neutral policy.

Proposed Elimination of Property Taxes for Seniors May Be Illegal
Next, they will try to eliminate property taxes for those 65 and over 😏 even though legally that might be an issue

Housing Yields Sweet Spot: ≤6.25% Thanks to Spreads
The sweet spot for housing over the past few years has been 6.25% and under, with duration. The only reason we have a shot here again is due to the spreads this year
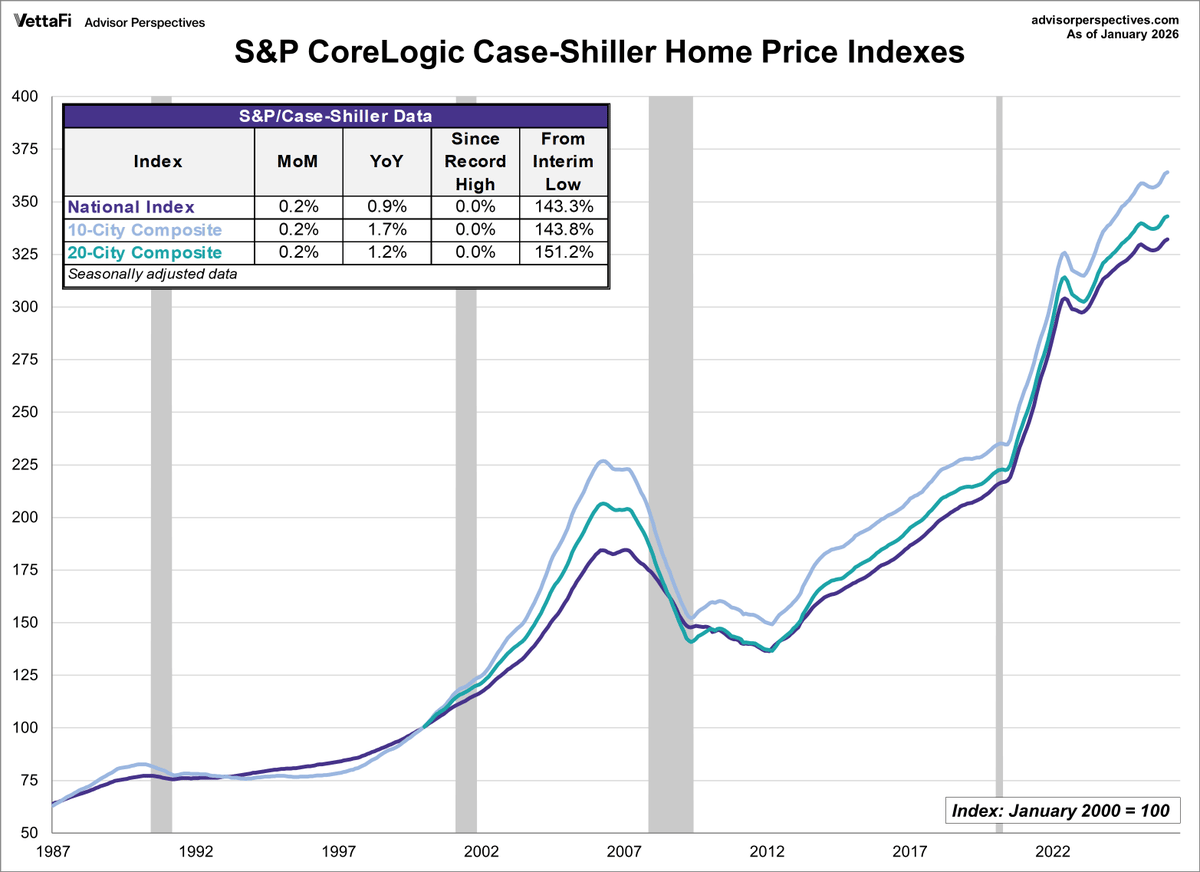
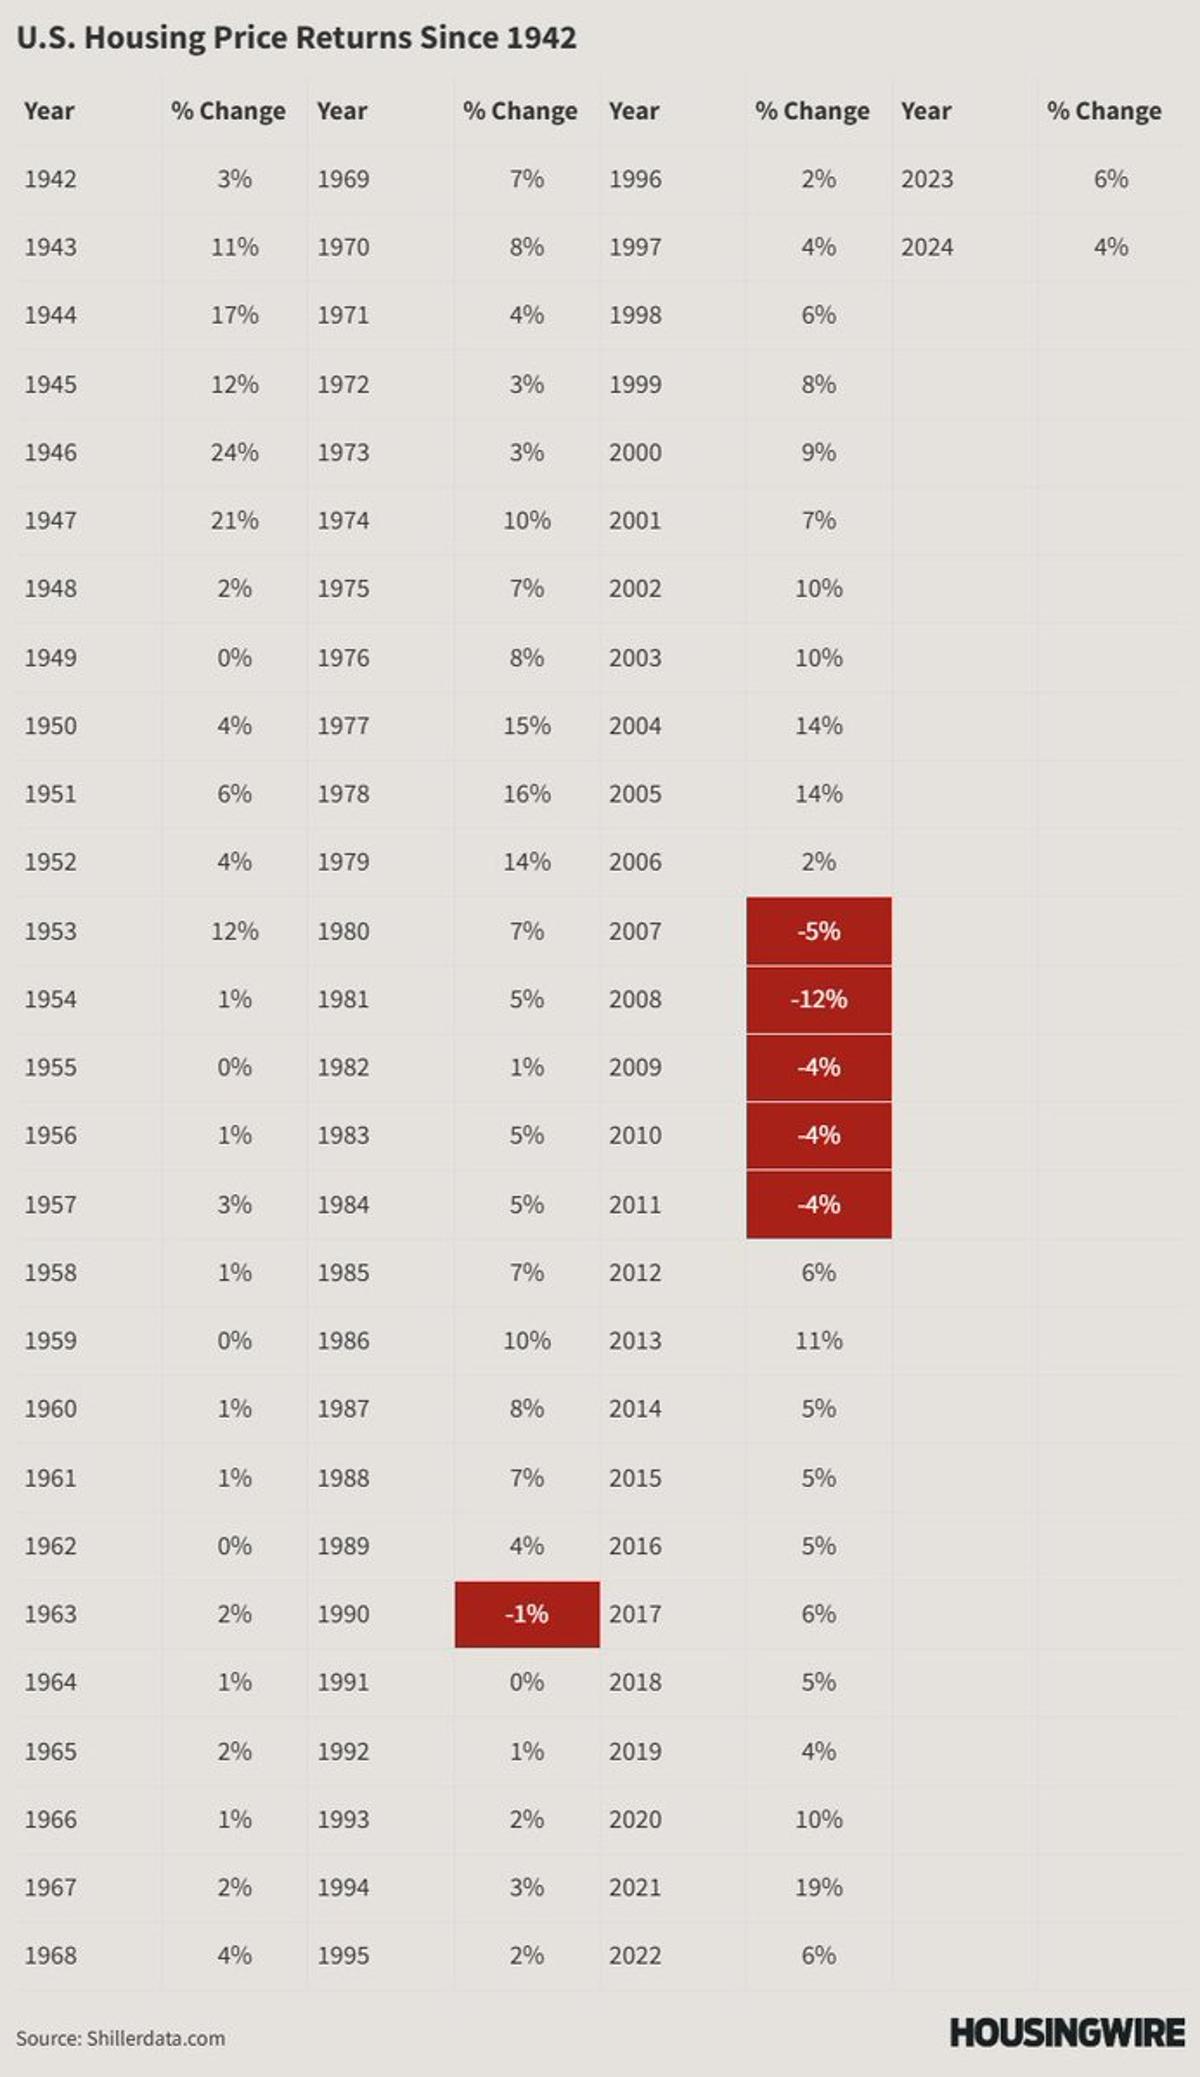
Case‑Shiller Reveals National Housing Price Crash.
If you show the Case-Shiller index instead of a median sales price index, prices have been crashing nationally "The drugs you're on," Wow https://t.co/98Oo6wuBbW

Inventory Shift: Sun Belt Stabilizes, Northeast Declines, Rates Under 6.25%
2026.... Think 2023 data Except that spreads are much lower, we have a lot of rate cuts in the system. Inventory is higher, but hard comps for inventory growth until mid-June. Housing shifted in Mid June of 2025. Look at...

2019 Arms Predicted to Flood Market by 2025
Remember, the 2019 arms were expected to crash the market with listings in 2025. https://t.co/xHprg5yCwD
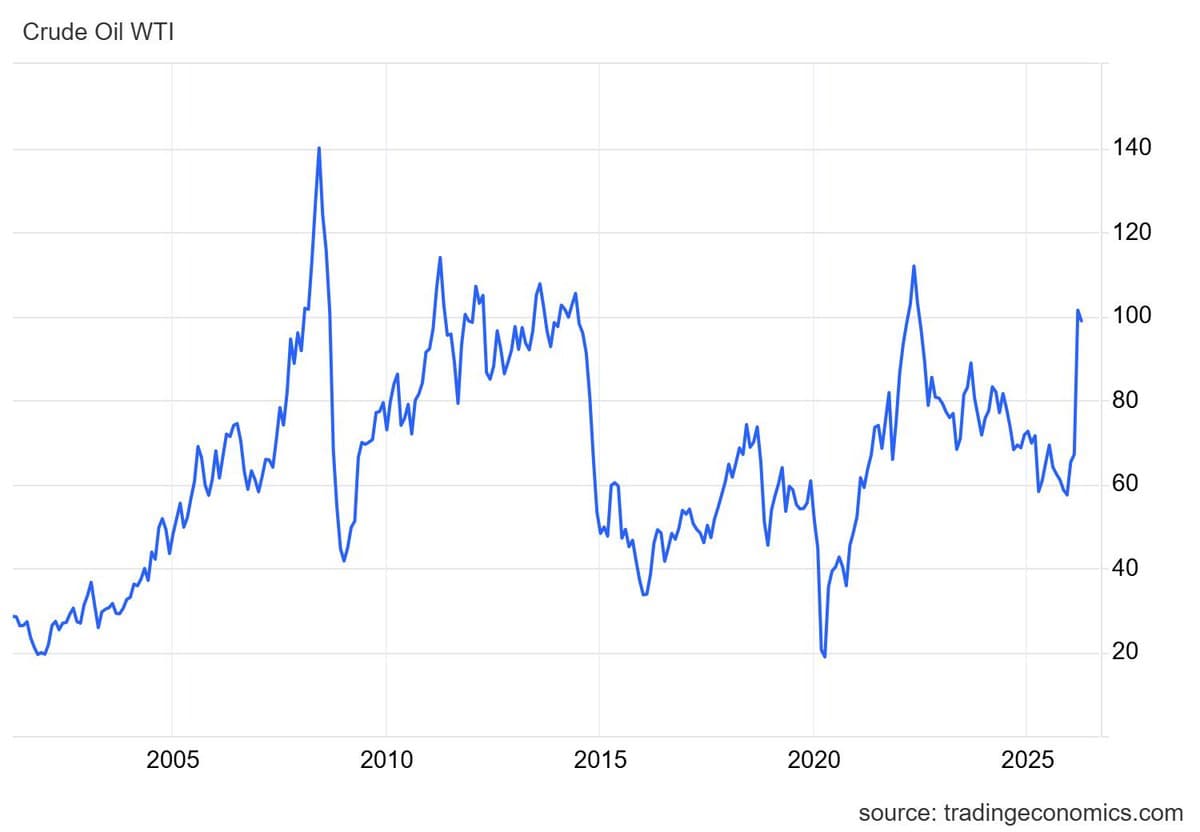
Post‑2010 Reforms Boosted Oil Price Resilience
We have handled higher oil prices better after 2010 than pre 2010 cycles. Post 2005 BK reform and 2010 QM laws https://t.co/SwQzY3OpNQ
Inflation and Iran Tensions Threaten Mortgage Rate Stability
Today we discussed the recent #inflation data and the complications of the Iran conflict for rates if labor stabilizes. @housingwire @sarahteresa6 #oil #mortgagerates #chartdaddy
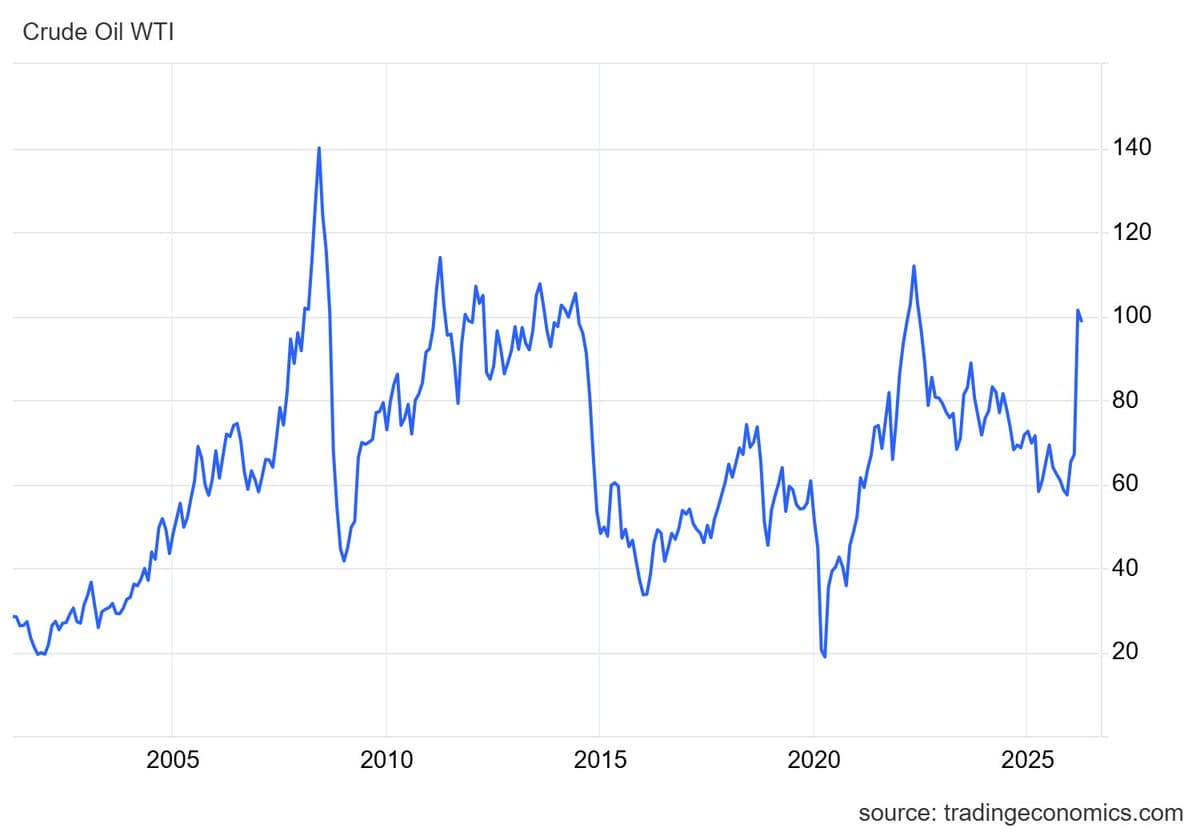
Higher Oil Prices Need Weak Labor Market to Spare Inflation
We have had elevated oil prices before without much impact on core inflation, but back in 2011-2014, the labor market was softer, and wage growth was much lower with lower nominal growth https://t.co/sgut5B2XBG

AirPod Case Theft Reveals Precise Location Tracking Limits
Someone stole my AirPod case, but I can track exactly where they live, 🤔 If I click the sound button, does it still work if it's in another state?

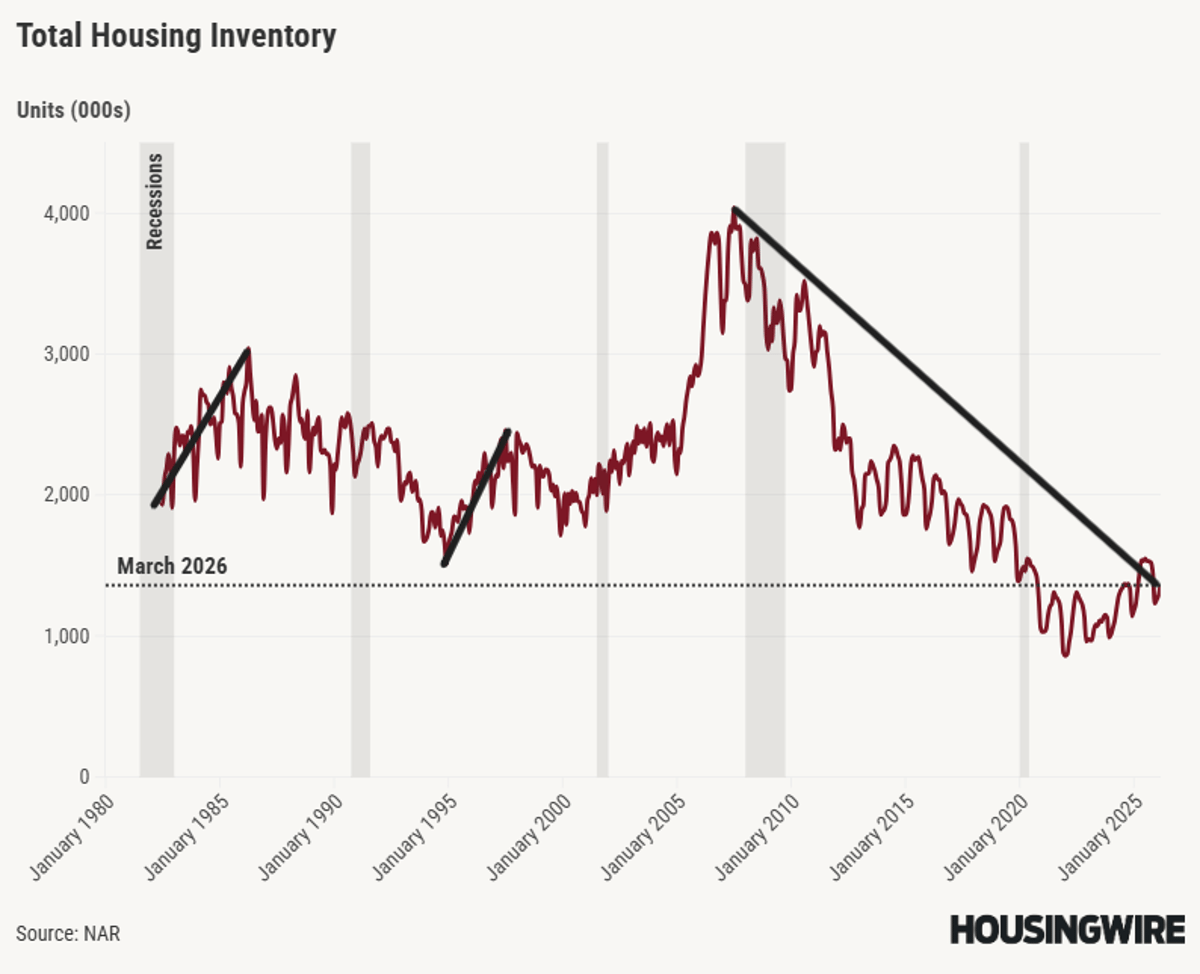
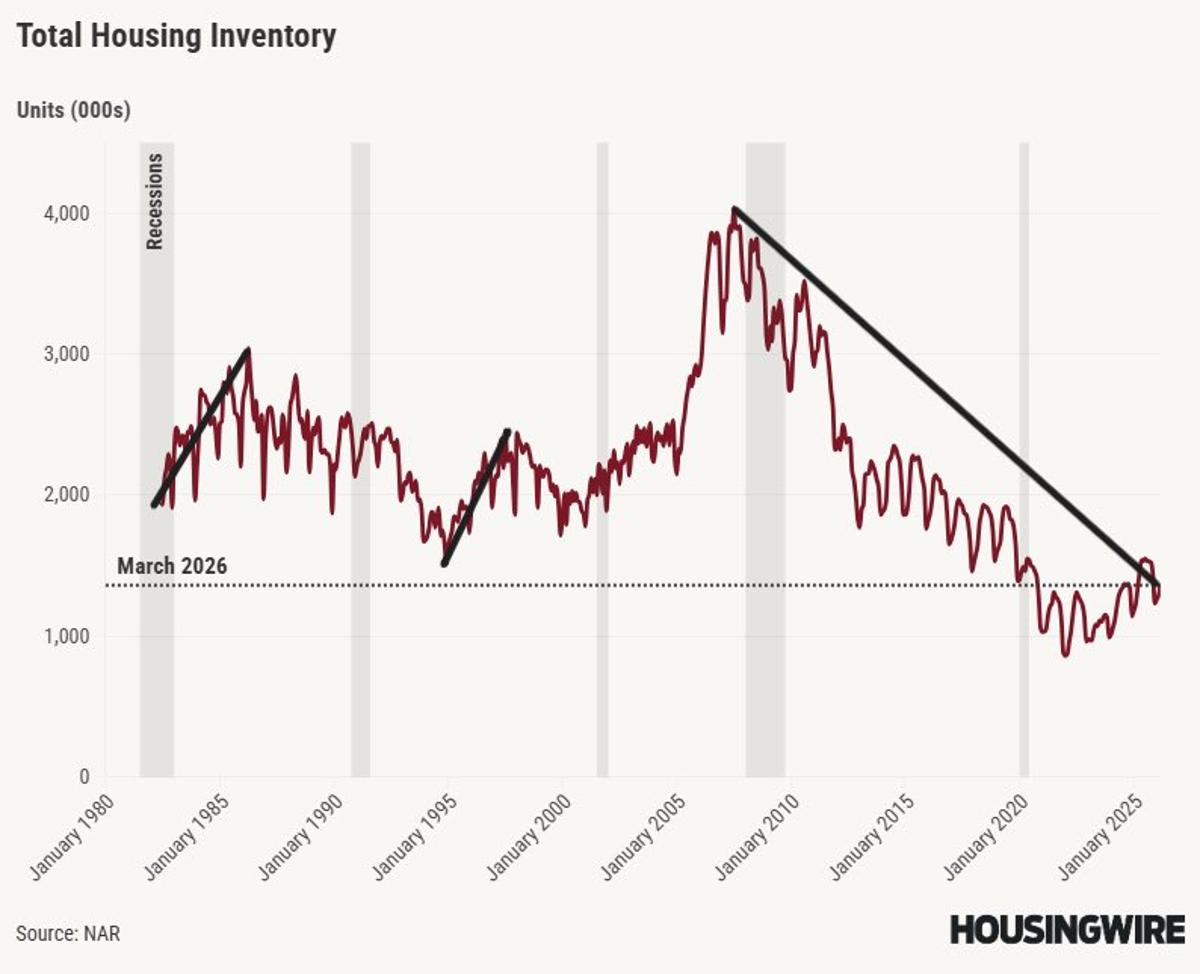
Peak Inventory at 1.5M,
While inventory won't get back to normal 2-2.5 million, having peak inventory above 1.52 million and 4 months plus of supply during the seasonal peak supply months is a much healthier backdrop than in the past

Homes Now Sell in 30‑45 Days, Market Healthier than Covid Era
30-45 days on the market is normal, this is a much healthier marketplace than the Covid years

NAR Pending Data Increasingly Diverges From Existing Sales
Back-to-back months, there is a gap between the NAR's pending and their existing home sales data, which has been more common lately, this is why I am suspect of their pending data

Lower Rates Could Reverse Expected Home Price Decline
My forecast of negative -0.62% national home price growth is at risk if rates go lower

Anti‑central‑bank Activists Have Long Warned Housing Bubble
2012 and on the Anti central bank movement have been bat $:/- crazy about a housing bubble for a long time https://t.co/MIvPSfkR3e
Housing Scarcity Drove Rate Hikes in Early 2021
Dallas and the country, from 2020 to early 2022, didn't have enough housing listings, too many people chasing too few homes. Hence, the entire team higher rates concept in February of 2021 https://t.co/KU1fXBbATF
Current Crisis Surpasses 2008, Don’t Trust the Doomers
Worse, I mean worse, than 2008, how can't you all see this? It's not housing 2008; it's worse... Oh wait Mike and I have tried to teach you all how it works, you got suckered by a bunch of doomers,...

Live Mortgage Rate Lock Debate: 30‑Minute Decision Challenge
You talk too much. Challenge live debate, you and I on spaces, one I can't wait to have 30 minutes to accept my mortgage rate lock-down premise or get blocked, good recording to share among many Do you...
1970s Home Prices Outpaced 2020s Despite Higher Rates
Home prices rose faster from 1977 to 1979, with rates going from 8% to 13% than 2020 to 2022, when rates were sub 4% https://t.co/WlkyoI0JTr

Since 2022, New Listings Aren't Cash‑buyer Sellers
To make it as simple as possible, all the new listings data we have had since 2022, weren't sellers that bought homes with cash people, for F sake, this isn't complicated folks

70‑80% of New Sellers Are Mortgage‑Financed Buyers
New listings data ranged between 30K-80K per week seasonally, 70%-80% of these sellers are buyers, they don't sell and buy with cash. Most buy with mortgages. If you can't get this simple concept, I am no use to you both,...

Older Buyers Driving Mortgage Rate Lockdown, Data Shows
Again, if you analyze the buyer profile data, there’s no logical way we experienced a mortgage rate lockdown. The largest group of buyers tends to be older; the coupon data consistently showed this as they sold their homes with lower...
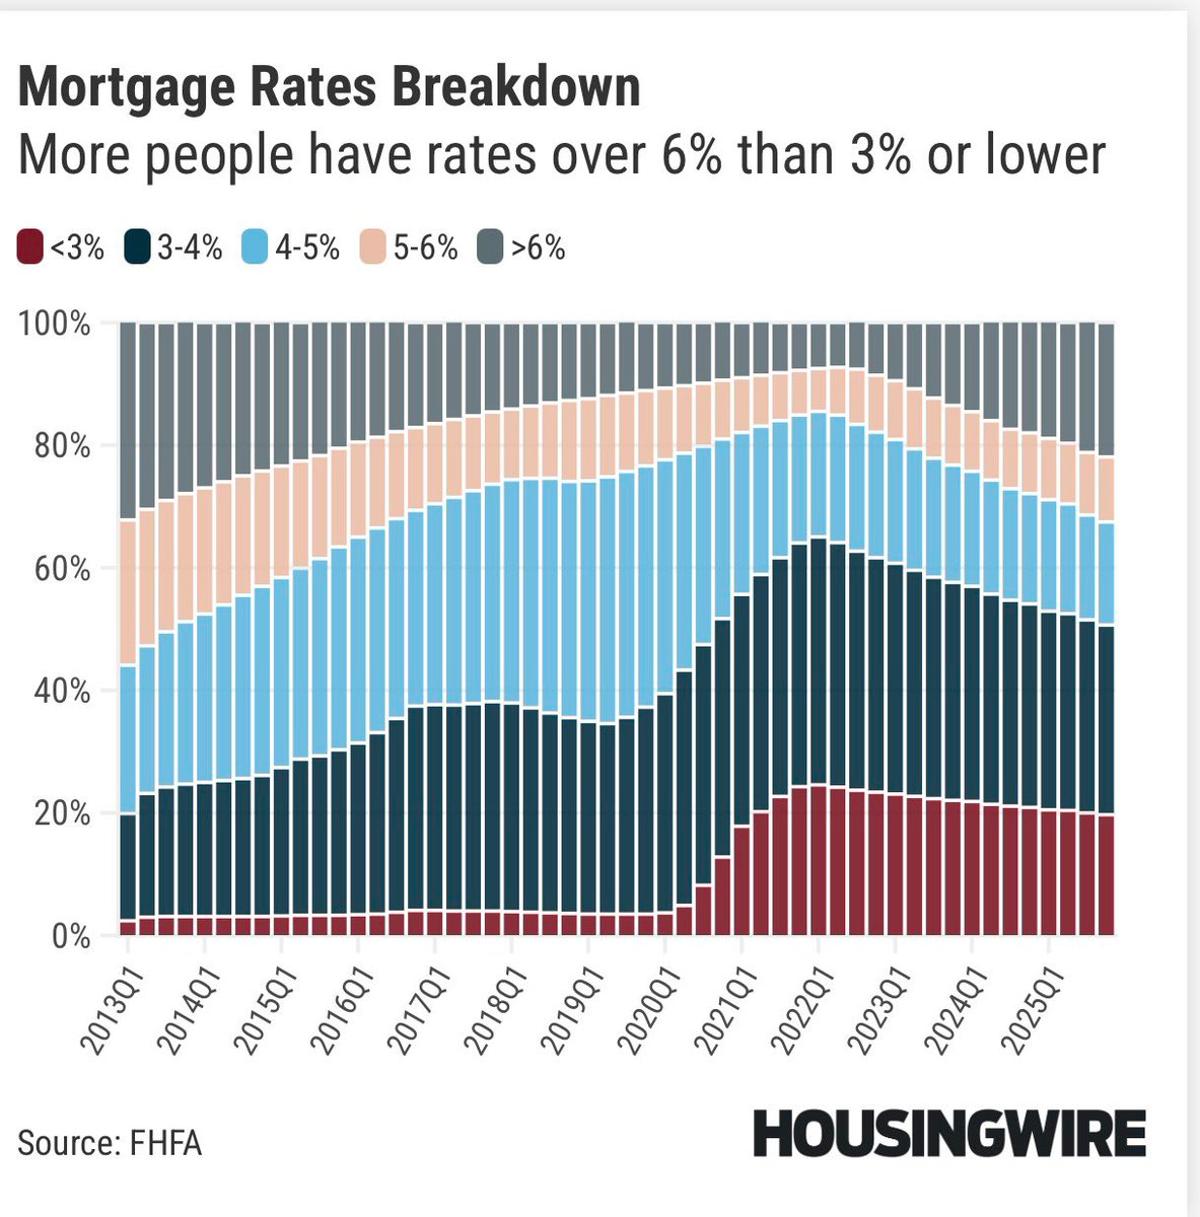
Data Shows Mortgage Rate Lock‑Down Theory Overstated
If the mortgage rate lock-down theory were a real thing, then existing home sales would be near 2 million because the 4 generational sellers that were buyers since late 2022 would not have sold and bought homes. As the data...
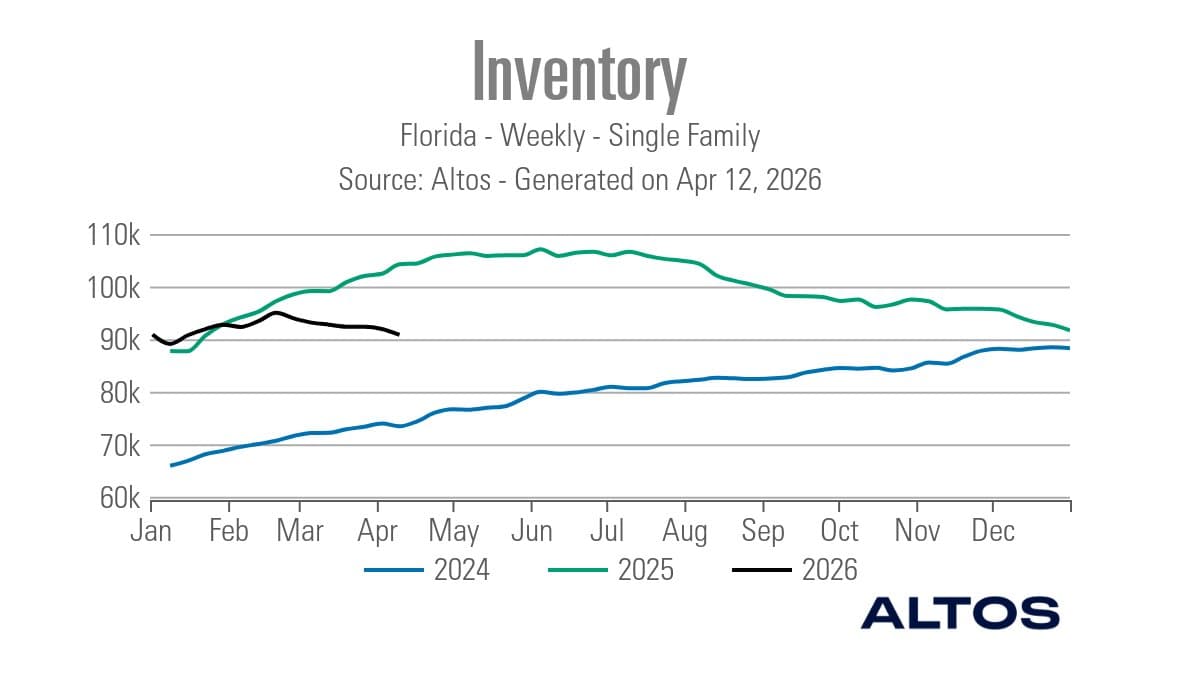
National Inventory Nears Negative YoY, but Not 2008 Levels
The national inventory is on the verge of going negative year over year. States like Florida that have seen a clear year-over-year decline were working from more elevated levels. Context is key, it's not worse than 2008, doom porn is...

Property Taxes Fuel New Red‑Blue State Migration Wave
Red States vs Blue States, the next wave of trying to get migration is going after property taxes