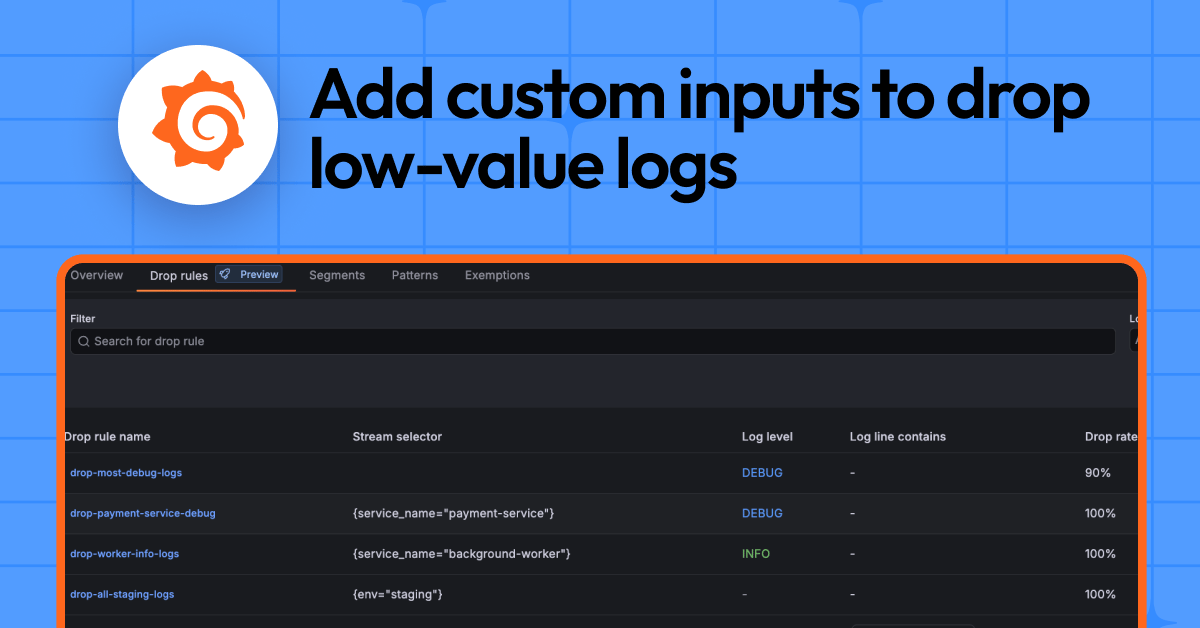
Eliminate Noisy Log Lines with Adaptive Logs Drop Rules
Grafana Cloud has introduced drop‑rules for Adaptive Logs, now in public preview. The feature lets platform and observability teams define custom filters that discard low‑value logs—by level, label, or content—before they are ingested. Drop‑rules work alongside existing exemptions and recommendation patterns, giving administrators granular control over log volume and cost. The capability is available through the Adaptive Logs UI and the gcx CLI, with immediate effect.

Troubleshoot Performance Issues Faster with the New Grafana Assistant Integration for Database Observability
Grafana Cloud has launched a new AI‑driven Assistant integrated into its Database Observability suite, letting users diagnose slow queries directly from live Prometheus and Loki data. The assistant automatically pulls schema, execution plans, and wait‑event metrics, then delivers a health...
Faster Fixes, Less Context Sharing: How Grafana Assistant Learns Your Infrastructure Before You Even Ask
Grafana Assistant now builds a persistent, pre‑loaded knowledge base of your infrastructure by automatically scanning Prometheus, Loki and Tempo data sources. The AI agents map services, metrics, logs and dependencies ahead of any query, storing the information in a vector...
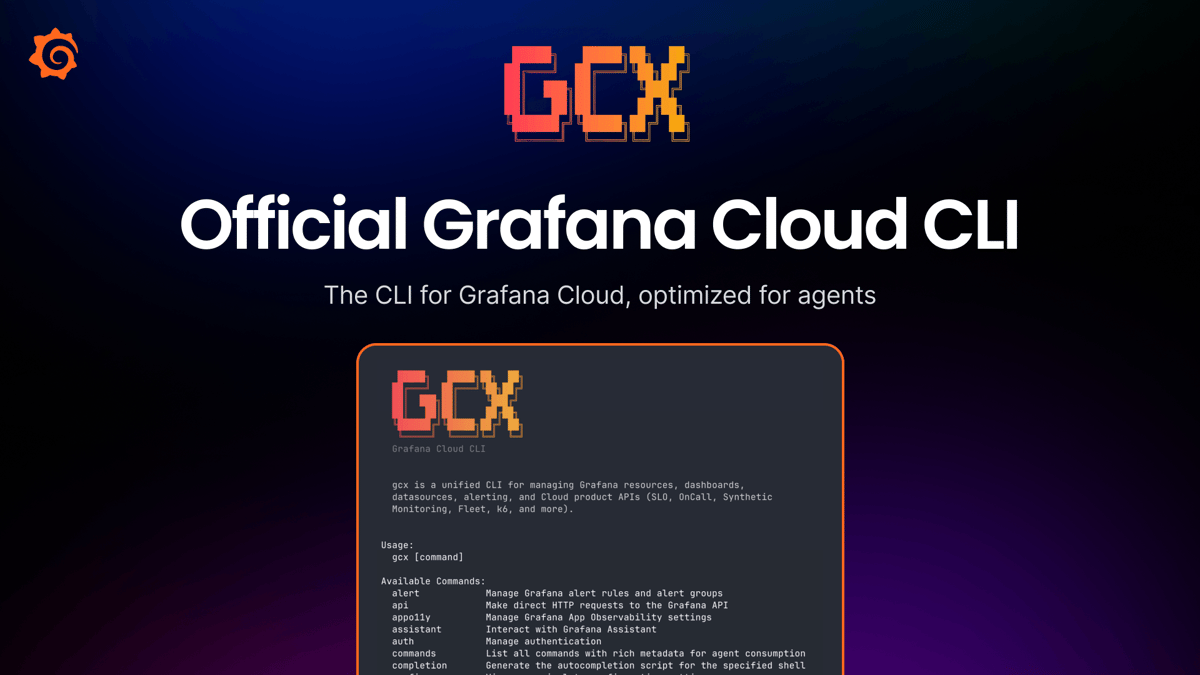
Get Observability in the Terminal, for You and Your Agents, with the Gcx CLI Tool
Grafana has launched a public preview of gcx, a new CLI that brings Grafana Cloud and the Grafana Assistant into the terminal. The tool lets developers and AI agents instrument code, create alerts, define SLOs, and run synthetic checks without...
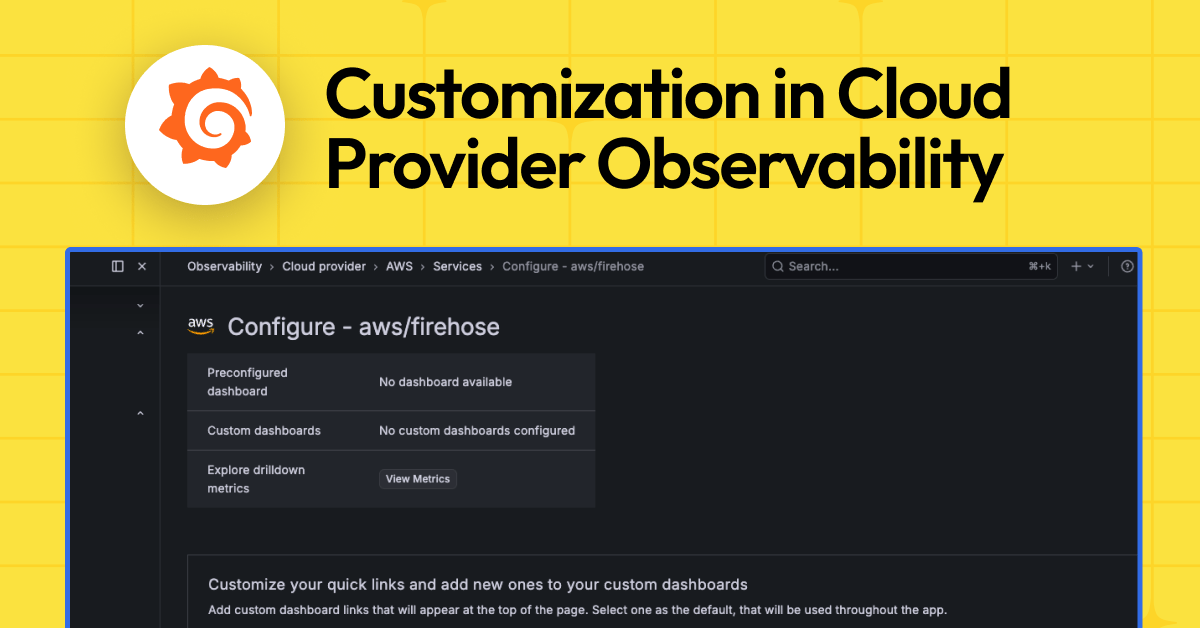
Customize Preconfigured Views for AWS, Azure, and Google Cloud with Cloud Provider Observability in Grafana Cloud
Grafana Cloud has introduced customizable views for its Cloud Provider Observability product, letting users replace or augment the default AWS, Azure, and Google Cloud dashboards. Through a single "Configure" page, teams can attach existing Grafana dashboards, generate new ones with...
Introducing Pyroscope 2.0: Faster, More Cost-Effective Continuous Profiling at Scale
Grafana released Pyroscope 2.0, a ground‑up redesign of its open‑source continuous profiling database that adds native OpenTelemetry Protocol (OTLP) support and removes costly write‑path replication. The new architecture writes each profile once to object storage, co‑locates symbols, and deduplicates data, cutting...
Grafana Assistant Everywhere: Customize and Connect to the AI Agent to Fit Your Specific Needs
Grafana announced that its AI‑driven Grafana Assistant is no longer limited to Grafana Cloud; it can now be deployed in self‑managed Grafana Enterprise and OSS environments. Users can connect a Grafana instance to a free Grafana Cloud account with a...
Grafana Labs Acquires Logline to Accelerate Needle-in-the-Haystack Log Queries
Grafana Labs announced the acquisition of Logline at GrafanaCON 2026 to boost Loki’s ability to handle high‑cardinality, needle‑in‑the‑haystack log queries. Logline’s indexing technology targets object storage, enabling dramatically faster searches without altering Loki’s low‑cost, label‑based architecture. Early benchmarks show a...
An Early Look at the Grafana Marketplace: Expanding the Big Tent
Grafana Labs announced the pilot launch of the Grafana Marketplace at GrafanaCON 2026, creating a new platform for selling and distributing both paid and free plugins. The marketplace builds on an existing catalog of more than 300 plugins and introduces...
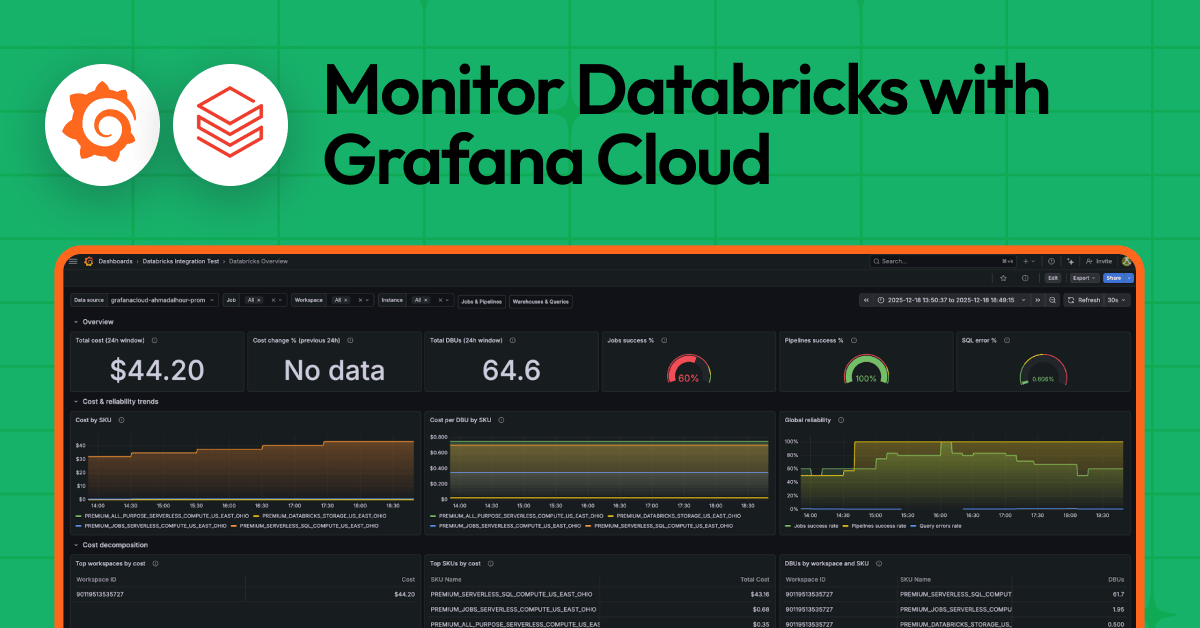
Monitor Databricks with Grafana Cloud for Instant Visibility Into Your Workloads
Grafana Cloud launched a native Databricks integration that streams billing, job, pipeline, and SQL warehouse metrics directly into Grafana dashboards. The offering includes three prebuilt dashboards and 14 default alert rules tailored for FinOps, SRE, and analytics teams, eliminating the...

Grafana Alerting: Respond Faster and Get Situational Awareness with Alert Enrichment in Grafana Cloud
Grafana Cloud has launched a public‑preview feature called alert enrichment, which lets users attach contextual data—such as log snippets, dashboard links, and AI‑generated explanations—to alert notifications. The enrichment process runs at the rule level or globally, pulling information from external...

Kubernetes Monitoring Helm Chart V4: Biggest Update Ever!
Grafana’s Kubernetes Monitoring Helm chart has launched version 4, its most extensive overhaul yet. The update replaces list‑based configurations with map‑based structures for destinations, collectors, and telemetry services, allowing granular overrides and smoother GitOps workflows. New preset‑driven collector definitions, split...

Observability in Go: Where to Start and What Matters Most
Grafana Labs’ "Big Tent" podcast hosted a deep dive into Go observability, emphasizing that logging is the natural starting point. The hosts explained how logs can be transformed into actionable metrics, such as panic frequency, and fed into Grafana Loki...
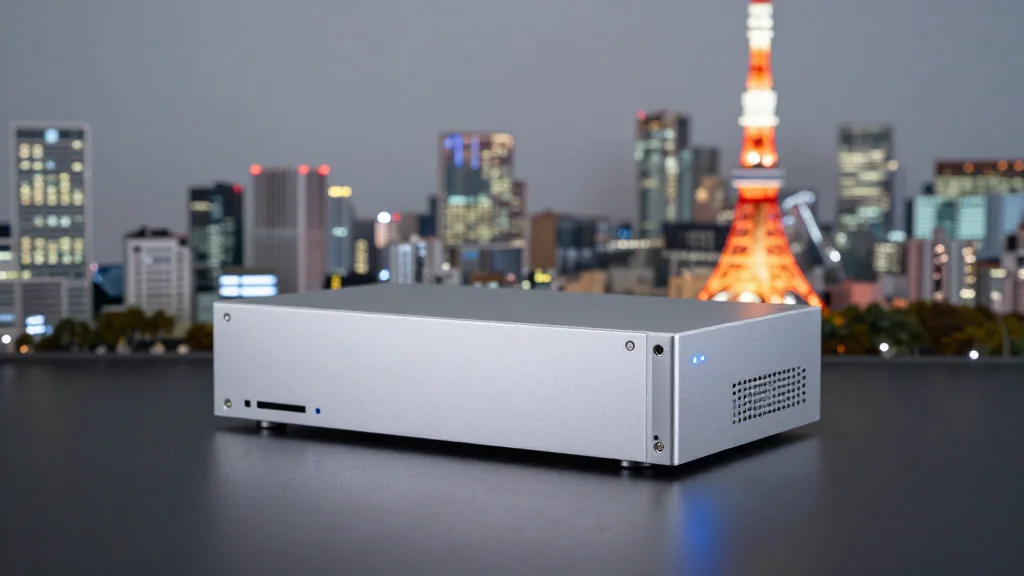
Grafana Labs Brings Grafana Cloud & Grafana BYOC to Japan with AWS Tokyo Region Availability
Grafana Labs announced that its Grafana Cloud SaaS and Bring Your Own Cloud (BYOC) offerings are now available in the AWS Tokyo region, marking the company’s first dedicated infrastructure in Japan. The move enables Japanese customers to host observability workloads...

Grafana Security Release: Critical and High Severity Security Fixes for CVE-2026-27876 and CVE-2026-27880
Grafana Labs announced version 12.4.2 and patched releases for 12.3, 12.2, 12.1 and 11.6, addressing two high‑impact vulnerabilities. CVE‑2026‑27876 is a critical 9.1‑rated remote‑code‑execution flaw in the sqlExpressions feature that allows arbitrary file writes. CVE‑2026‑27880 is a high‑severity 7.5‑rated denial‑of‑service...